You are not logged in.
This means you
CAN ONLY VIEW reports that were published prior to Wednesday, April 2, 2025.
You
MUST UPGRADE YOUR MEMBERSHIP if you want to see any current reports.
AFTER MARKET UPDATE - MONDAY, JANUARY 24TH, 2022
Previous After Market Report Next After Market Report >>>
|
|
|
|
DOW |
+99.13 |
34,364.50 |
+0.29% |
|
Volume |
1,493,447,886 |
+16% |
|
Volume |
6,971,708,500 |
+20% |
|
NASDAQ |
+86.21 |
13,855.13 |
+0.63% |
|
Advancers |
1,464 |
46% |
|
Advancers |
2,260 |
53% |
|
S&P 500 |
+12.19 |
4,410.13 |
+0.28% |
|
Decliners |
1,692 |
54% |
|
Decliners |
2,032 |
47% |
|
Russell 2000 |
+45.59 |
2,033.51 |
+2.29% |
|
52 Wk Highs |
7 |
|
|
52 Wk Highs |
18 |
|
|
S&P 600 |
+29.03 |
1,311.30 |
+2.26% |
|
52 Wk Lows |
792 |
|
|
52 Wk Lows |
1,755 |
|
|
Damaging losses for the major averages recently signaled a market correction (M criteria). Greater caution is advised until strength returns. Disciplined investors know to avoid new buying efforts and to raise cash by selling faltering stocks on a case-by-case basis.
|
 |
Rebound Helped Major Indices Manage a "Positive Reversal"
Kenneth J. Gruneisen - Passed the CAN SLIM® Master's Exam
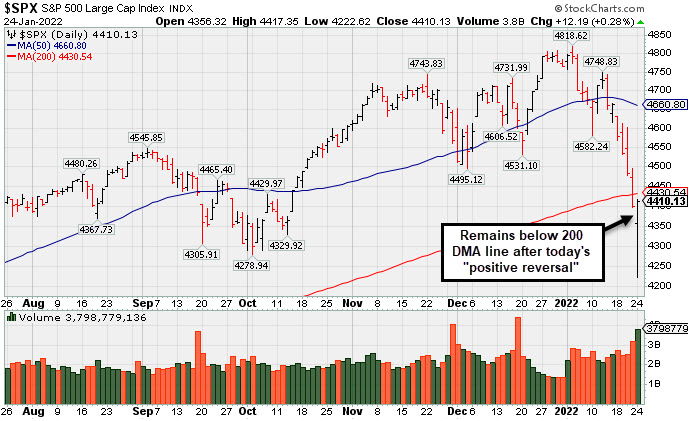
The S&P 500 added 0.3%, erasing an earlier drop that had temporarily pushed the broad benchmark into correction territory, defined as a 10% decline from a recent peak. The Nasdaq Composite advanced 0.6%, climbing back from an earlier rout of nearly 5%. The Dow gained 99 points, recouping all of its more than 1,000-point intraday loss and snapping a six-day losing streak. The small-cap Russell 2000 Index surged roughly 2% after briefly tumbling into bear market territory, defined as a 20% drop from a recent all-time high. Volume totals reported on Monday were higher than Friday's totals, which were inflated by options expirations, on the NYSE and on the Nasdaq exchange. Decliners led advancers by a narrow margin on the NYSE and advancers narrowly led decliners on the Nasdaq exchange. It was the 2nd consecutive session with zero high-ranked companies from the Leaders List that hit new 52-week highs and were listed on the BreakOuts Page, down from a total of 41 on Friday, January 14th. New 52-week lows totals expanded and outnumbered new 52-week highs by more than 110-1 on the NYSE and by almost 100-1 on the Nasdaq exchange. The market averages (M criteria) have seen damaging losses noted that signaled a more serious market correction. Greater caution is suggested until noted strength returns. PICTURED: The S&P 500 Index still remains below its 200-day moving average (DMA) line despite a "positive reversal" on Monday with higher volume following 4 consecutive losses.
U.S. stocks finished higher on Monday as some investors finally emerged to buy the dip in equities. Eight of 11 S&P 500 sectors closed in positive territory, with the more traditionally defensive Utilities, Consumer Staples, and Health Care groups lagging.
A perceived risk off tone had characterized most of the session following the worst weekly drawdown for both the S&P 500 and Nasdaq Composite since March 2020. Wall Street is bracing for a busy week of corporate earnings and the start of the Federal Reserve’s (Fed) two-day policy meeting tomorrow, remaining jittery about looming monetary policy tightening.
Perceived safe haven assets caught a bid early in the session amid escalating geopolitical tensions between Russia and Ukraine. In FOREX trading, a gauge of the U.S. dollar jumped 0.3%. However, the yield on the 10-year note finished one basis point higher (0.01%) at 1.77%. The yield on the two-year note fell three basis points (0.03%) to 0.97% after its $54 billion auction was met with the strongest demand since February 2020.
|
 Kenneth J. Gruneisen started out as a licensed stockbroker in August 1987, a couple of months prior to the historic stock market crash that took the Dow Jones Industrial Average down -22.6% in a single day. He has published daily fact-based fundamental and technical analysis on high-ranked stocks online for two decades. Through FACTBASEDINVESTING.COM, Kenneth provides educational articles, news, market commentary, and other information regarding proven investment systems that work in good times and bad.
Comments contained in the body of this report are technical opinions only and are not necessarily those of Gruneisen Growth Corp. The material herein has been obtained from sources believed to be reliable and accurate, however, its accuracy and completeness cannot be guaranteed. Our firm, employees, and customers may effect transactions, including transactions contrary to any recommendation herein, or have positions in the securities mentioned herein or options with respect thereto. Any recommendation contained in this report may not be suitable for all investors and it is not to be deemed an offer or solicitation on our part with respect to the purchase or sale of any securities. |
|
 |
Retail, Financial, Oil Services, and Tech Indices Rallied in Afternoon
Kenneth J. Gruneisen - Passed the CAN SLIM® Master's Exam
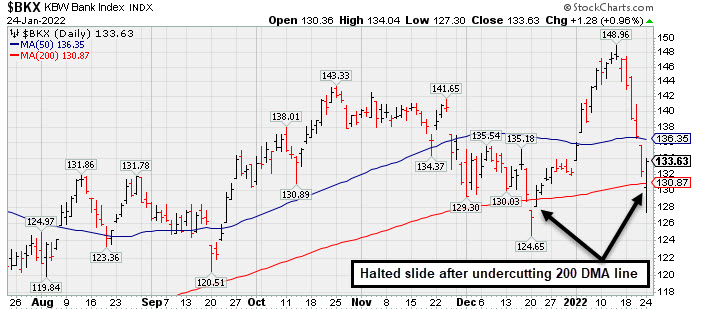
The Retail Index ($RLX +2.26%) and Bank Index ($BKX +0.96%) both outpaced the Broker/Dealer Index ($XBD +0.19%) as stocks overcame early weakness. The Biotech Index ($BTK +1.89%), Semiconductor Index ($SOX +1.31%), and Networking Index ($NWX +1.90%) each overcame big losses on the session to end higher after an impressive late-afternoon rebound. Commodity-linked groups were mixed as the Oil Services Index ($OSX +2.27%) posted a big gain while the Integrated Oil Index ($XOI -0.01%) finished flat and the Gold & Silver Index ($XAU -1.23%) lost ground.
PICTURED: The Bank Index ($BKX +0.96%) halted its slide on Monday after again undercutting its 200 DMA line. More damaging weakness in the financial indexes would bode poorly for the market outlook since the financials have been reliable leading indicators for the broader market.
| Oil Services |
$OSX |
61.95 |
+1.37 |
+2.27% |
+17.51% |
| Integrated Oil |
$XOI |
1,324.05 |
-0.12 |
-0.01% |
+12.38% |
| Semiconductor |
$SOX |
3,479.95 |
+45.16 |
+1.31% |
-11.81% |
| Networking |
$NWX |
870.69 |
+16.23 |
+1.90% |
-10.34% |
| Broker/Dealer |
$XBD |
462.81 |
+0.88 |
+0.19% |
-4.94% |
| Retail |
$RLX |
3,723.98 |
+82.43 |
+2.26% |
-11.89% |
| Gold & Silver |
$XAU |
128.40 |
-1.59 |
-1.23% |
-3.06% |
| Bank |
$BKX |
133.63 |
+1.28 |
+0.96% |
+1.06% |
| Biotech |
$BTK |
5,001.52 |
+92.63 |
+1.89% |
-9.37% |
|
|
|
 |
Positive Reversal After Undercutting 200-Day Moving Average
Kenneth J. Gruneisen - Passed the CAN SLIM® Master's Exam
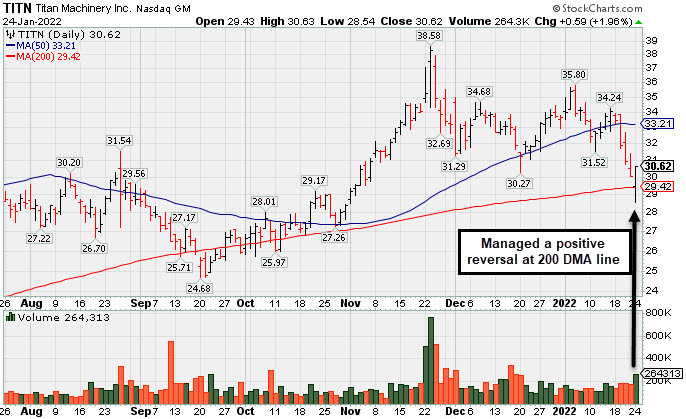
Titan Machinery Inc (TITN +$0.10 or +0.33% to $30.13) managed a "positive reversal" today after undercutting both its 200-day moving average (DMA) line ($29.42) and the prior low ($30.27 on 12/20/21). A rebound above the 50 DMA line ($33.21) is still needed for its outlook to improve. It faces resistance due to overhead supply up to the $38 level.
Fundamentals remain strong. TITN was first highlighted in yellow in the 11/23/21 mid-day report (read here) with pivot point cited base on its 6/01/21 high plus 10 cents. It was last shown in this FSU section on 12/31/21 with detailed analysis and an annotated graph under the headline, "Recently Found Support at 50-Day Moving Average Line". Bullish action came after it reported Oct '21 quarterly earnings +81% on +26% sales revenues versus the year ago period, its 4th strong quarterly comparison. It currently has the highest possible earnings Per Share Rating of 99. Following years of losses it has shown strong earnings growth for FY '19-21.
The small supply of only 22.6 million shares outstanding (S criteria) can contribute to greater price volatility in the event of institutional buying or selling. The number of top-rated funds owning its shares rose from 241 in Dec '20 to 315 in Dec '21, a reassuring sign concerning the I criteria. Its current Up/Down Volume Ratio of 1.1 is an unbiased indication its shares have been under slight accumulation over the past 50 days.
|
|
|
Color Codes Explained :
Y - Better candidates highlighted by our
staff of experts.
G - Previously featured
in past reports as yellow but may no longer be buyable under the
guidelines.
***Last / Change / Volume data in this table is the closing quote data***
Symbol/Exchange
Company Name
Industry Group |
PRICE |
CHANGE
(%Change) |
Day High |
Volume
(% DAV)
(% 50 day avg vol) |
52 Wk Hi
% From Hi |
Featured
Date |
Price
Featured |
Pivot Featured |
|
Max Buy |
 REGN
-
NASDAQ
REGN
-
NASDAQ
Regeneron Pharmaceutical
DRUGS - Biotechnology
|
$621.48
|
+0.08
0.01% |
$623.54
|
1,124,878
156.45% of 50 DAV
50 DAV is 719,000
|
$686.62
-9.49%
|
12/13/2021
|
$647.95
|
PP = $686.72
|
|
MB = $721.06
|
 Most Recent Note - 1/24/2022 5:48:14 PM
G - Posted a 2nd consecutive gain today backed by above average volume. A rebound above the 50 DMA line ($632) still is needed for its outlook to improve. Prior lows and its 200 DMA line ($586) define the next important support.
>>> FEATURED STOCK ARTICLE : Regeneron Still Lingering Below 50-Day Moving Average Line - 1/11/2022 |
View all notes |
Set NEW NOTE alert |
Company Profile |
SEC
News |
Chart |
Request a new note
C
A
S
I |
LLY
-
NYSE
Eli Lilly & Co
Medical-Diversified
|
$240.42
|
-2.64
-1.09% |
$243.76
|
3,655,749
118.12% of 50 DAV
50 DAV is 3,095,000
|
$283.91
-15.32%
|
12/16/2021
|
$279.28
|
PP = $275.97
|
|
MB = $289.77
|
Most Recent Note - 1/24/2022 5:47:09 PM
Undercut its prior low and tested its 200 DMA line ($236.91) with today's 4th consecutive loss raising concerns and triggering technical sell signals. A rebound above the 50 DMA line ($258) is needed for its outlook to improve. It will be dropped from the Featured Stocks list tonight.
>>> FEATURED STOCK ARTICLE : Stalled and Slumped Well Below 50 DMA Line - 1/19/2022 |
View all notes |
Set NEW NOTE alert |
Company Profile |
SEC
News |
Chart |
Request a new note
C
A
S
I |
UMC
-
NYSE
United Microelectrnc Adr
ELECTRONICS - Semiconductor - Integrated Cir
|
$10.91
|
+0.03
0.28% |
$10.94
|
19,228,252
267.65% of 50 DAV
50 DAV is 7,184,000
|
$12.68
-13.96%
|
12/1/2021
|
$12.60
|
PP = $12.72
|
|
MB = $13.36
|
Most Recent Note - 1/24/2022 5:44:03 PM
Y - Managed a "positive reversal" today after undercutting both its prior low and its 200 DMA line. Still below its 50 DMA line ($11.45) and a rebound above it is needed for its outlook to improve. A gain and solid close above the pivot point may help clinch a proper new (or add-on) technical buy signal. Reported Sep '21 quarterly earnings +100% on +30% sales revenues versus the year ago period.
>>> FEATURED STOCK ARTICLE : Testing Support and Perched Not Far From Prior Highs - 1/4/2022 |
View all notes |
Set NEW NOTE alert |
Company Profile |
SEC
News |
Chart |
Request a new note
C
A
S
I |
TITN
-
NASDAQ
Titan Machinery Inc
SPECIALTY RETAIL
|
$30.62
|
+0.59
1.96% |
$30.63
|
264,249
139.81% of 50 DAV
50 DAV is 189,000
|
$38.58
-20.63%
|
11/23/2021
|
$36.22
|
PP = $35.34
|
|
MB = $37.11
|
Most Recent Note - 1/24/2022 5:38:53 PM
G - Managed a "positive reversal" today after undercutting both its 200 DMA line and the prior low ($30.27 on 12/20/21). A rebound above the 50 DMA line ($33.20) still is needed for its outlook to improve. It faces resistance due to overhead supply up to the $38 level. Fundamentals remain strong. See the latest FSU analysis for more details and a new annotated graph.
>>> FEATURED STOCK ARTICLE : Positive Reversal After Undercutting 200-Day Moving Average - 1/24/2022 |
View all notes |
Set NEW NOTE alert |
Company Profile |
SEC
News |
Chart |
Request a new note
C
A
S
I |
|
|
|
THESE ARE NOT BUY RECOMMENDATIONS!
Comments contained in the body of this report are technical
opinions only. The material herein has been obtained
from sources believed to be reliable and accurate, however,
its accuracy and completeness cannot be guaranteed.
This site is not an investment advisor, hence it does
not endorse or recommend any securities or other investments.
Any recommendation contained in this report may not
be suitable for all investors and it is not to be deemed
an offer or solicitation on our part with respect to
the purchase or sale of any securities. All trademarks,
service marks and trade names appearing in this report
are the property of their respective owners, and are
likewise used for identification purposes only.
This report is a service available
only to active Paid Premium Members.
You may opt-out of receiving report notifications
at any time. Questions or comments may be submitted
by writing to Premium Membership Services 665 S.E. 10 Street, Suite 201 Deerfield Beach, FL 33441-5634 or by calling 1-800-965-8307
or 954-785-1121.
|
|
|