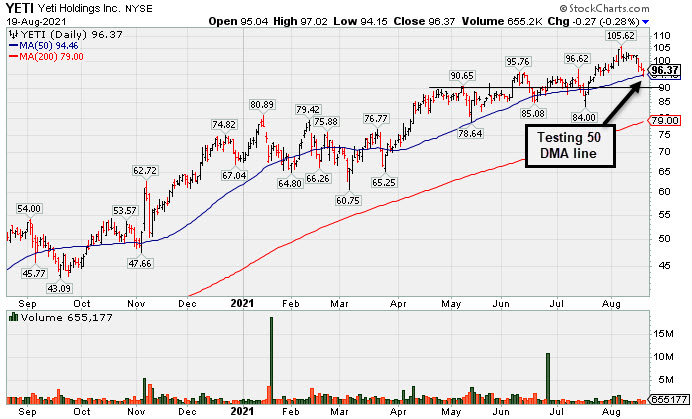
Important Test of 50-Day Moving Average Line - Thursday, August 19, 2021
Yeti Holdings Inc's (YETI -$0.27 or -0.28% to $96.37) has been pulling back toward its 50-day moving average (DMA) line ($94.46) which defines near-term support to watch. There was a noted "negative reversal" after hitting a new all-time high on 8/06/21. Any damaging violation of the 50-day moving average (DMA) would raise concerns and trigger a technical sell signal.
Fundamentals remain strong. YETI reported Jun '21 quarterly earnings +66% on +45% sales revenues versus the year ago period, its 8th consecutive quarterly earnings increase above the +25% minimum earnings guideline (C criteria) of the fact-based investment system. Its Earnings Per Share Rating is 88. Its annual earnings (A criteria) history has been strong.
The Leisure-Products group currently has a C (36) Group Relative Strength rating (L criteria) and that rating has moved down again since last noted in this FSU section with an annotated graph on 7/09/21 under the headline, "Volume Totals Cooling While Consolidating Near High"..
YETI was highlighted in yellow in the 4/06/21 mid-day report (read here) with a new pivot point cited based on its 2/10/21 high while working on a "double bottom" base.
There is a small supply of only 87.2 million shares outstanding (S criteria). The number of top-rated funds owning its shares rose from 310 in Dec '19 to 659 in Jun '21, a reassuring sign concerning the I criteria. Its current Up/Down Volume Ratio of 1.5 is an unbiased indication its shares have been under accumulation over the past 50 days. It completed Secondary Offerings on 5/12/20, 2/20/20, 11/08/19 and 5/08/19 after its $18 IPO on 10/25/18.
Chart courtesy of www.stockcharts.com
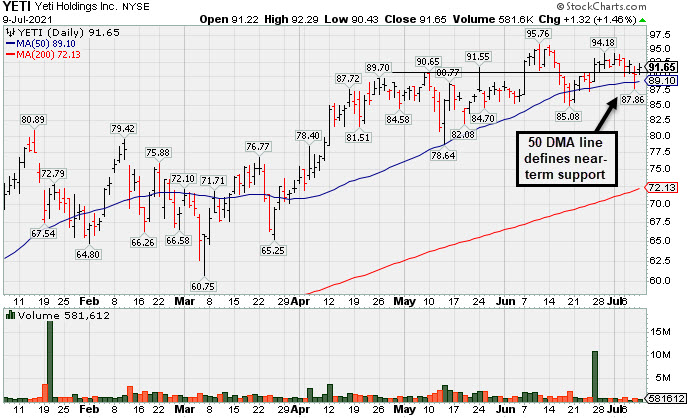
Volume Totals Cooling While Consolidating Near High - Friday, July 9, 2021
Yeti Holdings Inc's (YETI +$1.32 or +1.46% to $91.65) volume totals still have been cooling while consolidating near its 52-week high. That may be a taken as a sign that few investors have been headed to the exit. The 50-day moving average (DMA) line ($89.10) and prior low ($85.08 on 6/18/21) define near-term support to watch on pullbacks. Losses below those levels would raise concerns and trigger technical sell signals.
Fundamentals remain strong. YETI reported Mar 21 quarterly earnings +245% on +42% sales revenues versus the year ago period, its 7th consecutive quarterly earnings increase above the +25% minimum earnings guideline (C criteria) of the fact-based investment system. Its Earnings Per Share Rating is 85. Its annual earnings (A criteria) history has been strong. The Leisure-Products group currently has a B- (58) Group Relative Strength rating (L criteria) but it has been moving down.
YETI was highlighted in yellow in the 4/06/21 mid-day report (read here) with a new pivot point cited based on its 2/10/21 high while working on a "double bottom" base. After last shown in this FSU section with an annotated graph on 6/04/21 under the headline, "Hovering Near High After Finding Support at 50-Day Moving Average".
There is a small supply of only 87.2 million shares outstanding (S criteria). The number of top-rated funds owning its shares rose from 310 in Dec '19 to 640 in Jun '21, a reassuring sign concerning the I criteria. Its current Up/Down Volume Ratio of 1.5 is an unbiased indication its shares have been under accumulation over the past 50 days. It completed Secondary Offerings on 5/12/20, 2/20/20, 11/08/19 and 5/08/19 after its $18 IPO on 10/25/18.
Chart courtesy of www.stockcharts.com
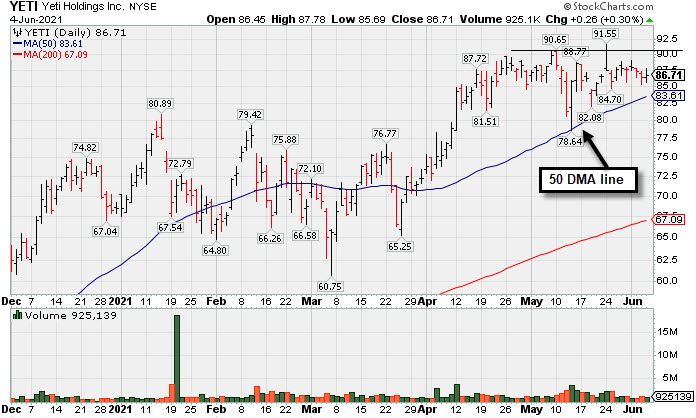
Hovering Near High After Finding Support at 50-Day Moving Average - Friday, June 4, 2021
Yeti Holdings Inc (YETI +$0.26 or +0.30% to $86.71) has been hovering in a tight range near its all-time high. Near-term support to watch is at its 50-day moving average (DMA) line ($83.61) and prior highs in the $80 area. Losses below those levels would raise concerns and trigger technical sell signals.
YETI reported Mar 21 quarterly earnings +245% on +42% sales revenues versus the year ago period, its 7th consecutive quarterly earnings increase above the +25% minimum earnings guideline (C criteria) of the fact-based investment system. Its Earnings Per Share Rating is 86. Its annual earnings (A criteria) history has been strong. The Leisure-Products group currently has a A- (81) Group Relative Strength rating (L criteria) and has been moving up.
YETI reported Mar 21 quarterly earnings +245% on +42% sales revenues versus the year ago period, its 7th consecutive quarterly earnings increase above the +25% minimum earnings guideline (C criteria) of the fact-based investment system. Its Earnings Per Share Rating is 86. Its annual earnings (A criteria) history has been strong. The Leisure-Products group currently has a A- (81) Group Relative Strength rating (L criteria) and has been moving up.
YETI was highlighted in yellow in the 4/06/21 mid-day report (read here) with a new pivot point cited based on its 2/10/21 high while working on a "double bottom" base. After last shown in this FSU section with an annotated graph on 5/03/21 under the headline, "Hovering Near Record High Following Volume-Driven Gains", it was noted that a valid secondary buy point exists from its 10 WMA line up to 5% above the latest high.
There is a small supply of only 87.2 million shares outstanding (S criteria). The number of top-rated funds owning its shares rose from 310 in Dec '19 to 629 in Mar '21, a reassuring sign concerning the I criteria. Its current Up/Down Volume Ratio of 1.7 is an unbiased indication its shares have been under accumulation over the past 50 days. It completed Secondary Offerings on 5/12/20, 2/20/20, 11/08/19 and 5/08/19 after its $18 IPO on 10/25/18.
Chart courtesy of www.stockcharts.com
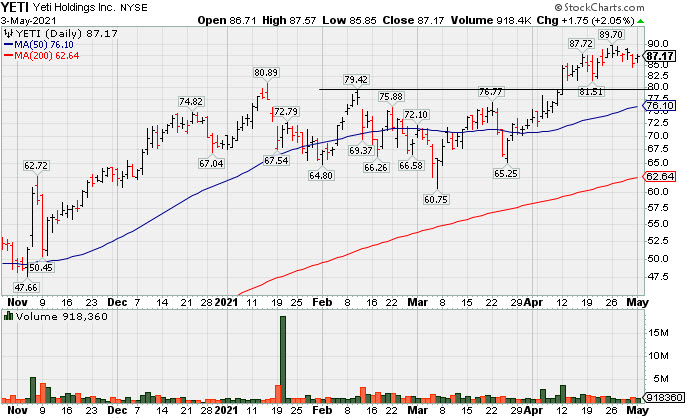
Hovering Near Record High Following Volume-Driven Gains - Monday, May 3, 2021
Yeti Holdings Inc (YETI +$1.75 or +2.05% to $87.17) has been quietly hovering near its all-time high, extended from the latest base. Prior highs in the $80 area define initial support to watch above its 50-day moving average (DMA) line ($76.10).
YETI was highlighted in yellow in the 4/06/21 mid-day report (read here) with a new pivot point cited based on its 2/10/21 high while working on a "double bottom" base. It rallied decisively higher since last shown in this FSU section with an annotated graph on 4/07/21 under the headline, "YETI Perched Within Striking Distance of High".
Its Earnings Per Share Rating is 79. It reported Dec '20 quarterly earnings +72% on +26% sales revenues versus the year ago period, its 6th consecutive quarterly earnings increase above the +25% minimum earnings guideline (C criteria) of the fact-based investment system. Its limited annual earnings (A criteria) history was previously noted as a concern. The Leisure-Products group currently has a B (70) Group Relative Strength rating (L criteria) and has been moving up.
There is a small supply of only 87.2 million shares outstanding (S criteria). The number of top-rated funds owning its shares rose from 310 in Dec '19 to 608 in Mar '21, a reassuring sign concerning the I criteria. Its current Up/Down Volume Ratio of 1.7 is an unbiased indication its shares have been under accumulation over the past 50 days. It completed Secondary Offerings on 5/12/20, 2/20/20, 11/08/19 and 5/08/19 after its $18 IPO on 10/25/18.
Chart courtesy of www.stockcharts.com
YETI Perched Within Striking Distance of High - Wednesday, April 7, 2021
Yeti Holdings Inc (YETI +$0.22 or +0.29% to $75.28) is consolidating above its 50-day moving average (DMA) line ($71.02). It was highlighted in yellow in the 4/06/21 mid-day report (read here) with a new pivot point cited based on its 2/10/21 high while working on a "double bottom" base. Subsequent gains above the pivot point backed by at least +40% above average volume may trigger a new (or add-on) technical buy signal.
YETI sputtered after last shown with an annotated graph on 2/18/21 under the headline, "Rebounded Just Above 50-Day Moving Average Line". It stayed well above its 200 DMA line after dropped from the Featured Stocks list on 3/04/21.
Its Earnings Per Share Rating is 81. Recently it reported Dec '20 quarterly earnings +72% on +26% sales revenues versus the year ago period, its 6th consecutive quarterly earnings increase above the +25% minimum earnings guideline (C criteria) of the fact-based investment system. Its limited annual earnings (A criteria) history was previously noted as a concern. Also, it hails from the Leisure-Products group which currently has a C (47) Group Relative Strength rating (L criteria).
There is a small supply of only 87.2 million shares outstanding (S criteria). The number of top-rated funds owning its shares rose from 310 in Dec '19 to 566 in Dec '20, a reassuring sign concerning the I criteria. Its current Up/Down Volume Ratio of 1.3 is an unbiased indication its shares have been under accumulation over the past 50 days. It completed Secondary Offerings on 5/12/20, 2/20/20, 11/08/19 and 5/08/19 after its $18 IPO on 10/25/18.
Chart courtesy of www.stockcharts.com

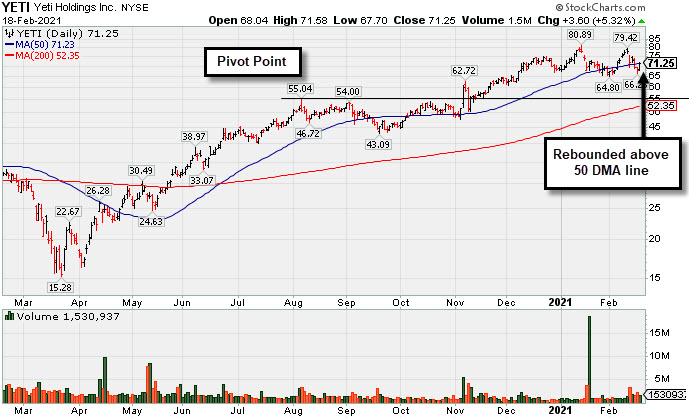
Rebounded Just Above 50-Day Moving Average Line - Thursday, February 18, 2021
Yeti Holdings Inc (YETI +$3.60 or +5.32% to $71.25) rebounded to close back above the 50-day moving average (DMA) line ($71.23), finding prompt support after damaging volume-driven losses. It has not formed a sound base of sufficient length. The prior low ($64.80) on 2/01/21) defines important near term support where a violation may trigger a more worrisome technical sell signal.
Recently it reported Dec '20 quarterly earnings +72% on +26% sales revenues versus the year ago period, its 6th consecutive quarterly earnings increase above the +25% minimum earnings guideline (C criteria) of the fact-based investment system. Its limited annual earnings (A criteria) history was previously noted as a concern. Also, it hails from the Leisure-Products group which currently has a C+ (49) Group Relative Strength rating (L criteria).
Recently it reported Dec '20 quarterly earnings +72% on +26% sales revenues versus the year ago period, its 6th consecutive quarterly earnings increase above the +25% minimum earnings guideline (C criteria) of the fact-based investment system. Its limited annual earnings (A criteria) history was previously noted as a concern. Also, it hails from the Leisure-Products group which currently has a C+ (49) Group Relative Strength rating (L criteria).
YETI was highlighted in yellow in the 11/05/20 mid-day report with pivot point cited based on its 8/06/20 high plus 10 cents (read here). It was last shown with an annotated graph on 1/22/21 under the headline, "50-Day Moving Average and Prior Lows Define Near-Term Support".
There is a small supply of only 87.1 million shares outstanding (S criteria). The number of top-rated funds owning its shares rose from 310 in Dec '19 to 555 in Dec '20, a reassuring sign concerning the I criteria. Its current Up/Down Volume Ratio of 1.9 is an unbiased indication its shares have been under accumulation over the past 50 days. It completed Secondary Offerings on 5/12/20, 2/20/20, 11/08/19 and 5/08/19 after its $18 IPO on 10/25/18.
Chart courtesy of www.stockcharts.com
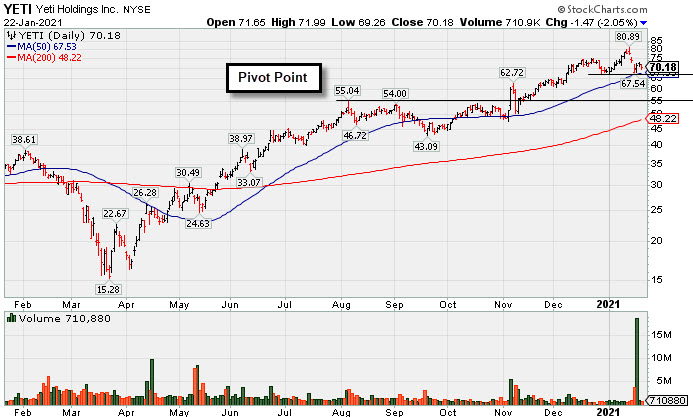
50-Day Moving Average and Prior Lows Define Near-Term Support - Friday, January 22, 2021
Yeti Holdings Inc (YETI -$1.44 or -2.01% to $70.21) is consolidating above its 50-day moving average (DMA) line ($67.53) which defines important support to watch along with prior lows in the $67 area. More damaging losses would raise concerns and trigger technical sell signals.
YETI was highlighted in yellow in the 11/05/20 mid-day report with pivot point cited based on its 8/06/20 high plus 10 cents (read here). It was last shown with an annotated graph on 12/29/20 under the headline, "Volume Totals Cooling While Stubbornly Holding Ground at High".
Earnings rose +126% on +29% sales revenues for the Sep '20 quarter versus the year ago period, its 5th consecutive quarterly earnings increase above the +25% minimum earnings guideline (C criteria) of the fact-based investment system. Its limited annual earnings (A criteria) history was previously noted as a concern.
It hails from the Leisure-Products group which currently has a B- (57) Group Relative Strength rating (L criteria). There is a small supply of only 87.1 million shares outstanding (S criteria). The number of top-rated funds owning its shares rose from 310 in Dec '19 to 542 in Dec '20, a reassuring sign concerning the I criteria. Completed Secondary Offerings on 5/12/20, 2/20/20, 11/08/19 and 5/08/19 after its $18 IPO on 10/25/18.
It hails from the Leisure-Products group which currently has a B- (57) Group Relative Strength rating (L criteria). There is a small supply of only 87.1 million shares outstanding (S criteria). The number of top-rated funds owning its shares rose from 310 in Dec '19 to 542 in Dec '20, a reassuring sign concerning the I criteria. Completed Secondary Offerings on 5/12/20, 2/20/20, 11/08/19 and 5/08/19 after its $18 IPO on 10/25/18.
Chart courtesy of www.stockcharts.com
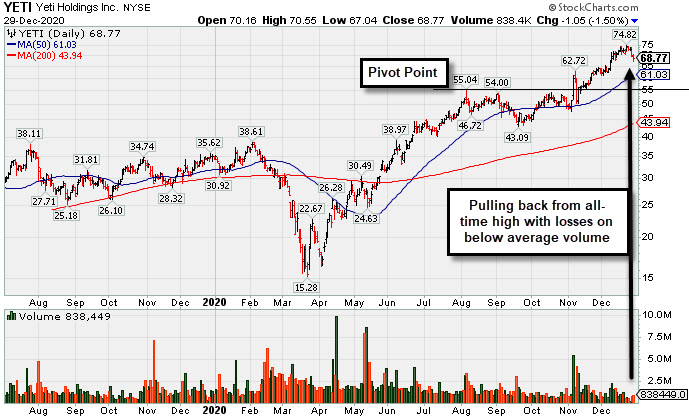
Pulling Back After Recently Wedging to New Highs - Tuesday, December 29, 2020
Yeti Holdings Inc (YETI -$1.05 or -1.50% to $68.77) slumped for a 2nd consecutive loss today with below average volume. It recently wedged to new all-time highs with gains lacking great volume conviction. Its 50-day moving average (DMA) line ($61.03) defines initial support to watch above prior highs in the $55-54 area.
YETI was highlighted in yellow in the 11/05/20 mid-day report with pivot point cited based on its 8/06/20 high plus 10 cents (read here). It was last shown with an annotated graph on 12/02/20 under the headline, "Volume Totals Cooling While Stubbornly Holding Ground at High". It powered to a new all-time high (N criteria) with a big volume-driven gain clearing an orderly base and triggering a technical buy signal. Volume was +390% above average behind he gain, indicative of heavy institutional buying demand, but it quickly got extended from the prior high. Disciplined investors avoid chasing stocks more than +5% above their p3ivot point.
Bullish action came after it reported earnings +126% on +29% sales revenues for the Sep '20 quarter versus the year ago period, its 5th consecutive quarterly earnings increase above the +25% minimum earnings guideline (C criteria) of the fact-based investment system. Its limited annual earnings (A criteria) history was previously noted as a concern.
It hails from the Leisure-Products group which currently has a C+ (49) Group Relative Strength rating (L criteria). There is a small supply of only 87.1 million shares outstanding (S criteria). The number of top-rated funds owning its shares rose from 310 in Dec '19 to 512 in Sep '20, a reassuring sign concerning the I criteria. Completed Secondary Offerings on 5/12/20, 2/20/20, 11/08/19 and 5/08/19 after its $18 IPO on 10/25/18.
Chart courtesy of www.stockcharts.com
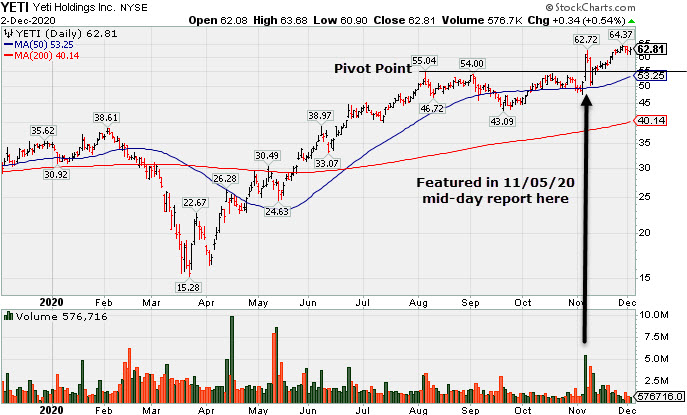
Volume Totals Cooloing While Stubbornly Holding Ground at High - Wednesday, December 2, 2020
Yeti Holdings Inc (YETI +$0.34 or +0.54% to $62.81) is stubbornly holding its ground near its all-time high with volume totals cooling. Prior highs in the $54-55 area define initial support to watch above Its 50-day moving average (DMA) line ($53.25).
YETI was highlighted in yellow in the 11/05/20 mid-day report with pivot point cited based on its 8/06/20 high plus 10 cents (read here) and it was shown with an annotated graph that evening under the headline, "Finished Strong After Breakout Gain Was Noted in Mid-Day Report". It powered to a new all-time high (N criteria) with a big volume-driven gain clearing an orderly base and triggering a technical buy signal. Volume was +390% above average behind he gain, indicative of heavy institutional buying demand, but it quickly got extended from the prior high. Disciplined investors avoid chasing stocks more than +5% above their pivot point.
Bullish action came after it reported earnings +126% on +29% sales revenues for the Sep '20 quarter versus the year ago period, its 5th consecutive quarterly earnings increase above the +25% minimum earnings guideline (C criteria) of the fact-based investment system. Its limited annual earnings (A criteria) history was previously noted as a concern.
It hails from the Leisure-Products group which currently has a B+ (74) Group Relative Strength rating (L criteria). There is a small supply of only 87.1 million shares outstanding (S criteria). The number of top-rated funds owning its shares rose from 310 in Dec '19 to 490 in Sep '20, a reassuring sign concerning the I criteria. Completed Secondary Offerings on 5/12/20, 2/20/20, 11/08/19 and 5/08/19 after its $18 IPO on 10/25/18.
Chart courtesy of www.stockcharts.com
Finished Strong After Breakout Gain Was Noted in Mid-Day Report -
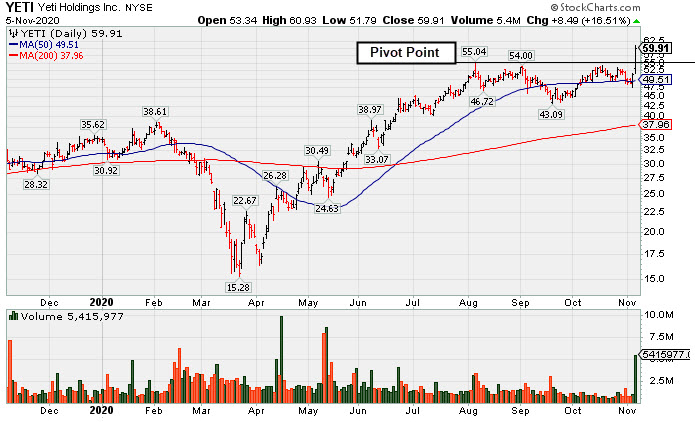
Yeti Holdings Inc (YETI +$8.49 or +16.51% to $59.91) finished strong after highlighted in yellow with pivot point cited based on its 8/06/20 high plus 10 cents in the earlier mid-day report (read here). It powered to a new all-time high (N criteria) with today's big volume-driven gain clearing an orderly base and triggering a technical buy signal. Volume was +390% above average behind he gain, indicative of heavy institutional buying demand, but it quickly got extended from the prior high. Disciplined investors avoid chasing stocks more than +5% above their pivot point.
Bullish action came after it reported earnings +126% on +29% sales revenues for the Sep '20 quarter versus the year ago period, its 5th consecutive quarterly earnings increase above the +25% minimum earnings guideline (C criteria) of the fact-based investment system. Its limited annual earnings (A criteria) history was previously noted as a concern.
It hails from the Leisure-Products group which currently has an A (90) Group Relative Strength rating (L criteria). There is a small supply of only 87 million shares outstanding (S criteria). The number of top-rated funds owning its shares rose from 310 in Dec '19 to 480 in Sep '20, a reassuring sign concerning the I criteria. Completed Secondary Offerings on 5/12/20, 2/20/20, 11/08/19 and 5/08/19 after its $18 IPO on 10/25/18.
Chart courtesy of www.stockcharts.com