There is 1 more featured stock write-up on since to 1/4/2025
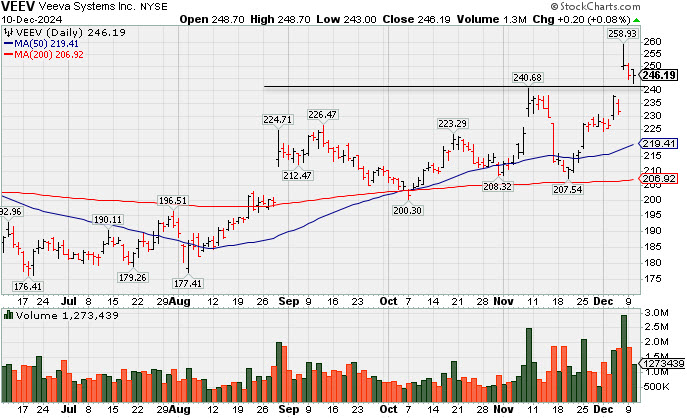
Veeva Systems Consolidating After "Breakaway Gap" - Tuesday, December 10, 2024
Veeva Systems Inc Cl A (VEEV +$0.20 or +0.08% to $246.19) was highlighted in yellow with new pivot point cited based on its 9/02/20 high plus 10 cents in the 12/09/24 mid-day report (read here). It is consolidating following a "breakaway gap" up on 12/06/24 for a new 52-week high as it triggered a technical buy signal.
Veeva reported Oct '24 quarterly earnings +31% on +13% sales revenues versus the year-ago period, its 3rd consecutive quarterly comparison above the +25% minimum earnings guideline (C criteria). It has a 98 Earnings Per Share (EPS) rank. Its annual earnings (A criteria) history has been strong. However, it has a 78 Relative Strength (RS) rating, slightly below the 80+ minimum guideline for buy candidates.
There are 161.9 million shares (S criteria) outstanding. The number of top-rated funds owning its shares rose from 1,917 in Dec '23 to 2,024 in Sep '24, a reassuring sign concerning the I criteria. Its current Up/Down Volume Ratio of 1.1 is an unbiased indication its shares have been under slight accumulation over the past 50 days.
Charts used courtesy of www.stockcharts.com
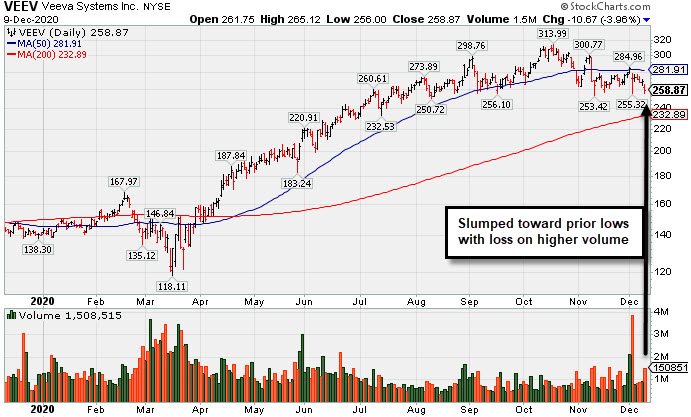
Still Below 50-Day Average After Volume-Driven Losses - Wednesday, December 9, 2020
Veeva Systems Inc Cl A (VEEV -$10.67 or -3.96% to $258.87) is still sputtering below its 50-day moving average (DMA) line ($282). Today's big loss on higher volume led to the lowest close since August, raising greater concerns while nearly testing the prior low ($253.42 on 11/10/20). It will be dropped from the Featured Stocks list tonight. It faces resistance due to overhead supply up to the $314 area. Recent volume-driven losses triggered technical sell signals. A rebound above the 50 DMA line is needed for its outlook to improve.
Fundamentals remain strong after it reported Oct '20 quarterly earnings +30% on +34% sales revenues versus the year ago period. VEEV was highlighted in yellow with new pivot point cited based on its 9/02/20 high plus 10 cents in the 10/06/20 mid-day report (read here). It was last shown in this FSU section on 11/16/20 with an annotated graph under the headline, "Weak Technical Action Raised Recent Concerns" . It had not spent much time base building since it first began wedging into new high territory back in April.
Veeva still has the highest possible 99 Earnings Per Share (EPS) rank and it has an 83 Relative Strength (RS) rating. Both of those ratings must be above 80 for a stock to meet the guidelines for consideration. The past 3 quarterly comparisons were above the +25% minimum earnings guideline (C criteria). Its annual earnings (A criteria) history has been strong.
There are 134.4 million shares (S criteria) in the publicly traded float. The number of top-rated funds owning its shares rose from 814 in Jun '18 to 1,602 in Sep '20, a reassuring sign concerning the I criteria. Its current Up/Down Volume Ratio of 0.9 is an unbiased indication its shares have beenunder slight distributional pressure over the past 50 days.
Charts used courtesy of www.stockcharts.com
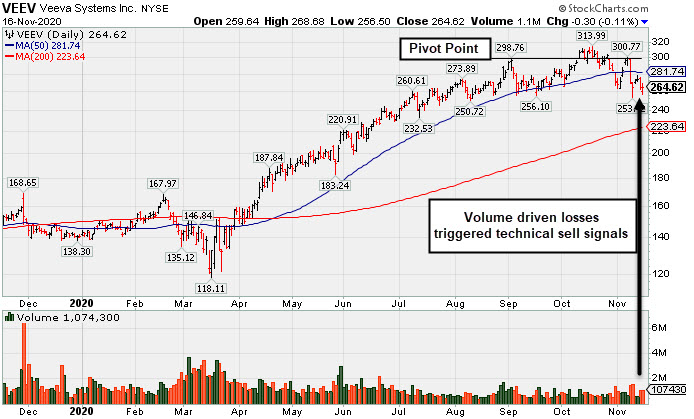
Weak Technical Action Raised Recent Concerns - Monday, November 16, 2020
Veeva Systems Inc Cl A (VEEV -$0.30 or -0.11% to $264.62) slumped again today with above average volume indicative of more damaging distributional pressure. Recent volume-driven losses violated its 50-day moving average (DMA) line ($281.74) and undercut the prior low ($263) triggered technical sell signals. Only a prompt rebound above the 50 DMA line would help its outlook improve.
Fundamentals remain strong. VEEV was highlighted in yellow with new pivot point cited based on its 9/02/20 high plus 10 cents in the 10/06/20 mid-day report (read here). It was shown in this FSU section on 10/26/20 with an annotated graph under the headline, "Recently Slumped Back Below Prior Highs" . It had not spent much time base building since it first began wedging into new high territory back in April.
Veeva still has the highest possible 99 Earnings Per Share (EPS) rank and it has an 88 Relative Strength (RS) rating. Both of those ratings must be above 80 for a stock to meet the guidelines for consideration. It reported earnings +31% on +33% sales revenues for the Jul '20 quarter versus the year ago period. Three of the past 4 quarterly comparisons were above the +25% minimum earnings guideline (C criteria). Its annual earnings (A criteria) history has been strong.
There are 134.4 million shares (S criteria) in the publicly traded float. The number of top-rated funds owning its shares rose from 814 in Jun '18 to 1,572 in Sep '20, a reassuring sign concerning the I criteria. Its current Up/Down Volume Ratio of 1.0 is an unbiased indication its shares have been neutral concerning accumulation/distribution over the past 50 days.
Charts used courtesy of www.stockcharts.com
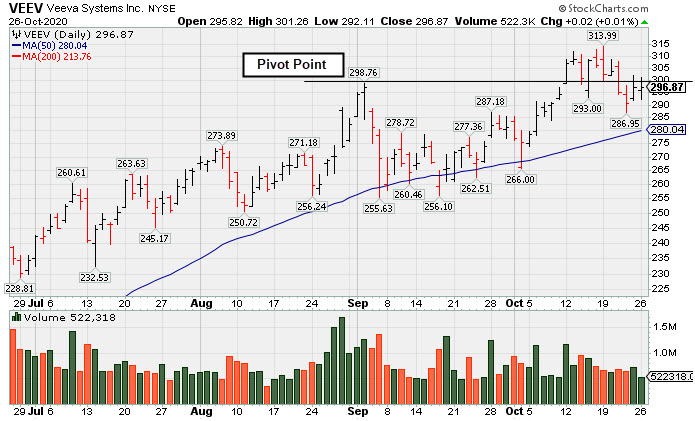
Recently Slumped Back Below Prior Highs - Monday, October 26, 2020
Veeva Systems Inc Cl A (VEEV +$0.02 or +0.01% to $296.87) recently slumped back below its pivot point with losses on lighter than average volume raising some concerns. The 50-day moving average (DMA) line ($280) defines important near-term support where a violation would trigger a technical sell signal. Fundamentals remain strong.
VEEV was highlighted in yellow with new pivot point cited based on its 9/02/20 high plus 10 cents in the 10/06/20 mid-day report (read here). It was shown in this FSU section that evening with an annotated graph under the headline, "First Sound Base Being Built After Considerable Rally" . It had not spent much time base building since it first began wedging into new high territory back in April.
Veeva has the highest possible 99 Earnings Per Share (EPS) rank and it has a 94 Relative Strength (RS) rating. Both of those ratings must be above 80 for a stock to meet the guidelines for consideration. It reported earnings +31% on +33% sales revenues for the Jul '20 quarter versus the year ago period. Three of the past 4 quarterly comparisons were above the +25% minimum earnings guideline (C criteria). Its annual earnings (A criteria) history has been strong.
There are 134.4 million shares (S criteria) in the publicly traded float. The number of top-rated funds owning its shares rose from 814 in Jun '18 to 1,534 in Sep '20, a reassuring sign concerning the I criteria. Its current Up/Down Volume Ratio of 1.6 is an unbiased indication its shares have been under accumulation over the past 50 days.
Charts used courtesy of www.stockcharts.com
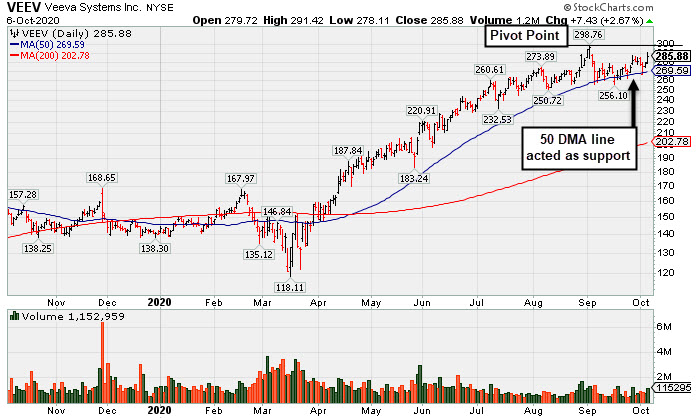
First Sound Base Being Built After Considerable Rally - Tuesday, October 6, 2020
Veeva Systems Inc Cl A (VEEV+$7.43 or +2.67% to $285.88) was highlighted in yellow with new pivot point cited based on its 9/02/20 high plus 10 cents in the earlier mid-day report (read here) . Found support at its its 50-day moving average (DMA) line ($269.66) while forming a 5-week flat base. Subsequent gains above the pivot point backed by at least +40% above average volume may trigger a technical buy signal. Any losses below the 50 DMA line and recent lows would raise concerns and trigger technical sell signals.
VEEV went through long and choppy consolidation after last shown in this FSU section on 8/23/19 with an annotated graph under the headline, "Met Resistance After Slumping Below 50-Day Moving Average" . It has not spent much time base building since it first began wedging into new high territory back in April.
Veeva has the highest possible 99 Earnings Per Share (EPS) rank and it has a 93 Relative Strength (RS) rating. Both of those ratings must be above 80 for a stock to meet the guidelines for consideration. It reported earnings +31% on +33% sales revenues for the Jul '20 quarter versus the year ago period. Three of the past 4 quarterly comparisons were above the +25% minimum earnings guideline (C criteria). Its annual earnings (A criteria) history has been strong.
There are 134.4 million shares (S criteria) in the publicly traded float. The number of top-rated funds owning its shares rose from 814 in Jun '18 to 1,525 in Jun '20, a reassuring sign concerning the I criteria. Its current Up/Down Volume Ratio of 1.6 is an unbiased indication its shares have been under accumulation over the past 50 days.
Charts used courtesy of www.stockcharts.com
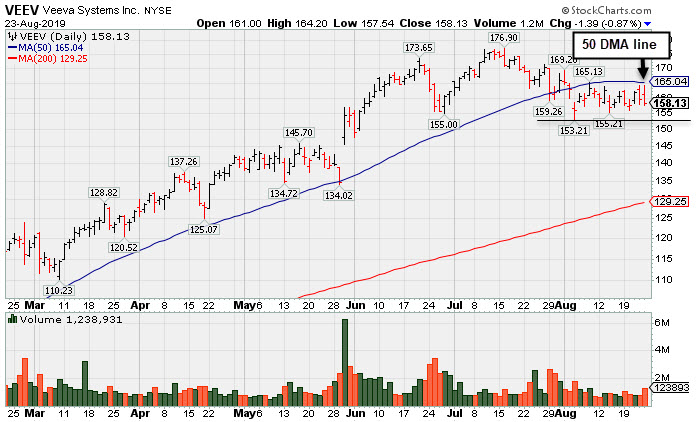
Met Resistance After Slumping Below 50-Day Moving Average - Friday, August 23, 2019
Veeva Systems Inc Cl A (VEEV -$1.39 or -0.87% to $158.13) churned heavier volume while remaining below its 50-day moving average (DMA) line ($165). Near-term support is defined by the prior low ($153.21 on 8/05/19).
Keep in mind that it is due to report earnings news on 8/27/19. Volume and volatility often increase near earnings news. Bullish action came after it reported earnings +52% on +25% sales revenues for the Apr '19 quarter, marking its 5th strong quarter with earnings above the +25% minimum guideline (C criteria).
It was highlighted in yellow with pivot point cited based on its 5/16/19 high plus 10 cents in the 5/30/19 mid-day report (read here) and last shown in this FSU section on 8/01/19 with an annotated graph under the headline, "Recently Found Support Near 50-Day Moving Average" .
Its annual earnings (A criteria) history has been strong. It has the highest possible 99 Earnings Per Share (EPS) rank and it has a 97 Relative Strength (RS) rating. Both of those ratings must be above 80 for a stock to meet the guidelines for consideration.
The number of top-rated funds owning its shares rose from 814 in Jun '18 to 1,251 in Jun '19, a reassuring sign concerning the I criteria. Its current Up/Down Volume Ratio of 0.9 is an unbiased indication its shares have been under accumulation over the past 50 days.
Charts used courtesy of www.stockcharts.com
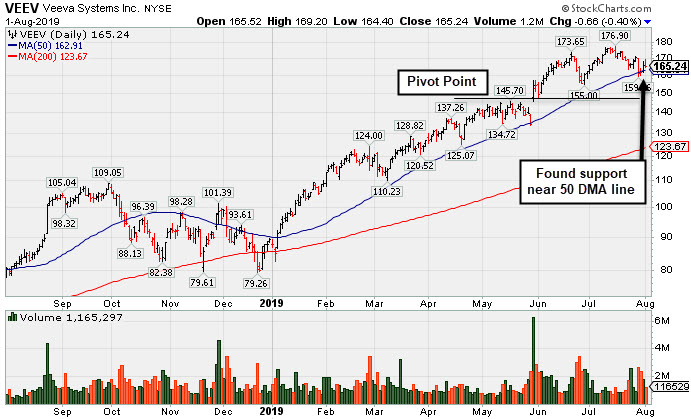
Recently Found Support Near 50-Day Moving Average - Thursday, August 1, 2019
Veeva Systems Inc Cl A (VEEV $165.24 -$0.66 -0.40%) is quietly consolidating after testing its 50-day moving average (DMA) line ($162.91) with volume-driven losses. That important short-term average defines near-term support above the prior low ($155 on 6/27/19). Fundamentals remain strong.
It was highlighted in yellow with pivot point cited based on its 5/16/19 high plus 10 cents in the 5/30/19 mid-day report (read here) and last shown in this FSU section on 6/27/19 with an annotated graph under the headline, "Halted Slide After 4 Volume-Driven Losses From High" .
Bullish action came after it reported earnings +52% on +25% sales revenues for the Apr '19 quarter, marking its 5th strong quarter with earnings above the +25% minimum guideline (C criteria). Its annual earnings (A criteria) history has been strong. It has the highest possible 99 Earnings Per Share (EPS) rank and it has a 97 Relative Strength (RS) rating. Both of those ratings must be above 80 for a stock to meet the guidelines for consideration.
The number of top-rated funds owning its shares rose from 814 in Jun '18 to 1,111 in Jun '19, a reassuring sign concerning the I criteria. Its current Up/Down Volume Ratio of 1.4 is an unbiased indication its shares have been under accumulation over the past 50 days.
Charts used courtesy of www.stockcharts.com
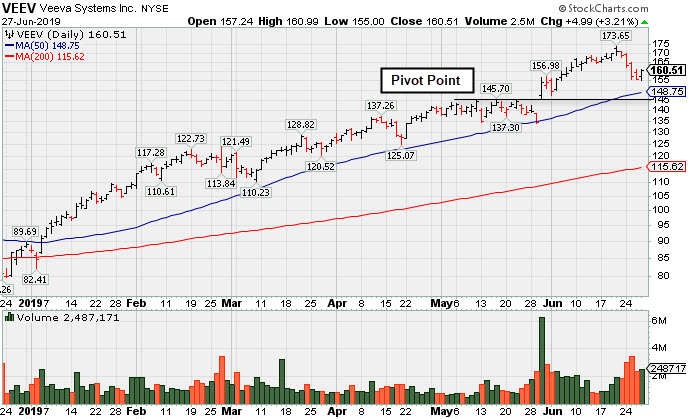
Halted Slide After 4 Volume-Driven Losses From High - Thursday, June 27, 2019
Veeva Systems Inc Cl A (VEEV +$4.99 or +3.21% to $160.51) halted its slide today after abruptly retreating from its all-time high with 4 consecutive volume-driven losses. It remains very extended from any sound base. Its 50-day moving average (DMA) line ($148.75) defines near-term support.
It was highlighted in yellow with pivot point cited based on its 5/16/19 high plus 10 cents in the 5/30/19 mid-day report (read here) and last shown in this FSU section that evening with an annotated graph under the headline, "Big Volume-Driven Gain for New High Following Earnings News". It gapped up hitting a new all-time high, rallying from the previously noted advanced "3 weeks tight" base. Members were reminded, "Volume and volatility often increase near earnings news."
Bullish action came after it reported earnings +52% on +25% sales revenues for the Apr '19 quarter, marking its 5th strong quarter with earnings above the +25% minimum guideline (C criteria). Its annual earnings (A criteria) history has been strong. It has the highest possible 99 Earnings Per Share (EPS) rank and it has a 98 Relative Strength (RS) rating. Both of those ratings must be above 80 for a stock to meet the guidelines for consideration.
The number of top-rated funds owning its shares rose from 814 in Jun '18 to 1,122 in Mar '19, a reassuring sign concerning the I criteria. Its current Up/Down Volume Ratio of 1.4 is an unbiased indication its shares have been under accumulation over the past 50 days.
Charts used courtesy of www.stockcharts.com
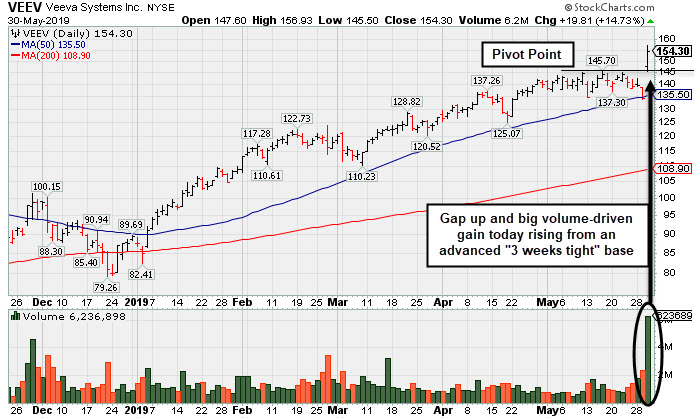
Big Volume-Driven Gain for New High Following Earnings News - Thursday, May 30, 2019
Veeva Systems Inc Cl A (VEEV +$18.94 or +14.08% to $153.43) finished strong today after it was highlighted in yellow with pivot point cited based on its 5/16/19 high plus 10 cents in the earlier mid-day report (read here). It gapped up hitting a new all-time high, rallying from the previously noted advanced "3 weeks tight" base. Members were recently reminded, "Volume and volatility often increase near earnings news."
Bullish action came after it reported earnings +52% on +25% sales revenues for the Apr '19 quarter, marking its 5th strong quarter with earnings above the +25% minimum guideline (C criteria). Disciplined investors will note that no new buying efforts are to be made during market corrections (M criteria) under the fact-based investment system's rules. Watch for a confirmed rally with a follow-through day first.
Its annual earnings (A criteria) history has been strong. It has the highest possible 99 Earnings Per Share (EPS) rank and it has a 96 Relative Strength (RS) rating. Both of those ratings must be above 80 for a stock to meet the guidelines for consideration.
The number of top-rated funds owning its shares rose from 814 in Jun '18 to 1,101 in Mar '19, a reassuring sign concerning the I criteria. Its current Up/Down Volume Ratio of 1.4 is an unbiased indication its shares have been under accumulation over the past 50 days.
Charts used courtesy of www.stockcharts.com
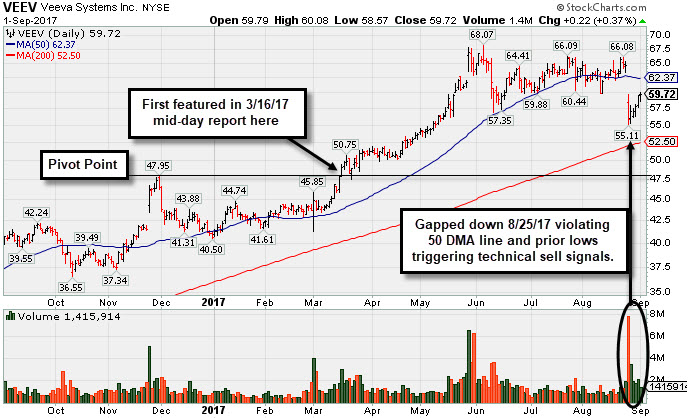
Rebounding After gap Down Violated 50-Day Average and Prior Lows - Friday, September 1, 2017
Veeva Systems Inc Cl A (VEEV +$0.22 or +0.37% to $59.72) posted a 5th consecutive gain today. On 8/25/17 it gapped down violating its 50-day moving average (DMA) line and undercutting prior lows with a damaging volume-driven loss triggering technical sell signals. A rebound above the 50 DMA line ($62.37) is needed for its outlook to improve. Recent weakness came immediately after the company reported Jul '17 earnings +53% on +27% sales revenues, still well above the +25% minimum earnings guideline (C criteria). Members were recently reminded, "Volume and volatility often increase near earnings news."
VEEV traded up as much as +38% since first highlighted in yellow with a pivot point based on its 11/30/16 high plus 10 cents in the 3/16/17 mid-day report (read here). It showed mostly distributional action in the weeks since last shown in this FSU section on 8/02/17 with an annotated graph under the headline, "Slump Below 50-Day Moving Average Line Raises Concerns".
Its annual earnings (A criteria) history has been strong. It has the highest possible 99 Earnings Per Share (EPS) rank and it has a 86 Relative Strength (RS) rating. Both of those ratings must be above 80 for a stock to meet the guidelines for consideration.
The number of top-rated funds owning its shares rose from 340 in Mar '16 to 583 in Jun '17, a reassuring sign concerning the I criteria. Its current Up/Down Volume Ratio of 1.1 is an unbiased indication its shares have been under slight accumulation over the past 50 days.
Charts used courtesy of www.stockcharts.com
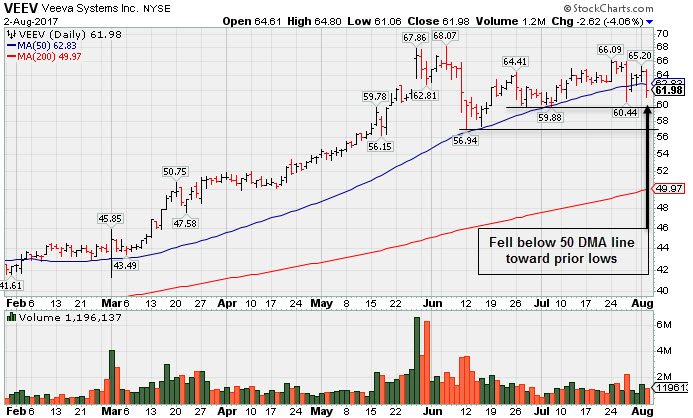
Slump Below 50-Day Moving Average Line Raises Concerns - Wednesday, August 2, 2017
Veeva Systems Inc Cl A (VEEV -$2.62 or -4.06% to $61.98) undercut its 50-day moving average (DMA) line ($62.83) today and its color code was changed to green. More damaging losses would raise greater concerns. Disciplined investors will note that it did not produce the necessary volume-driven gains for a new 52-week high needed to trigger a new (or add-on) technical buy signal.
VEEV was last shown in this FSU section on 6/23/17 with an annotated graph under the headline, "Rebounding Since Testing Support at 50-Day Moving Average Line". It was first highlighted in yellow with a pivot point based on its 11/30/16 high plus 10 cents in the 3/16/17 mid-day report (read here).
The high-ranked Computer Software - Medical firm reported earnings +47% on +32% sales revenues for the April '17 quarter, and the past 3 quarterly comparisons were above the +25% minimum earnings guideline (C criteria). Its annual earnings (A criteria) history has been strong. It has the highest possible 99 Earnings Per Share (EPS) rank and it has a 95 Relative Strength (RS) rating. Both of those ratings must be above 80 for a stock to meet the guidelines for consideration.
The number of top-rated funds owning its shares rose from 340 in Mar '16 to 528 in Jun '17, a reassuring sign concerning the I criteria. Its current Up/Down Volume Ratio of 0.8 is an unbiased indication its shares have been under some distributional pressure over the past 50 days.
Charts used courtesy of www.stockcharts.com
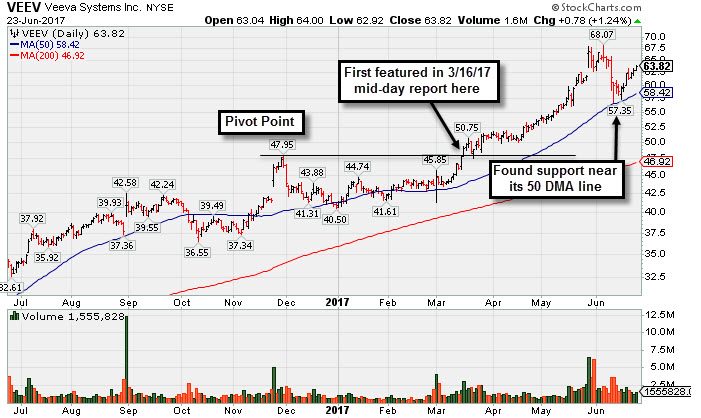
Rebounding Since Testing Support at 50-Day Moving Average Line - Friday, June 23, 2017
Veeva Systems Inc Cl A (VEEV +$0.78 or +1.24% to $63.82) has been rebounding toward its prior high after finding support near Its 50-day moving average (DMA) line ($58.42). That short term average and recent low ($56.94 on 6/12/17) define important near-term support to watch.
VEEV was last shown in this FSU section on 5/15/17 with an annotated graph under the headline, "Wedging Into New High Territory, Extended From Sound Base". It is up +30.2% since first highlighted in yellow with new pivot point cited based on its 11/30/16 high plus 10 cents in the 3/16/17 mid-day report (read here).
The high-ranked Computer Software - Medical firm reported earnings +47% on +32% sales revenues for the April '17 quarter, and the past 3 quarterly comparisons were above the +25% minimum earnings guideline (C criteria). Its annual earnings (A criteria) history has been strong. It has the highest possible 99 Earnings Per Share (EPS) rank and it has a 95 Relative Strength (RS) rating. Both of those ratings must be above 80 for a stock to meet the guidelines for consideration.
The number of top-rated funds owning its shares rose from 340 in Mar '16 to 475 in Mar '17, a reassuring sign concerning the I criteria. Its current Up/Down Volume Ratio of 1.1 is an unbiased indication its shares have been under only slight accumulation over the past 50 days.
Charts used courtesy of www.stockcharts.com
Wedging Into New High Territory, Extended From Sound Base - Monday, May 15, 2017
Veeva Systems Inc Cl A (VEEV +$0.78 or +1.38% to $57.12) hit yet another new all-time high with today's gain backed by light volume, getting very extended from any sound base. Disciplined investors avoid chasing extended stocks and might wait for a new base or secondary buy point to possibly develop and be noted in the weeks ahead. Its 50-day moving average (DMA) line ($51) defines support above prior highs in the $47-48 area.
VEEV has been wedging further into new high territory with gains lacking great volume conviction since last shown in this FSU section on 4/18/17 with an annotated graph under the headline, "Hovering Near High, Stubbornly Holding its Ground". It is up +16.57% since first highlighted in yellow with new pivot point cited based on its 11/30/16 high plus 10 cents in the 3/16/17 mid-day report (read here).
The high-ranked Computer Software - Medical firm reported earnings +47% on +31% sales revenues for the Jan '17 quarter, and 3 of the past 4 quarterly comparisons were above the +25% minimum earnings guideline (C criteria). Its annual earnings (A criteria) history has been strong. It has the highest possible 99 Earnings Per Share (EPS) rank and it has a 96 Relative Strength (RS) rating. Both of those ratings must be above 80 for a stock to meet the guidelines for consideration.
The number of top-rated funds owning its shares rose from 340 in Mar '16 to 482 in Mar '17, a reassuring sign concerning the I criteria. Its current Up/Down Volume Ratio of 2.3 is an unbiased indication its shares have been under accumulation over the past 50 days.
Charts used courtesy of www.stockcharts.com
Hovering Near High, Stubbornly Holding its Ground - Tuesday, April 18, 2017
Veeva Systems Inc Cl A (VEEV -$0.49 or -0.96% to $50.31) has been hovering near its previously cited "max buy" level and perched near its all-time high, stubbornly holding its ground with volume totals cooling. Prior highs in the $47-48 area define support coinciding with its 50-day moving average (DMA) line ($47.17). Deterioration below those levels would trigger technical sell signals. Disciplined investors following the fact-based investment system know to always make buys within 5% of prior highs, and they always sell if any stock falls more than -7% from their purchase price.
VEEV hit a new 52-week high with a gain backed by more than 3 times average volume triggering a technical buy signal when last shown in this FSU section on 3/16/17 with an annotated graph under the headline, "Breakout Gain for New Highs Backed by Three Times Average Volume". It was highlighted in yellow with new pivot point cited based on its 11/30/16 high plus 10 cents in the earlier mid-day report (read here).
The high-ranked Computer Software 0 Medical firm reported earnings +47% on +31% sales revenues for the Jan '17 quarter, and 3 of the past 4 quarterly comparisons were above the +25% minimum earnings guideline (C criteria). Its annual earnings (A criteria) history has been strong. It has the highest possible 99 Earnings Per Share (EPS) rank and it has a 95 Relative Strength (RS) rating. Both of those ratings must be above 80 for a stock to meet the guidelines for consideration.
The number of top-rated funds owning its shares rose from 340 in Mar '16 to 469 in Mar '17, a reassuring sign concerning the I criteria. Its current Up/Down Volume Ratio of 1.7 is an unbiased indication its shares have been under accumulation over the past 50 days.
Charts used courtesy of www.stockcharts.com

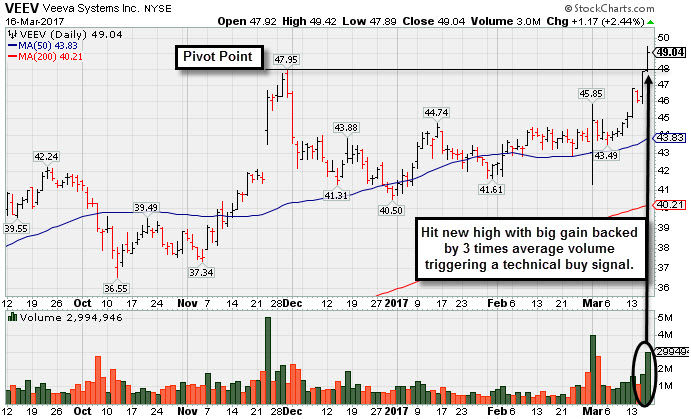
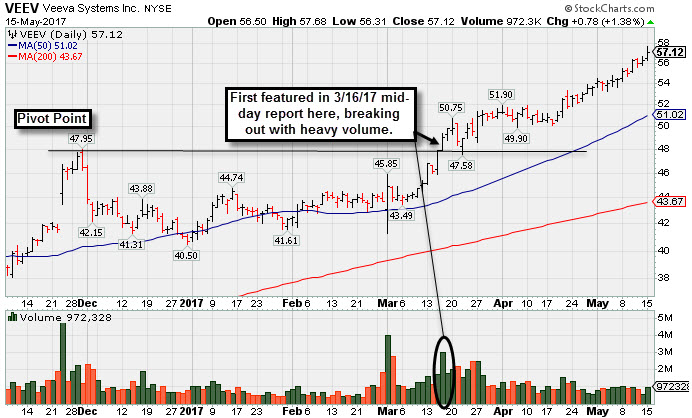
Breakout Gain for New Highs Backed by Three Times Average Volume - Thursday, March 16, 2017
Veeva Systems Inc Cl A (VEEV +$1.13 or +2.36% to $49.00) was highlighted in yellow with new pivot point cited based on its 11/30/16 high plus 10 cents in the earlier mid-day report (read here). It hit a new 52-week high with today's gain backed by more than 3 times average volume triggering a technical buy signal while adding to a recent spurt of gains. Disciplined investors following the fact-based investment system know to always make buys within 5% of prior highs, and they always sell if any stock falls more than -7% from their purchase price.
VEEV reported earnings +47% on +31% sales revenues for the Jan '17 quarter, and 3 of the past 4 quarterly comparisons were above the +25% minimum earnings guideline (C criteria). Its annual earnings (A criteria) history has been strong. It has the highest possible 99 Earnings Per Share (EPS) rank and it has a 92 Relative Strength (RS) rating. Both of those ratings must be above 80 for a stock to meet the guidelines for consideration.
The number of top-rated funds owning its shares rose from 340 in Mar '16 to 450 in Dec '16, a reassuring sign concerning the I criteria. Its current Up/Down Volume Ratio of 1.6 is an unbiased indication its shares have been under accumulation over the past 50 days.