Quietly Slumping Into Prior Base and Below 50-Day Moving Average - Monday, December 20, 2021
The Trade Desk Inc Cl A (TTD -$1.95 or -2.17% to $88.04) slumped today with below average volume. Weakness has been raising concerns, as it first undercut the prior high ($90), and it has recently sputtered below its 50 DMA line ($88.76). Those were noted as technically important support levels to watch. Only a prompt rebound above the 50 DMA line would help its outlook improve.The Comml Svcs-Advertising firm was last shown in this FSU section on 11/09/21 with an annotated graph under the headline, "Powerful Volume-Driven Gains for New Highs". TTD was highlighted in yellow in the 11/09/21 mid-day report (read here) with new pivot point cited based on its 8/10/21 high after a 9-month cup-with-handle shaped base. Do not be confused as a 10:1 split impacted the share price as of 6/17/21. There are now 480.6 million shares outstanding (S criteria).
Its Earnings Per Share Rating is 99, the highest possible rating. Recently it reported Sep '21 quarterly earnings +38% on +39% sales revenues versus the year ago period, and prior quarterly comparisons showed very strong sales revenues and earnings increases well above the +25% minimum earnings guideline (C criteria). Annual earnings history has been strong.
The number of top-rated funds owning its shares rose from 280 in Mar '18 to 1,092 in Sep '21, a reassuring sign concerning the I criteria. Its current Up/Down Volume Ratio of 1.5 is an unbiased indication its shares have been under accumulation over the past 50 days. It has a Timeliness Rating of C and a Sponsorship Rating of A.
Charts courtesy of www.stockcharts.com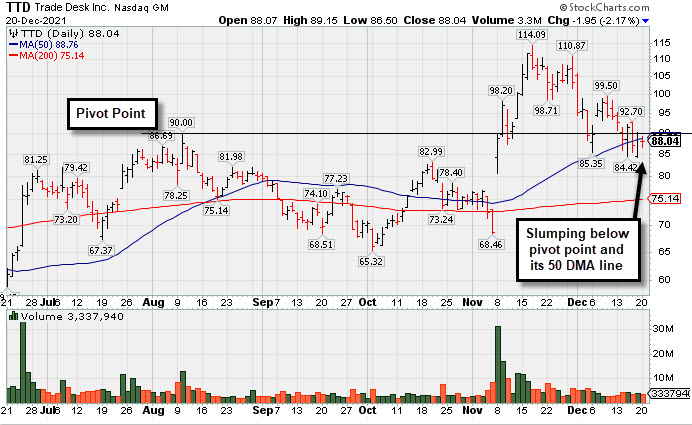
Powerful Volume-Driven Gains for New Highs - Tuesday, November 9, 2021
The Trade Desk Inc Cl A (TTD +$8.34 or +9.40% to $97.09) was highlighted in yellow in the earlier mid-day report (read here) with new pivot point cited based on its 8/10/21 high after a 9-month cup-with-handle shaped base. It hit a new all-time high with today's 2nd consecutive big volume-driven gain. Do not be confused as a 10:1 split impacted the share price as of 6/17/21. There are now 478.7 million shares outstanding (S criteria).Its Earnings Per Share Rating is 99, the highest possible rating. Recently it reported Sep '21 quarterly earnings +38% on +39% sales revenues versus the year ago period, and prior quarterly comparisons showed very strong sales revenues and earnings increases well above the +25% minimum earnings guideline (C criteria). Annual earnings history has been strong.
TTD traded up as much as +50% after highlighted in yellow with new pivot point cited based on its 5/07/20 high in the 6/03/20 mid-day report (read her). The Comml Svcs-Advertising firm was last shown in this FSU section on 8/27/20 with an annotated graph under the headline, "Volume Totals Cooling While Still Hovering Near Record High". It rallied to new highs afterward and then went through a long and choppy consolidation.
The number of top-rated funds owning its shares rose from 280 in Mar '18 to 1,087 in Sep '21, a reassuring sign concerning the I criteria. Its current Up/Down Volume Ratio of 1.2 is an unbiased indication its shares have been under accumulation over the past 50 days. It has a Timeliness Rating of C and a Sponsorship Rating of A.
Charts courtesy of www.stockcharts.com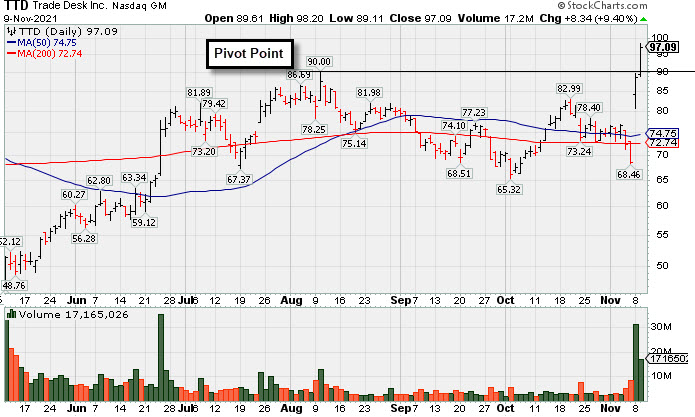
Volume Totals Cooling While Still Hovering Near Record High - Thursday, August 27, 2020
The Trade Desk Inc Cl A (TTD -$6.94 or -1.44% to $474.10) has seen its volume totals cooling in recent weeks while still stubbornly holding its ground perched near its all-time high. Recently it reported Jun '20 quarterly earnings -3% on -13% sales revenues versus the year ago period, below the +25% minimum earnings guideline (C criteria) raising fundamental concerns. It is extended from any sound base of sufficient length. Its 50-day moving average (DMA) line ($445.39) defines near-term support above the prior low ($404 on 7/24/20) where violations may trigger technical sell signals.TTD traded up as much as +50% since highlighted in yellow with new pivot point cited based on its 5/07/20 high in the 6/03/20 mid-day report (read here). The Comml Svcs-Advertising firm was last shown in this FSU section on 8/12/20 with an annotated graph under the headline, "Hovering Near High After Latest Quarterly Report Raised Concerns".
Its annual earnings (A criteria) history has been strong, and it has a 97 Earnings Per Share Rating. The number of top-rated funds owning its shares rose from 280 in Mar '18 to 749 in Jun '20, a reassuring sign concerning the I criteria. Its current Up/Down Volume Ratio of 1.9 is an unbiased indication its shares have been under accumulation over the past 50 days. It has a Timeliness Rating of B and a Sponsorship Rating of B. There are only 46.7 million shares outstanding (S criteria) which can contribute to greater volatility in the event of institutional buying or selling.
Charts courtesy of www.stockcharts.com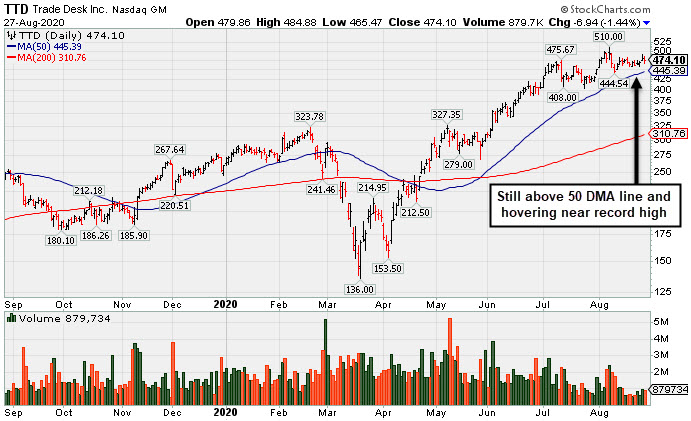
Hovering Near High After Latest Quarterly Report Raised Concerns - Wednesday, August 12, 2020
The Trade Desk Inc Cl A (TTD +$14.38 or +3.23% to $460.03) is still hovering near its all-time high. Recently it reported Jun '20 quarterly earnings -3% on -13% sales revenues versus the year ago period, well below the +25% minimum earnings guideline (C criteria), raising fundamental concerns. It is extended from any sound base of sufficient length. Its 50-day moving average (DMA) line ($421.28) and prior low ($404 on 7/24/20) define near-term support to watch where violations may trigger technical sell signals.TTD traded up as much as +50% since highlighted in yellow with new pivot point cited based on its 5/07/20 high in the 6/03/20 mid-day report (read here). The Comml Svcs-Advertising firm was last shown in this FSU section on 7/20/20 with an annotated graph under the headline, "Rebounded Near All-Time High With Gain Backed by Light Volume".
Its annual earnings (A criteria) history has been strong, and it has a 97 Earnings Per Share Rating. The number of top-rated funds owning its shares rose from 280 in Mar '18 to 721 in Jun '20, a reassuring sign concerning the I criteria. Its current Up/Down Volume Ratio of 2.3 is an unbiased indication its shares have been under accumulation over the past 50 days. It has a Timeliness Rating of B and a Sponsorship Rating of B. There are only 46.7 million shares outstanding (S criteria) which can contribute to greater volatility in the event of institutional buying or selling.
Charts courtesy of www.stockcharts.com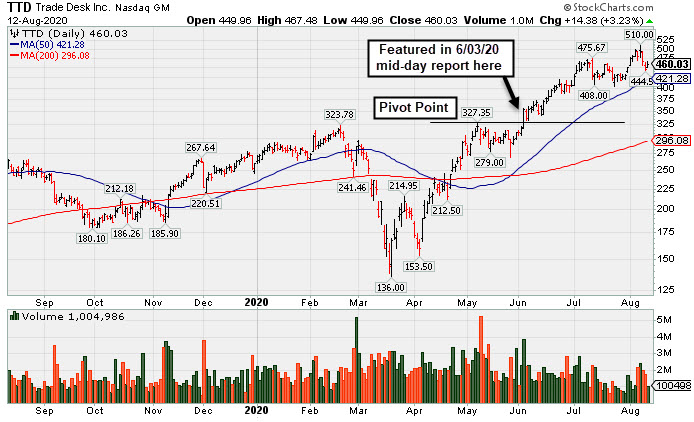
Rebounded Near All-Time High With Gain Backed by Light Volume - Monday, July 20, 2020
The Trade Desk Inc Cl A (TTD $457.65 +$24.62 +5.69% ) posted a big gain today with light volume, rallying toward its all-time high. It is very extended from any sound base. Its 50-day moving average (DMA) line ($370.41) defines near-term support to watch on pullbacks.TTD traded up as much as +39.65% since highlighted in yellow with new pivot point cited based on its 5/07/20 high in the 6/03/20 mid-day report (read here). The Comml Svcs-Advertising firm was last shown in this FSU section on 6/24/20 with an annotated graph under the headline, "Pullback Breaks Streak of 8 Straight Gains Into New High Ground".
Fundamentals remain strong after it reported Mar '20 quarterly earnings +84% on +33% sales revenues, and 6 of the past 7 quarterly comparisons were above the +25% minimum earnings guideline (C criteria). Its annual earnings (A criteria) history has been strong, and it has a highest possible 99 Earnings Per Share Rating.
The number of top-rated funds owning its shares rose from 280 in Mar '18 to 689 in Mar '20, a reassuring sign concerning the I criteria. Its current Up/Down Volume Ratio of 1.8 is an unbiased indication its shares have been under accumulation over the past 50 days. It has a Timeliness Rating of A and a Sponsorship Rating of B. There are only 46.1 million shares outstanding (S criteria) which can contribute to greater volatility in the event of institutional buying or selling.
Charts courtesy of www.stockcharts.com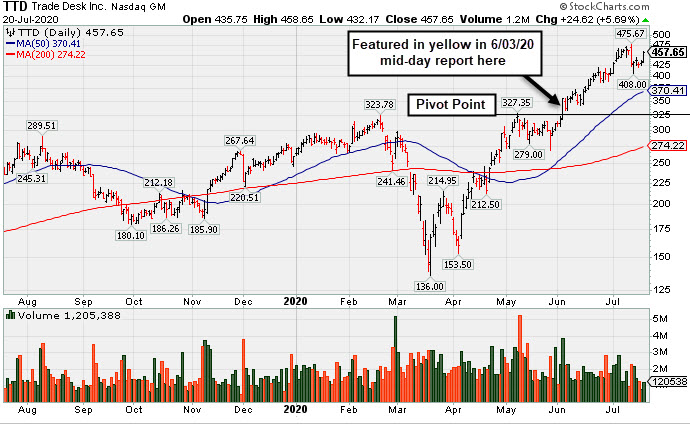
Pullback Breaks Streak of 8 Straight Gains Into New High Ground - Wednesday, June 24, 2020
The Trade Desk Inc Cl A (TTD -$13.66 or -3.33% to $396.37) pulled back from its all time high today with below average volume behind a loss breaking a streak of 8 consecutive gains. It is very extended from any sound base. Prior highs in the $327 area define important near-term support above its 50-day moving average ($312).TTD was highlighted in yellow with new pivot point cited based on its 5/07/20 high in the 6/03/20 mid-day report (read here). It hit a new all-time high with a big gain following a deep pullback and a 3-week handle-like consolidation. The big gain and strong close above the pivot point was backed by +73% above average volume triggering a convincing technical buy signal. The Comml Svcs-Advertising firm was last shown in this FSU section on 6/03/20 with an annotated graph under the headline, "Trade Desk Posts Powerful Gain for New High".
Fundamentals remain strong after it reported Mar '20 quarterly earnings +84% on +33% sales revenues, and 6 of the past 7 quarterly comparisons were above the +25% minimum earnings guideline (C criteria). Its annual earnings (A criteria) history has been strong, and it has a highest possible 99 Earnings Per Share Rating.
Fundamentals remain strong after it reported Mar '20 quarterly earnings +84% on +33% sales revenues, and 6 of the past 7 quarterly comparisons were above the +25% minimum earnings guideline (C criteria). Its annual earnings (A criteria) history has been strong, and it has a highest possible 99 Earnings Per Share Rating.
The number of top-rated funds owning its shares rose from 280 in Mar '18 to 592 in Mar '20, a reassuring sign concerning the I criteria. Its current Up/Down Volume Ratio of 1.9 is an unbiased indication its shares have been under accumulation over the past 50 days. It has a Timeliness Rating of A and a Sponsorship Rating of B. There are only 46.1 million shares outstanding (S criteria) which can contribute to greater volatility in the event of institutional buying or selling.
Charts courtesy of www.stockcharts.com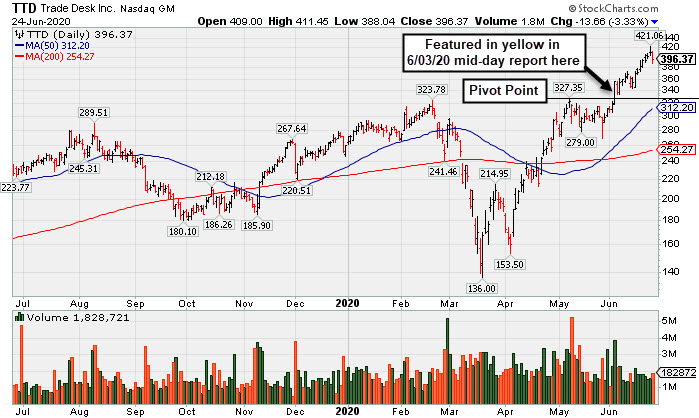
Trade Desk Posts Powerful Gain for New High - Wednesday, June 3, 2020
The Trade Desk Inc Cl A (TTD +$36.72 or +11.54% to $354.980 finished strong after highlighted in yellow with new pivot point cited based on its 5/07/20 high in the earlier mid-day report (read here). It hit a new all-time high with today's big gain following a deep pullback and a 3-week handle-like consolidation. The big gain and strong close above the pivot point was backed by +73% above average volume triggering a convincing technical buy signal.Fundamentals remain strong after it reported Mar '20 quarterly earnings +84% on +33% sales revenues, and 6 of the past 7 quarterly comparisons were above the +25% minimum earnings guideline (C criteria). The Comml Svcs-Advertising firm made a choppy ascent since last shown in this FSU section on 9/09/19 with an annotated graph under the headline, "Distributional Action Weighs on Prior Leader". Its annual earnings (A criteria) history has been strong, and it has a highest possible 99 Earnings Per Share Rating.
The number of top-rated funds owning its shares rose from 280 in Mar '18 to 587 in Mar '20, a reassuring sign concerning the I criteria. Its current Up/Down Volume Ratio of 1.5 is an unbiased indication its shares have been under accumulation over the past 50 days. It has a Timeliness Rating of A and a Sponsorship Rating of B. There are only 46.1 million shares outstanding (S criteria) which can contribute to greater volatility in the event of institutional buying or selling.
Charts courtesy of www.stockcharts.com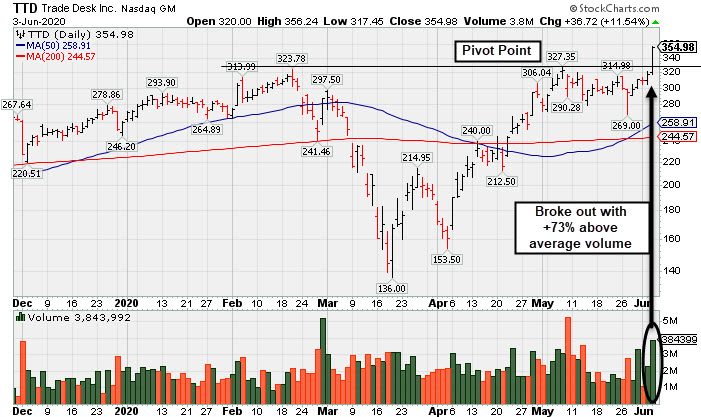
Distributional Action Weighs on Prior Leader - Monday, September 9, 2019
The Trade Desk Inc Cl A (TTD $213.67 -$19.46 -8.35%) slumped further below its 50-day moving average (DMA) line ($248) and below the recent low ($239.01 on 8/21/19) with today's volume-driven loss after damaging losses last week triggered technical sell signals. It will be dropped from the Featured Stocks list tonight. A rebound above the 50 DMA line is needed to help its outlook improve.
Fundamentals remain strong after it recently it reported Jun '19 quarterly earnings +58% on +42% sales revenues. Seven of the past 8 quarterly comparisons were well above the +25% minimum guideline (C criteria). Its annual earnings (A criteria) history has been strong, and it has a highest possible 99 Earnings Per Share Rating.
The high-ranked Comml Svcs-Advertising firm was last shown in this FSU section on 9/06/19 with an annotated graph under the headline, "Negated Breakout and Slumped Below Noted Support". The number of top-rated funds owning its shares rose from 280 in Mar '18 to 559 in Jun '19, a reassuring sign concerning the I criteria. Its current Up/Down Volume Ratio of 1.0 is an unbiased indication its shares have been neutral concerning accumulation/distribution over the past 50 days. It has a Timeliness Rating of B and a Sponsorship Rating of B. There are only 45.0 million shares outstanding (S criteria) which can contribute to greater volatility in the event of institutional buying or selling.
Charts courtesy of www.stockcharts.com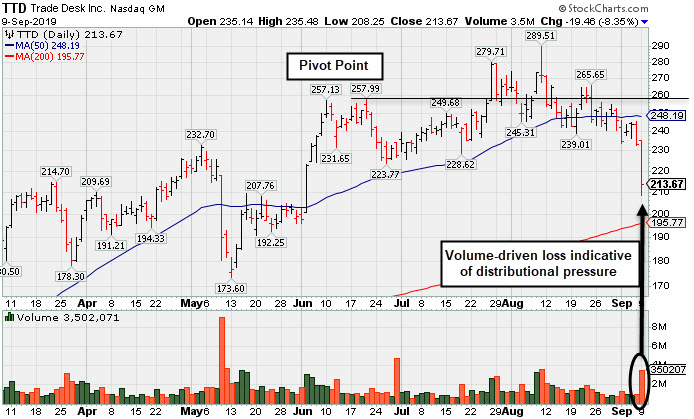
Negated Breakout and Slumped Below Noted Support - Friday, September 6, 2019
The Trade Desk Inc Cl A (TTD $233.13 -$10.58 -4.34%) has recently been sputtering below its 50-day moving average (DMA) line ($248.54) and below the recent low ($239.01 on 8/21/19) raising concerns and triggering technical sell signals. It completely negated the prior breakout above its pivot point as it fell back into the prior base. Only a prompt rebound above the 50 DMA line would help its outlook improve. Prior lows in the $223-228 area now define important near-term support above its 200 DMA line ($195).
Fundamentals remain strong after it recently it reported Jun '19 quarterly earnings +58% on +42% sales revenues. Seven of the past 8 quarterly comparisons were well above the +25% minimum guideline (C criteria). Its annual earnings (A criteria) history has been strong, and it has a highest possible 99 Earnings Per Share Rating.
The high-ranked Comml Svcs-Advertising firm was last shown in this FSU section on 8/16/19 with an annotated graph under the headline, "Consolidating Near 50-Day Moving Average Line". The number of top-rated funds owning its shares rose from 280 in Mar '18 to 560 in Jun '19, a reassuring sign concerning the I criteria. Its current Up/Down Volume Ratio of 1.0 is an unbiased indication its shares have been neutral concerning accumulation/distribution over the past 50 days. It has a Timeliness Rating of B and a Sponsorship Rating of B. There are only 45.0 million shares outstanding (S criteria) which can contribute to greater volatility in the event of institutional buying or selling.
Charts courtesy of www.stockcharts.com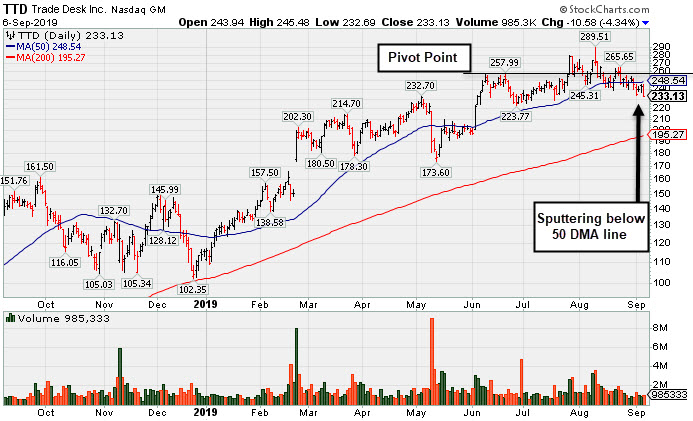
Consolidating Near 50-Day Moving Average Line - Friday, August 16, 2019
The Trade Desk Inc Cl A (TTD +$5.10 or +2.09% to $248.62) is consolidating near its 50-day moving average (DMA) line ($247.54) which defines important support. More damaging losses would raise concerns and trigger a technical sell signal.
Fundamentals remain strong after it recently it reported Jun '19 quarterly earnings +58% on +42% sales revenues. Seven of the past 8 quarterly comparisons were well above the +25% minimum guideline (C criteria). Its annual earnings (A criteria) history has been strong, and it has a highest possible 99 Earnings Per Share Rating.
The high-ranked Comml Svcs-Advertising firm was last shown in this FSU section on 7/18/19 with an annotated graph under the headline, "Endured Distributional Pressure While Building on New Base". The number of top-rated funds owning its shares rose from 280 in Mar '18 to 544 in Jun '19, a reassuring sign concerning the I criteria. Its current Up/Down Volume Ratio of 0.9 is an unbiased indication its shares have been under slight distributional pressure over the past 50 days. It has a Timeliness Rating of A and a Sponsorship Rating of B. There are only 44.5 million shares outstanding (S criteria) which can contribute to greater volatility in the event of institutional buying or selling.
Charts courtesy of www.stockcharts.com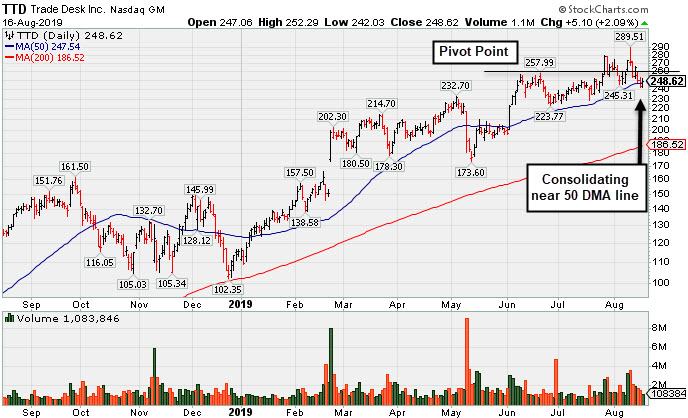
Endured Distributional Pressure While Building on New Base - Thursday, July 18, 2019
The Trade Desk Inc Cl A (TTD -$2.62 or -1.07% to $241.56) finished near the session high after enduring distributional pressure, ending with a loss on higher volume after wedging higher with gains lacking great volume conviction. Its prior low ($223.77 on 6/26/19) and 50-day moving average (DMA) line ($224) define near-term support to watch. It was highlighted in yellow in the earlier mid-day report (read here). Disciplined investors will note that gains above the pivot point with at least +40% above average volume are necessary to trigger a proper new technical buy signal. Subsequent gains for new highs with heavier volume would be a reassuring sign of fresh institutional buying demand which could lead to a meaningful and sustained advance.
TTD showed resilience since dropped from the Featured Stocks list on 5/13/19. The high-ranked Comml Svcs-Advertising firm was last shown in this FSU section on 4/30/19 with an annotated graph under the headline, "Pulled Back Below 'Max Buy' Level After Wedging Higher".
It reported earnings +44% on +41% sales revenues for the Mar '19 quarter. Seven of the past 8 quarterly comparisons were well above the +25% minimum guideline (C criteria). Its annual earnings (A criteria) history has been strong, and it has a 99 Earnings Per Share Rating.
The number of top-rated funds owning its shares rose from 280 in Mar '18 to 513 in Jun '19, a reassuring sign concerning the I criteria. Its current Up/Down Volume Ratio of 0.9 is an unbiased indication its shares have been under slight distributional pressure over the past 50 days. It has a Timeliness Rating of A and a Sponsorship Rating of B. There are only 44.5 million shares outstanding (S cirieria) which can contribute to greater volatility in the event of institutional buying or selling.
Charts courtesy of www.stockcharts.com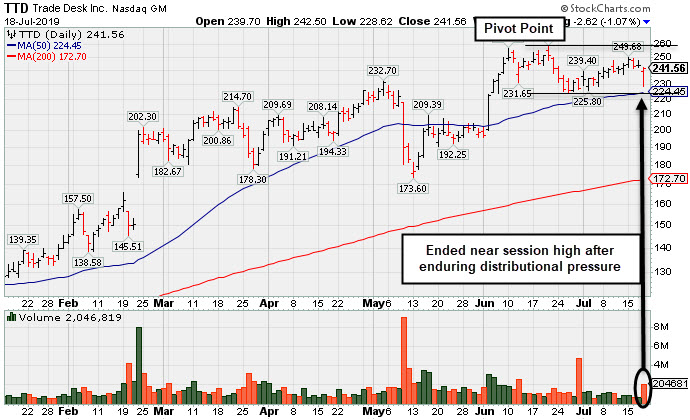
Pulled Back Below "Max Buy" Level After Wedging Higher - Tuesday, April 30, 2019
The Trade Desk Inc Cl A (TTD -$4.41 or -1.95% to $221.48) pulled back below its "max buy" level today and its color code was changed to yellow. Disciplined investors will note that recent gains above the pivot point did not have the volume necessary to trigger a proper new (or add-on) technical buy signal. Subsequent gains for new highs with heavier volume would be a reassuring sign of fresh institutional buying demand.
Its 50-day moving average (DMA) line ($198.44) defines initial support to watch above the prior low ($178.30 on 3/27/19). Keep in mind it is due to report earnings news before the open on 5/09/19. Volume and volatility often increase near earnings news.
The high-ranked Comml Svcs-Advertising firm was last shown in this FSU section on 3/21/19 with an annotated graph under the headline, "Hit Another New All-Time High Getting Extended From Prior Base". TTD was highlighted in yellow with pivot point cited based on its 12/03/18 high in the 2/06/19 mid-day report (read here). Its gain on 2/04/19 was backed by +48% above average volume while clearing a "double bottom" base and triggering a technical buy signal.
Bullish action came after it recently reported earnings +102% on +56% sales revenues for the Dec '18 quarter. Seven of the past 8 quarterly comparisons were well above the +25% minimum guideline (C criteria). Its annual earnings (A criteria) history has been strong, and it has a 99 Earnings Per Share Rating.
The number of top-rated funds owning its shares rose from 280 in Mar '18 to 479 in Mar '19, a reassuring sign concerning the I criteria. Its current Up/Down Volume Ratio of 1.3 is an unbiased indication its shares have been under accumulation over the past 50 days. It has a Timeliness Rating of A and a Sponsorship Rating of B. There are only 44.1 million shares outstanding Scirieria) which can contribute to greater volatility in the event of institutional buying or selling.
Charts courtesy of www.stockcharts.com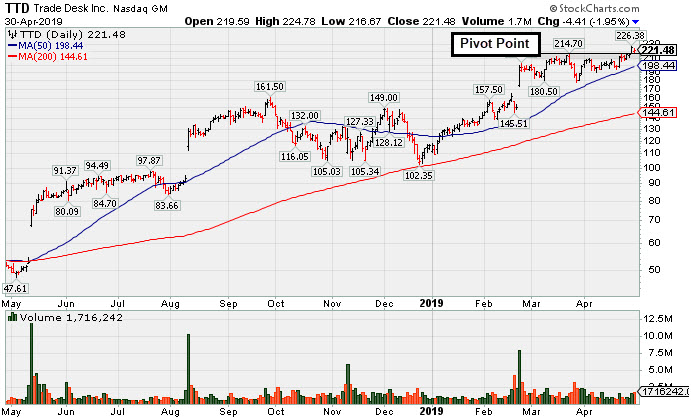
Hit Another New All-Time High Getting Extended From Prior Base - Thursday, March 21, 2019
The Trade Desk Inc Cl A (TTD +$7.61 or +3.69% to $213.57) posted a 3rd consecutive gain with below average volume for another new all-time high, getting very extended from the prior base. Its 50-day moving average line ($165) and prior high ($161.50 on 9/27/18) define important near-term support to watch on pullbacks.
The high-ranked Comml Svcs-Advertising firm was highlighted in yellow with pivot point cited based on its 12/03/18 high in the 2/06/19 mid-day report (read here). Its gain on 2/04/19 was backed by +48% above average volume while clearing a "double bottom" base and triggering a technical buy signal. Bullish action came after it recently reported earnings +102% on +56% sales revenues for the Dec '18 quarter. Seven of the past 8 quarterly comparisons were well above the +25% minimum guideline (C criteria). Its annual earnings (A criteria) history has been strong, and it has a 99 Earnings Per Share Rating.
The number of top-rated funds owning its shares rose from 280 in Mar '18 to 450 in Dec '18, a reassuring sign concerning the I criteria. Its current Up/Down Volume Ratio of 1.6 is an unbiased indication its shares have been under accumulation over the past 50 days. It has a Timeliness Rating of A and a Sponsorship Rating of B. There are only 43.2 million shares outstanding Scirieria) which can contribute to greater volatility in the event of institutional buying or selling.
Charts courtesy of www.stockcharts.com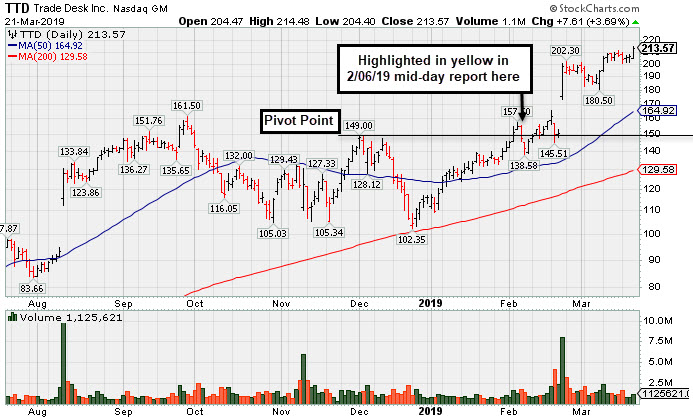
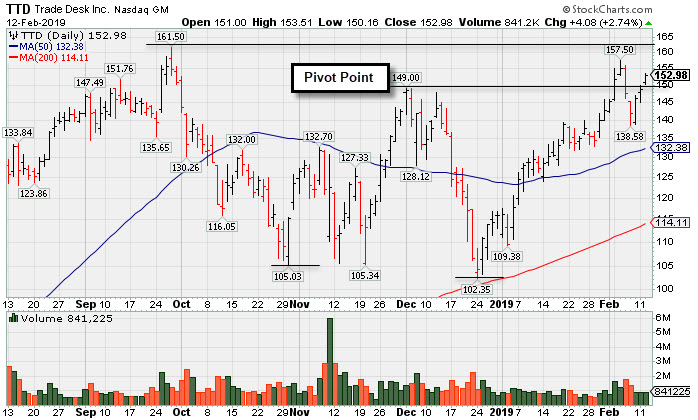
Near High After Third Consecutive Gain with Light Volume - Tuesday, February 12, 2019
The Trade Desk Inc Cl A (TTD (+$4.08 or +2.74% to $152.98) is perched within close striking distance of its all-time high. The high-ranked Comml Svcs-Advertising firm posted a third consecutive small gain with lighter volume after 2 losses with higher volume. It was highlighted in yellow with pivot point cited based on its 12/03/18 high in the 2/06/19 mid-day report (read here). It faces little resistance due to overhead supply up to the $161 level. Its gain on 2/04/19 was backed by +48% above average volume while clearing a "double bottom" base and triggering a technical buy signal.
Recently it reported earnings +86% on +50% sales revenues for the Sep '18 quarter. Three of the past 4 quarterly comparisons were well above the +25% minimum guideline (C criteria). Its annual earnings (A criteria) history has been strong, and it has a 97 Earnings Per Share Rating.
The number of top-rated funds owning its shares rose from 280 in Mar '18 to 459 in Dec '18, a reassuring sign concerning the I criteria. Its current Up/Down Volume Ratio of 1.6 is an unbiased indication its shares have been under accumulation over the past 50 days. It has a Timeliness Rating of A and a Sponsorship Rating of B. There are only 43.2 million shares outstanding Scirieria) which can contribute to greater volatility in the event of institutional buying or selling.
Charts courtesy of www.stockcharts.com