Pullback on Heavy Volume Followed Weak Quarterly Earnings Report - Friday, February 19, 2021
Perched Near All-Time High Stubbornly Holding Ground - Tuesday, January 26, 2021
Stubbornly Holding Ground Extended From Prior Base - Thursday, December 31, 2020
Computer Software - Financial Firm Hovering Near Record High - Tuesday, December 8, 2020
Churning Action Near Prior High Indicative of Distributional Pressure - Thursday, November 12, 2020
Pullback on Heavy Volume Followed Weak Quarterly Earnings Report - Friday, February 19, 2021
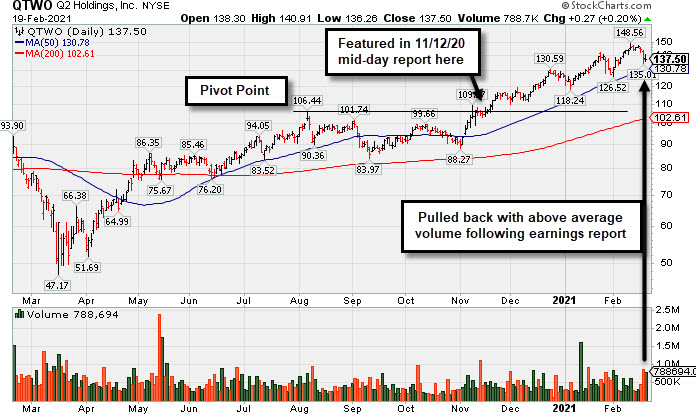
Q2 Holdings Inc (QTWO +$0.27 or +0.20% to $137.50) halted its slide on Friday. It suffered a big volume-driven losses on Thursday after reporting Dec '20 quarterly earnings -95% on +26% sales revenues versus the year ago period, below the +25% minimum earnings guideline (C criteria), raising fundamental concerns. Volume and volatility often increase near earnings news. Its Earnings Per Share Rating is now 75, down from 96 when last shown in the FSU section on 1/26/21 with an annotated graph under the headline, "Perched Near All-Time High Stubbornly Holding Ground".
QTWO has been repeatedly noted as "extended from any sound base". Its 50-day moving average (DMA) line ($130.78) defines important near term support to watch above the prior low ($126.52 on 2/01/21)
It traded up as much as +41.3% since first highlighted in yellow with new pivot point cited based on its 8/06/20 high plus 10 cents in the 11/12/20 mid-day report (read here). It had great earning increases with strong underlying sales revenues growth for the Jun and Sep '20 quarters versus the year ago periods. Annual earnings growth has been strong. It completed new Public Offerings on 6/06/19 and 5/13/20. The company hails from the Computer Sftwr-Financial group. There are only 53.9 million shares outstanding (S criteria).
The number of top-rated funds owning its shares rose from 404 in Dec '19 to 482 in Dec '20, a reassuring sign concerning the I criteria. Its current Up/Down Volume Ratio of 1.6 is an unbiased indication its shares have been neutral concerning accumulation/distribution over the past 50 days.
Perched Near All-Time High Stubbornly Holding Ground - Tuesday, January 26, 2021
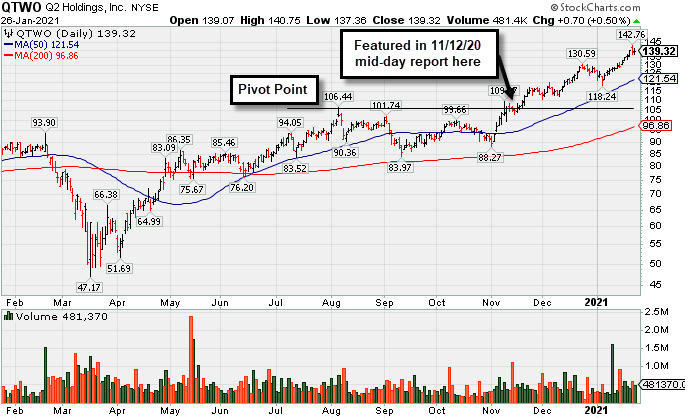
Q2 Holdings Inc (QTWO +$0.70 or +0.50% to $139.32) posted a gain today on average and it is perched at its all-time high. It stubbornly held its ground while making steady progress in recent months. Its 50-day moving average (DMA) line ($121.54) defines important near term support to watch on pullbacks.
QTWO was last shown in the FSU section on 12/31/20 with an annotated graph under the headline, "Stubbornly Holding Ground Extended From Prior Base". It was highlighted in yellow with new pivot point cited based on its 8/06/20 high plus 10 cents in the 11/12/20 mid-day report (read here).
It has a 96 Earnings Per Share Rating. It showed great earning increases with strong underlying sales revenues growth for the Jun and Sep '20 quarters versus the year ago periods. Annual earnings growth has been strong. Completed new Public Offerings on 6/06/19 and 5/13/20. The company hails from the Computer Sftwr-Financial group. There are only 53.9 million shares outstanding (S criteria).
The number of top-rated funds owning its shares rose from 404 in Dec '19 to 476 in Sep '20, a reassuring sign concerning the I criteria. Its current Up/Down Volume Ratio of 1.4 is an unbiased indication its shares have been neutral concerning accumulation/distribution over the past 50 days.
Stubbornly Holding Ground Extended From Prior Base - Thursday, December 31, 2020
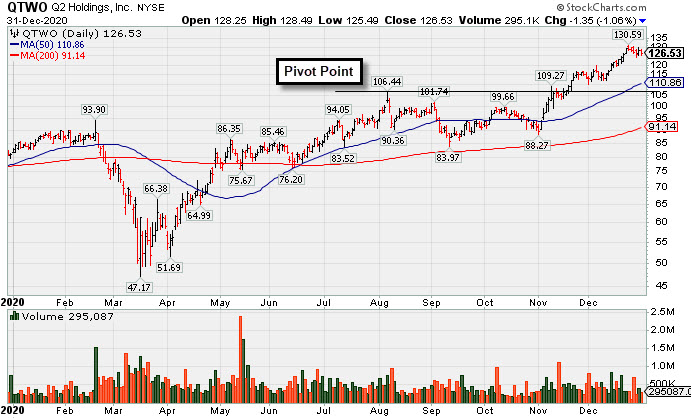
Q2 Holdings Inc (QTWO -$1.35 or -1.06% to $126.53) is hovering above its "max buy" level and perched near its all-time high. The 50-day moving average (DMA) line ($110.86) prior high in the $106 area defines initial support to watch on pullbacks.
QTWO was last shown in the FSU section on 12/08/20 with an annotated graph under the headline, "Computer Software - Financial Firm Hovering Near Record High". It was highlighted in yellow with new pivot point cited based on its 8/06/20 high plus 10 cents in the 11/12/20 mid-day report (read here).
It has a 97 Earnings Per Share Rating. It showed great earning increases with strong underlying sales revenues growth for the Jun and Sep '20 quarters versus the year ago periods. Annual earnings growth has been strong. Completed new Public Offerings on 6/06/19 and 5/13/20. The company hails from the Computer Sftwr-Financial group. There are only 53.9 million shares outstanding (S criteria).
The number of top-rated funds owning its shares rose from 404 in Dec '19 to 466 in Sep '20, a reassuring sign concerning the I criteria. Its current Up/Down Volume Ratio of 1.3 is an unbiased indication its shares have been neutral concerning accumulation/distribution over the past 50 days.
Computer Software - Financial Firm Hovering Near Record High - Tuesday, December 8, 2020
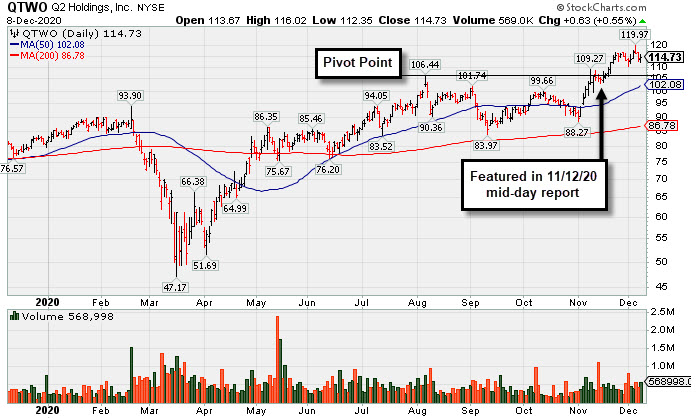
Q2 Holdings Inc (QTWO +$0.63 or +0.55% to $114.73) posted a gain today with above average volume while hovering above its "max buy" level and perched near its all-time high. The prior high in the $106 area defines initial support to watch above its 50-day moving average (DMA) line ($$102.08) on pullbacks.
QTWO was last shown in the FSU section on 11/12/20 with an annotated graph under the headline "Churning Action Near Prior High Indicative of Distributional Pressure". It was highlighted in yellow with new pivot point cited based on its 8/06/20 high plus 10 cents in the earlier mid-day report (read here).
It has a 97 Earnings Per Share Rating. It showed great earning increases with strong underlying sales revenues growth for the Jun and Sep '20 quarters versus the year ago periods. Annual earnings growth has been strong. Completed new Public Offerings on 6/06/19 and 5/13/20. The company hails from the Computer Sftwr-Financial group. There are only 59.3 million shares outstanding (S criteria).
The number of top-rated funds owning its shares rose from 404 in Dec '19 to 466 in Sep '20, a reassuring sign concerning the I criteria. Its current Up/Down Volume Ratio of 1.0 is an unbiased indication its shares have been neutral concerning accumulation/distribution over the past 50 days.
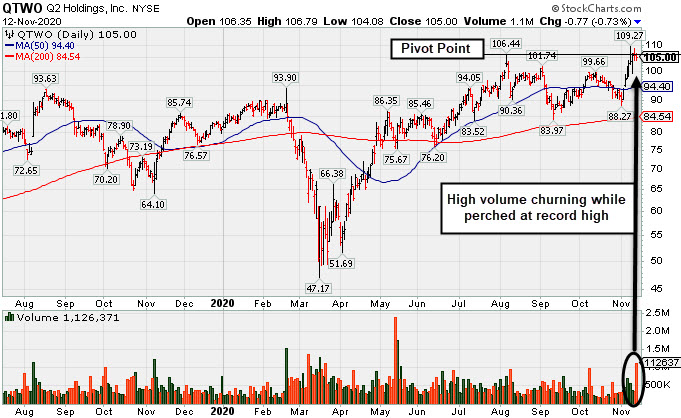
Churning Action Near Prior High Indicative of Distributional Pressure - Thursday, November 12, 2020
Q2 Holdings Inc (QTWO -$0.77 or -0.73% to $105.00) finished lower after highlighted in yellow with new pivot point cited based on its 8/06/20 high plus 10 cents in the earlier mid-day report (read here). Perched at a new 52-week and all-time high after a spurt of gains, the session's high volume "churning" without meaningful price progress had the look of distributional pressure or selling from the institutonal crowd. Disciplined investors may watch for subsequent confirming gains above the pivot point backed by at least +40% above average volume to help clinch a convincing technical buy signal.
It has a 97 Earnings Per Share Rating. It showed great earning increases with strong underlying sales revenues growth for the Jun and Sep '20 quarters versus the year ago periods. Annual earnings growth has been strong. Completed new Public Offerings on 6/06/19 and 5/13/20. The company hails from the Computer Sftwr-Financial group. There are only 59.3 million shares outstanding (S criteria).
The number of top-rated funds owning its shares rose from 404 in Dec '19 to 465 in Sep '20, a reassuring sign concerning the I criteria. Its current Up/Down Volume Ratio of 0.9 is an unbiased indication its shares have been under slight distributional pressure over the past 50 days.
.