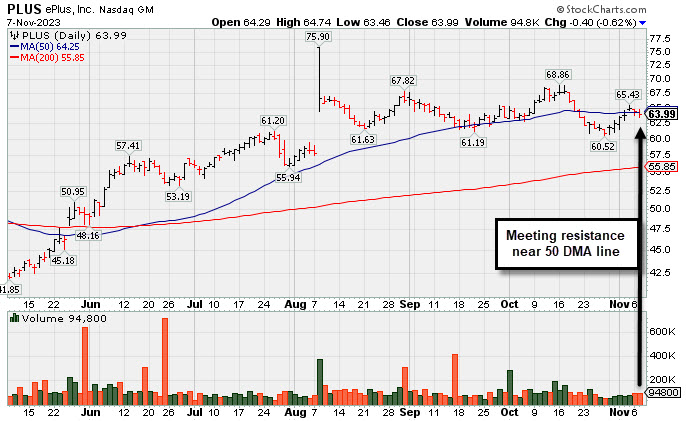
Just Below 50-Day Moving Average and a Subpar September Report - Tuesday, November 7, 2023
ePlus (PLUS -$0.40 or -0.62% to $63.99) has recently been sputtering and meeting resistance near its 50-day moving average (DMA) line ($64.25) after rebounding near that important short-term average with a spurt of low-volume gains. It reported Sep '23 quarterly earnings +15% on +19% sales revenues versus the year ago period, below the +25% minimum earnings guideline (C criteria), raising concerns with regard to the fundamental guidelines of the fact-based investment system.
PLUS was highlighted in yellow in the 8/08/23 mid-day report (read here) with pivot point cited based on its May '22 high plus 10 cents. It was last shown in this FSU section on 9/28/23 with an annotated graph under the headline, "Orderly Consolidation Continues for ePlus".
It stalled following the bullish action after it reported earnings +42% on +25% sales revenues for the Jun '23 quarter versus the year ago period, its 3rd consecutive quarterly earnings increase above the +25% minimum guideline (C criteria). Annual earnings growth (A criteria) has been strong. It has a 97 earnings Per Share rating.
It hails from the Computer-Tech Services group which is currently ranked 59th on the 197 Industry Groups list. The small supply of only 26.9 million shares outstanding (S criteria) can contribute to greater price volatility in the event of institutional buying or selling. The number of top-rated funds owning its shares reportedly rose from 407 in Jun '23 to 427 in Sep '23, a reassuring sign concerning the I criteria. Its current Up/Down Volume ratio of 1.1 is an unbiased indication its shares have been under slight accumulation over the past 50 days.
It hails from the Computer-Tech Services group which is currently ranked 59th on the 197 Industry Groups list. The small supply of only 26.9 million shares outstanding (S criteria) can contribute to greater price volatility in the event of institutional buying or selling. The number of top-rated funds owning its shares reportedly rose from 407 in Jun '23 to 427 in Sep '23, a reassuring sign concerning the I criteria. Its current Up/Down Volume ratio of 1.1 is an unbiased indication its shares have been under slight accumulation over the past 50 days.
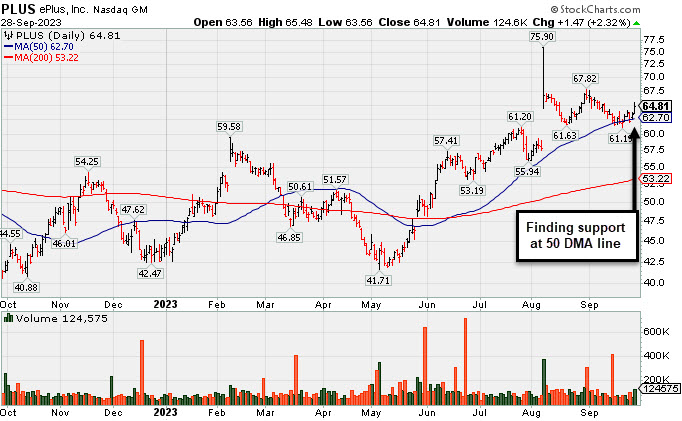
Orderly Consolidation Continues for ePlus - Thursday, September 28, 2023
ePlus (PLUS +$1.47 or +2.32% to $64.81) found support while recently consolidating near its 50-day moving average (DMA) line ($62.70). More damaging losses may trigger a technical sell signal.
PLUS was highlighted in yellow in the 8/08/23 mid-day report (read here) with pivot point cited based on its May '22 high plus 10 cents. It was last shown in this FSU section on 9/12/23 with an annotated graph under the headline, "Still Consolidating Above 50 DMA Line".
Bullish action came after it reported earnings +42% on +25% sales revenues for the Jun '23 quarter versus the year ago period, its 3rd consecutive quarterly earnings increase above the +25% minimum guideline (C criteria), helping it better match the winning models of the fact-based investment system. Annual earnings growth (A criteria) has been strong. It has a 97 earnings Per Share rating.
It hails from the Computer-Tech Services group which is currently ranked 76th on the 197 Industry Groups list. The small supply of only 26.9 million shares outstanding (S criteria) can contribute to greater price volatility in the event of institutional buying or selling. The number of top-rated funds owning its shares reportedly fell from 422 in Sep '22 to 409 in Jun '23, not a reassuring sign concerning the I criteria. Meanwhile, its current Up/Down Volume ratio of 0.8 is an unbiased indication its shares have been under slight accumulation over the past 50 days.
It hails from the Computer-Tech Services group which is currently ranked 76th on the 197 Industry Groups list. The small supply of only 26.9 million shares outstanding (S criteria) can contribute to greater price volatility in the event of institutional buying or selling. The number of top-rated funds owning its shares reportedly fell from 422 in Sep '22 to 409 in Jun '23, not a reassuring sign concerning the I criteria. Meanwhile, its current Up/Down Volume ratio of 0.8 is an unbiased indication its shares have been under slight accumulation over the past 50 days.
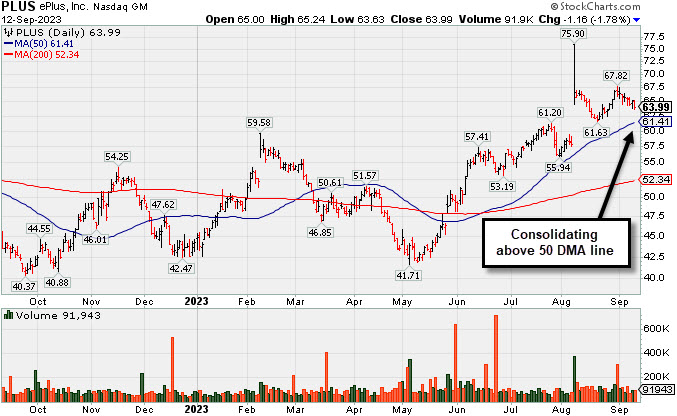
Still Consolidating Above 50 DMA Line - Tuesday, September 12, 2023
ePlus (PLUS -$1.16 or -1.78% to $63.99) has still been consolidating since a noted "breakaway gap" on 8/08/23. Fundamentals remain strong. The recent low and 50-day moving average (DMA) line ($61.41) define important near-term support in the $61 area.
PLUS was highlighted in yellow in the 8/08/23 mid-day report (read here) with pivot point cited based on its May '22 high plus 10 cents. It was shown in greater detail that evening with an annotated graph under the headline, "ePLUS Gapped Up but Ended in Lower Half of Intra-Day Range".
Bullish action came after it reported earnings +42% on +25% sales revenues for the Jun '23 quarter versus the year ago period, its 3rd consecutive quarterly earnings increase above the +25% minimum guideline (C criteria), helping it better match the winning models of the fact-based investment system. Annual earnings growth (A criteria) has been strong. It has a 97 earnings Per Share rating.
It hails from the Computer-Tech Services group which is currently ranked 61st on the 197 Industry Groups list. The small supply of only 26.9 million shares outstanding (S criteria) can contribute to greater price volatility in the event of institutional buying or selling. The number of top-rated funds owning its shares reportedly fell from 422 in Sep '22 to 409 in Jun '23, not a reassuring sign concerning the I criteria. Meanwhile, its current Up/Down Volume ratio of 1.1 is an unbiased indication its shares have been under slight accumulation over the past 50 days.
It hails from the Computer-Tech Services group which is currently ranked 61st on the 197 Industry Groups list. The small supply of only 26.9 million shares outstanding (S criteria) can contribute to greater price volatility in the event of institutional buying or selling. The number of top-rated funds owning its shares reportedly fell from 422 in Sep '22 to 409 in Jun '23, not a reassuring sign concerning the I criteria. Meanwhile, its current Up/Down Volume ratio of 1.1 is an unbiased indication its shares have been under slight accumulation over the past 50 days.
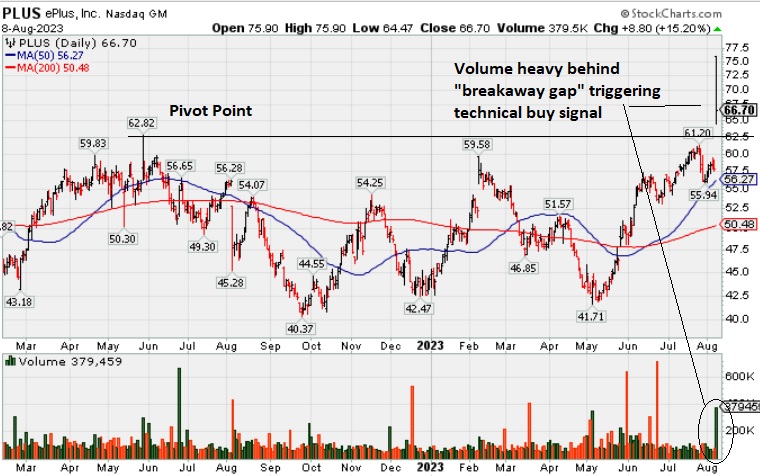
ePLUS Gapped Up but Ended in Lower Half of Intra-Day Range - Tuesday, August 8, 2023
ePlus (PLUS +$8.80 or +15.20% to $66.70) was highlighted in yellow with pivot point cited based on its may '22 high plus 10 cents (read here). There was a "breakaway gap" and it hit a new all-time high with today's big volume-driven gain triggering a technical buy signal.
Bullish action came after it reported earnings +42% on +25% sales revenues for the Jun '23 quarter versus the year ago period, its 3rd consecutive quarterly earnings increase above the +25% minimum guideline (C criteria), helping it better match the winning models of the fact-based investment system. Annual earnings growth (A criteria) has been strong. It has a 97 earnings Per Share rating.
It hails from the Computer-Tech Services group which is currently ranked 86th on the 197 Industry Groups list. The small supply of only 26.8 million shares outstanding (S criteria) can contribute to greater price volatility in the event of institutional buying or selling. The number of top-rated funds owning its shares reportedly fell from 422 in Sep '22 to 404 in Jun '23, not a reassuring sign concerning the I criteria. Meanwhile, its current Up/Down Volume ratio of 0.9 is an unbiased indication its shares have been under slight distributional pressure over the past 50 days.
It hails from the Computer-Tech Services group which is currently ranked 86th on the 197 Industry Groups list. The small supply of only 26.8 million shares outstanding (S criteria) can contribute to greater price volatility in the event of institutional buying or selling. The number of top-rated funds owning its shares reportedly fell from 422 in Sep '22 to 404 in Jun '23, not a reassuring sign concerning the I criteria. Meanwhile, its current Up/Down Volume ratio of 0.9 is an unbiased indication its shares have been under slight distributional pressure over the past 50 days.