Faces Near-Term Resistance Up to $73 Due to Overhead Supply - Monday, July 24, 2017
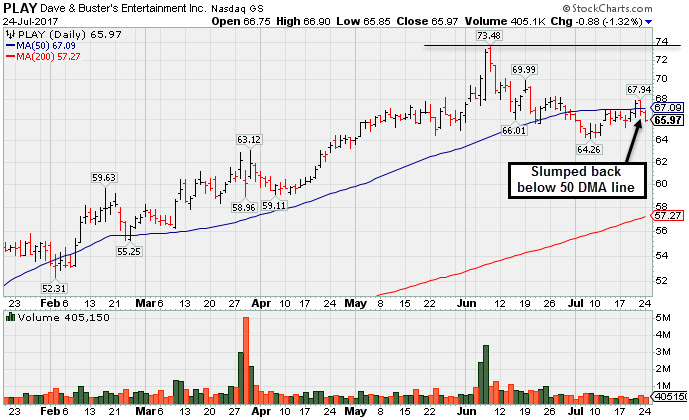
Dave & Buster's Ent Inc (PLAY -$0.89 or -1.33% to $65.96) sputtered back below its 50-day moving average (DMA) line ($67.09) raising concerns. It faces near-term resistance due to overhead supply up through the $73 level. Prior lows in the $64 area define important near-term support to watch where more damaging losses would trigger a worrisome technical sell signal.The Retail - Restaurant firm was last shown in this FSU section on 6/12/17 with an annotated graph under the headline, "Perched Near Record High After Solid April '17 Quarterly Results". It reported earnings +36% on +16% sales revenues for the April '17 quarter, an improvement after the Jan '17 comparisons was below the +25% minimum guideline (C criteria).
The number of top-rated funds owning its shares rose from 310 in Mar '16 to 432 in Jun '17, a reassuring sign concerning the I criteria. Its small supply of only 41.5 million shares outstanding (S criteria) can contribute to greater price volatility in the event of institutional buying or selling. Its annual earnings history (A criteria) has been strong. Currently it has a B Timeliness Rating and a B Sponsorship Rating. Following its $16 IPO on 10/10/14 it completed Secondary Offerings on 2/05/15, 5/27/15, and 10/01/15.
Perched Near Record High After Solid April '17 Quarterly Results - Monday, June 12, 2017
Dave & Buster's Ent Inc (PLAY +$0.54 or +0.78% to $69.44) halted its slide today with a gain on average volume after pulling back from its all-time high with above average volume behind 2 consecutive losses. Its 50-day moving average (DMA) line ($64.78) defines near-term support to watch.The Retail - Restaurant firm was last shown in this FSU section on 5/02/17 with an annotated graph under the headline, "New Record High With Solid Gain on Near Average Volume". It reported earnings +36% on +16% sales revenues for the April '17 quarter, an improvement after the Jan '17 comparisons was below the +25% minimum guideline (C criteria).
The number of top-rated funds owning its shares rose from 310 in Mar '16 to 409 in Mar '17, a reassuring sign concerning the I criteria. Its small supply of only 41.5 million shares outstanding (S criteria) can contribute to greater price volatility in the event of institutional buying or selling. Its annual earnings history (A criteria) has been strong. Currently it has an A Timeliness Rating and a B Sponsorship Rating. Following its $16 IPO on 10/10/14 it completed Secondary Offerings on 2/05/15, 5/27/15, and 10/01/15.
New Record High With Solid Gain on Near Average Volume - Tuesday, May 2, 2017
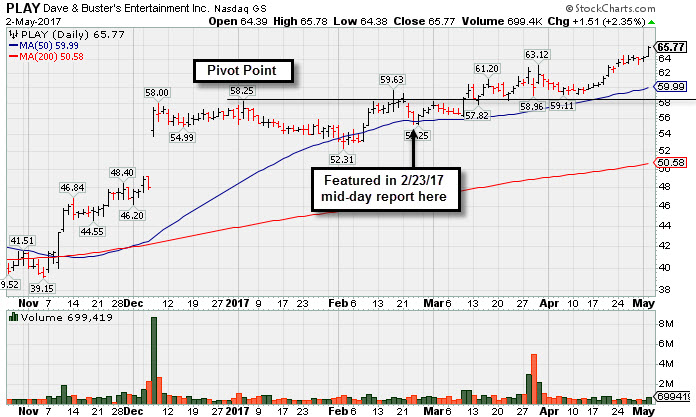
Dave & Buster's Ent Inc (PLAY +$1.51 or +2.35% to $65.77) finished a penny off the session high today with a big gain backed by near average volume. It recently reported earnings +19% on +15% sales revenues for the Jan '17 quarter, below the +25% minimum guideline (C criteria), raising fundamental concerns. Its 50-day moving average (DMA) line defines a near-term support level. Subsequent losses leading to a violation of the 50 DMA line ($59.99) would raise concerns and trigger a technical sell signal.Disciplined followers of the fact-based investment system know that buying efforts should only be made in fundamentally superior stocks and only after after a technical buy signal has been triggered. Selling should not be based upon a change fundamentals, but should strictly be based upon the technical action in a stock or market. Therefore, some investors may still be electing to give it the benefit of the doubt until any worrisome technical sell signals raise concerns.
The Retail - Restaurant firm was last shown in this FSU section on 3/29/17 with an annotated graph under the headline, "Retreated From All-Time High Following Earnings Report". The number of top-rated funds owning its shares rose from 310 in Mar '16 to 393 in Mar '17, a reassuring sign concerning the I criteria. Its small supply of only 42 million shares outstanding (S criteria) can contribute to greater price volatility in the event of institutional buying ore selling. Its annual earnings history (A criteria) has been strong. Currently it has an A Timeliness Rating and a B Sponsorship Rating. Following its $16 IPO on 10/10/14 it completed Secondary Offerings on 2/05/15, 5/27/15, and 10/01/15.
Retreated From All-Time High Following Earnings Report - Wednesday, March 29, 2017
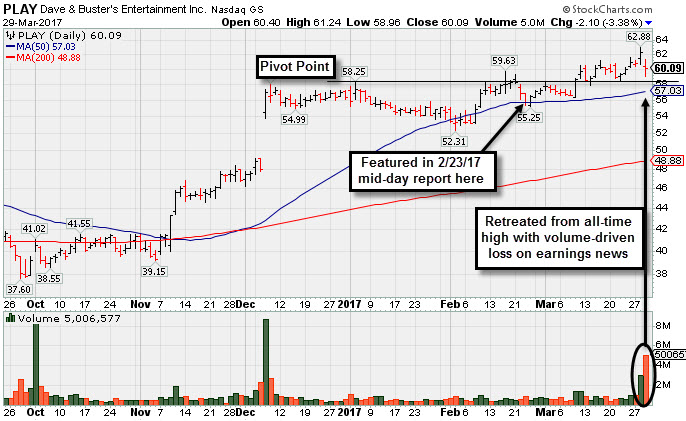
Dave & Buster's Ent Inc (PLAY -$2.10 or -3.38% to $60.09) reported earnings +19% on +15% sales revenues for the Jan '17 quarter, below the +25% minimum guideline (C criteria). The stock retreated from its all-time high hit on the prior session with a loss on heavy volume. Prior highs in the $58 area and its 50-day moving average (DMA) line recently acted as a support level. Subsequent losses leading to a violation of the 50 DMA line ($57.03) would raise concerns and trigger a technical sell signal.
Disciplined followers of the fact-based investment system know that buying efforts should only be made in fundamentally superior stocks and only after after a technical buy signal has been triggered. Selling should not be based upon a change fundamentals, but should strictly be based upon the technical action in a stock or market. Therefore, some investors may still be electing to give it the benefit of the doubt until any worrisome technical sell signals raise concerns.
The Retail - Restaurant firm was last shown in this FSU section on 2/23/17 with an annotated graph under the headline, "Consolidating Near 50 DMA After Recent Gains Lacked Volume", after highlighted in yellow with pivot point cited based on its 1/04/17 high plus 10 cents in the earlier mid-day report (read here). Subsequent gains for new highs with above average volume helped trigger a convincing technical buy signal.
It reported earnings +108% on +19% sales revenues for the Oct '16 quarter, and prior quarterly comparisons were above the +25% minimum earnings guideline (C criteria). Its annual earnings history (A criteria) has been strong. Currently it has an A Timeliness Rating and a B Sponsorship Rating.
The number of top-rated funds owning its shares rose from 310 in Mar '16 to 381 in Dec '16, a reassuring sign concerning the I criteria. Its small supply of only 42.1 million shares outstanding (S criteria) can contribute to greater price volatility in the event of institutional buying ore selling. Following its $16 IPO on 10/10/14 it completed Secondary Offerings on 2/05/15, 5/27/15, and 10/01/15.
Consolidating Near 50 DMA After Recent Gains Lacked Volume - Thursday, February 23, 2017
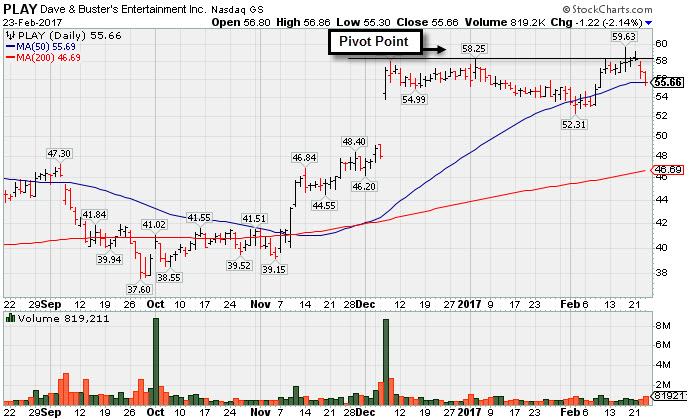
Dave & Buster's Ent Inc (PLAY -$1.22 or -2.14% to $55.66) was highlighted in yellow with pivot point cited based on its 1/04/17 high plus 10 cents in the earlier mid-day report (read here). Subsequent gains for new highs with above average volume may trigger a convincing technical buy signal. It would be a very reassuring sign to see fresh proof of serious new institutional buying demand.
Recently it wedged to new highs with gains lacking great volume. It found support near its 50-day moving average (DMA) line while consolidating since a big "breakaway gap" on 12/07/16. More damaging losses undercutting the 50 DMA line and prior low ($52.31) would raise concerns and trigger a technical sell signal.
It reported earnings +108% on +19% sales revenues for the Oct '16 quarter, and prior quarterly comparisons were above the +25% minimum earnings guideline (C criteria). Its annual earnings history (A criteria) has been strong, and it has earned the highest possible 99 Earnings Per Share Rating. Currently it has an A Timeliness Rating and a C Sponsorship Rating.
The number of top-rated funds owning its shares rose from 310 in Mar '16 to 368 in Dec '16, a reassuring sign concerning the I criteria. Its small supply of only 42.1 million shares outstanding (S criteria) can contribute to greater price volatility in the event of institutional buying ore selling. Following its $16 IPO on 10/10/14 it completed Secondary Offerings on 2/05/15, 5/27/15, and 10/01/15.


