Abrupt Slump Back Into Latest Base With 2 Volume-Driven Losses - Friday, June 18, 2021
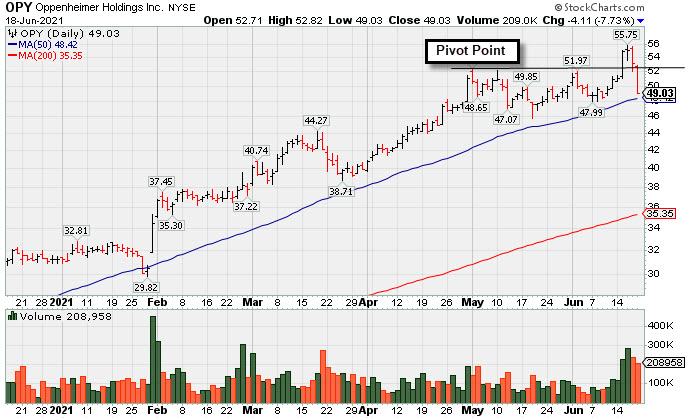
Oppenheimer Holdings Inc (OPY -$4.11 or -7.73% to $49.03) pulled back abruptly with above average volume behind 2 consecutive losses, slumping below prior highs and back into the prior base raising concerns. A new base had formed after it was last shown in the FSU section on 5/17/21 with an annotated graph under the headline, "Extended From Any Sound Base After Decent Rally". Its 50-day moving average (DMA) line ($48.48) defines important near term support. Fundamentals remain strong.
Bullish action came after it reported Mar '21 quarterly earnings +402% on +59% sales revenues versus the year ago period. It showed strong earnings increases over the year ago period in the past 4 quarterly comparisons. Annual earnings (A criteria) growth has been strong after a downturn and losses in FY '15 & '16." It has the highest possible Earnings Per Share Rating of 99.
OPY traded up as much as +43.13% since first highlighted in yellow with pivot point cited based on its 2/05/21 high plus 10 cents in the 2/25/21 mid-day report (read here). The company hails from the FINANCIAL SERVICES - Investment Brokerage - Regional industry group which is now ranked 44th on the 197 Industry Groups list (L criteria). There is a small supply of only 9.2 million shares in the publicly traded float (S criteria) which can contribute to greater price volatility in the event of institutional buying or selling. The number of top-rated funds owning its shares reportedly fell from 212 in Jun '20 to 215 in Mar '21, however, its current Up/Down Volume Ratio of 1.8 is an unbiased indication its shares have been under slight accumulation over the past 50 days (I criteria).
Extended From Any Sound Base After Decent Rally - Monday, May 17, 2021
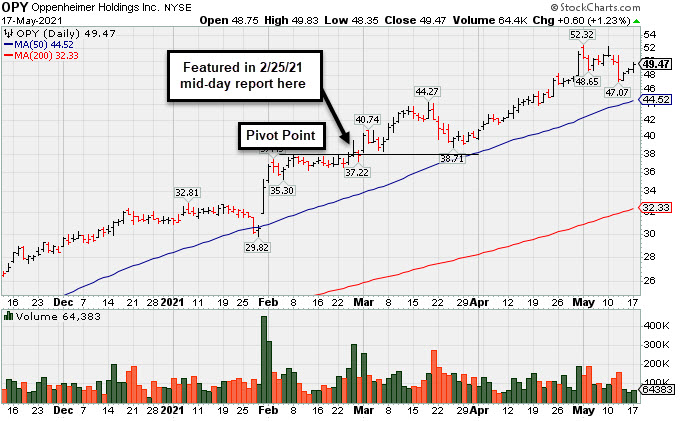
Oppenheimer Holdings Inc (OPY +$0.60 or +1.23% to $49.47) posted a 3rd consecutive quiet gain today, hovering near its all-time high, very extended from any sound base. Bullish action came after it reported Mar '21 quarterly earnings +402% on +59% sales revenues versus the year ago period. The prior high in the $44 area defines initial support to watch coinciding with its 50-day moving average (DMA) line ($44.62).
OPY traded up as much as +34.7% since first highlighted in yellow with pivot point cited based on its 2/05/21 high plus 10 cents in the 2/25/21 mid-day report (read here). It was shown in the FSU section on 4/20/21 with an annotated graph under the headline, "Negative Reversal After 7 Consecutive Gains".
OPY made progress since noted in the 2/05/21 mid-day report - "Reported Dec '20 quarterly earnings +235% on +43% sales revenues versus the year ago period. Showed strong earnings increases over the year ago period in the past 3 quarterly comparisons. Annual earnings (A criteria) growth has been strong after a downturn and losses in FY '15 & '16." It has the highest possible Earnings Per Share Rating of 99.
The company hails from the FINANCIAL SERVICES - Investment Brokerage - Regional industry group which is now ranked 33rd on the 197 Industry Groups list (L criteria). There is a small supply of only 9.2 million shares in the publicly traded float (S criteria) which can contribute to greater price volatility in the event of institutional buying or selling. The number of top-rated funds owning its shares reportedly fell from 212 in Jun '20 to 212 in Mar '21, however, its current Up/Down Volume Ratio of 1.3 is an unbiased indication its shares have been under slight accumulation over the past 50 days (I criteria).
Negative Reversal After 7 Consecutive Gains - Tuesday, April 20, 2021
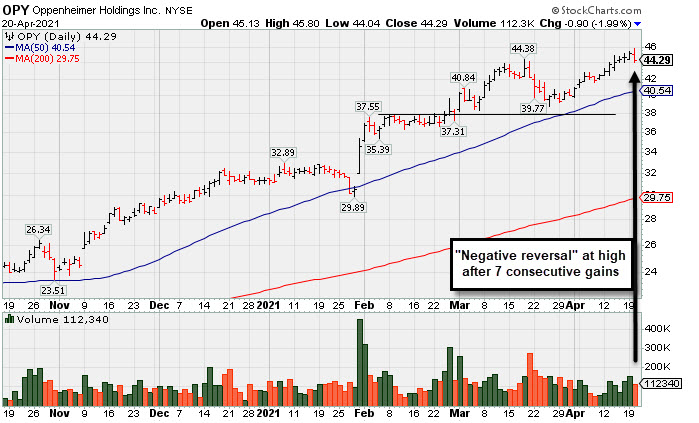
Oppenheimer Holdings Inc (OPY -$0.90 or -1.99% to $44.29) had a "negative reversal" today after hitting a new all-time high with 7 consecutive small gains. It is extended from any sound base. Its 50-day moving average (DMA) line ($40.55) and prior low define near-term support to watch on pullbacks.
OPY was first highlighted in yellow with pivot point cited based on its 2/05/21 high plus 10 cents in the 2/25/21 mid-day report (read here). It was shown in the FSU section on 3/31/21 with an annotated graph under the headline, "Oppenheimer Consolidating Near Max Buy Level".
OPY made progress since noted in the 2/05/21 mid-day report - "Reported Dec '20 quarterly earnings +235% on +43% sales revenues versus the year ago period. Showed strong earnings increases over the year ago period in the past 3 quarterly comparisons. Annual earnings (A criteria) growth has been strong after a downturn and losses in FY '15 & '16." It has the highest possible Earnings Per Share Rating of 99.
The company hails from the FINANCIAL SERVICES - Investment Brokerage - Regional industry group which is now ranked 26th on the 197 Industry Groups list (L criteria). There is a small supply of only 9.2 million shares in the publicly traded float (S criteria) which can contribute to greater price volatility in the event of institutional buying or selling. The number of top-rated funds owning its shares reportedly fell from 212 in Jun '20 to 198 in Mar '21, however, its current Up/Down Volume Ratio of 1.5 is an unbiased indication its shares have been under slight accumulation over the past 50 days (I criteria).
Oppenheimer Consolidating Near Max Buy Level - Wednesday, March 31, 2021
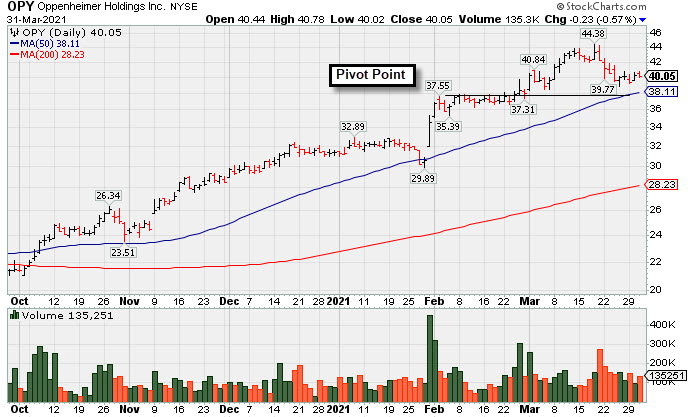
Oppenheimer Holdings Inc (OPY -$0.23 or -0.57% to $40.05) is consolidating near its "max buy" level after getting extended from the previously noted base. Its 50-day moving average (DMA) line ($38.15) defines near-term support to watch.
OPY was first highlighted in yellow with pivot point cited based on its 2/05/21 high plus 10 cents in the 2/25/21 mid-day report (read here). It was shown in the FSU section on 3/12/21 with an annotated graph under the headline, "Perched at Record High After 6 Consecutive Gains".
OPY made progress since noted in the 2/05/21 mid-day report - "Reported Dec '20 quarterly earnings +235% on +43% sales revenues versus the year ago period. Showed strong earnings increases over the year ago period in the past 3 quarterly comparisons. Annual earnings (A criteria) growth has been strong after a downturn and losses in FY '15 & '16." It has the highest possible Earnings Per Share Rating of 99.
The company hails from the FINANCIAL SERVICES - Investment Brokerage - Regional industry group which is now ranked 35th on the 197 Industry Groups list(L criteria). There is a small supply of only 9.2 million shares in the publicly traded float (S criteria) which can contribute to greater price volatility in the event of institutional buying or selling. The number of top-rated funds owning its shares reportedly fell from 212 in Jun '20 to 199 in Dec '20, however, its current Up/Down Volume Ratio of 1.2 is an unbiased indication its shares have been under slight accumulation over the past 50 days (I criteria).
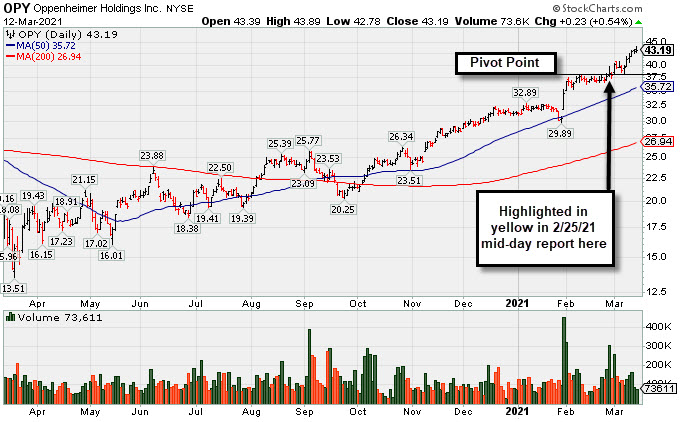
Perched at Record High After 6 Consecutive Gains - Friday, March 12, 2021
Oppenheimer Holdings Inc (OPY +$0.23 or +0.54% to $43.19) hit another new all-time high with today's 6th consecutive gain. Disciplined investors avoid chasing stocks extended more than +5% above their pivot point.
OPY was first highlighted in yellow with pivot point cited based on its 2/05/21 high plus 10 cents in the 2/25/21 mid-day report (read here). It was shown in the FSU section that evening with an annotated graph under the headline, "Rose From "3-weeks Tight" Base But Ended Near Session Low".
OPY stubbornly held its ground and made progress since noted in the 2/05/21 mid-day report - "Reported Dec '20 quarterly earnings +235% on +43% sales revenues versus the year ago period. Showed strong earnings increases over the year ago period in the past 3 quarterly comparisons. Annual earnings (A criteria) growth has been strong after a downturn and losses in FY '15 & '16." It has the highest possible Earnings Per Share Rating of 99.
The company hails from the FINANCIAL SERVICES - Investment Brokerage - Regional industry group which is now ranked 36th on the 197 Industry Groups list(L criteria). There is a small supply of only 9.2 million shares in the publicly traded float (S criteria) which can contribute to greater price volatility in the event of institutional buying or selling. The number of top-rated funds owning its shares reported fell from 214 in Jun '20 to 200 in Dec '20, however, its current Up/Down Volume Ratio of 1.5 is an unbiased indication its shares have been under slight accumulation over the past 50 days (I criteria).
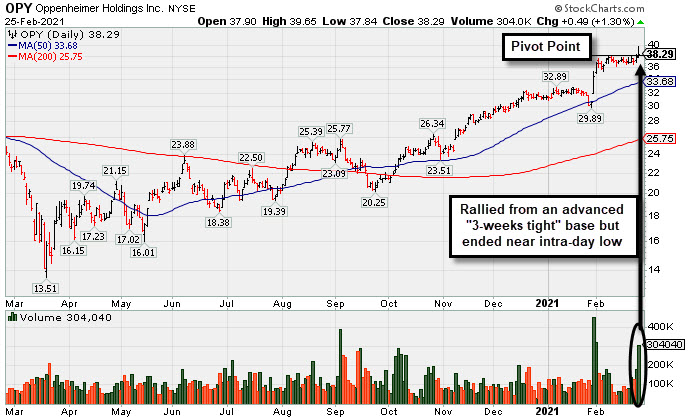
Rose From "3-weeks Tight" Base But Ended Near Session Low - Thursday, February 25, 2021
Oppenheimer Holdings Inc (OPY +$0.49 or +1.30% to $38.29) finished near the intra-day low after highlighted in yellow with pivot point cited based on its 2/05/21 high plus 10 cents in the earlier mid-day report (read here). It powered to new multi-year highs with volume-driven gains after an advanced "3-weeks tight" base.
OPY stubbornly held its ground since noted in the 2/05/21 mid-day report - "Reported Dec '20 quarterly earnings +235% on +43% sales revenues versus the year ago period. Showed strong earnings increases over the year ago period in the past 3 quarterly comparisons. Annual earnings (A criteria) growth has been strong after a downturn and losses in FY '15 & '16." It has the highest possible Earnings Per Share Rating of 99.
OPY stubbornly held its ground since noted in the 2/05/21 mid-day report - "Reported Dec '20 quarterly earnings +235% on +43% sales revenues versus the year ago period. Showed strong earnings increases over the year ago period in the past 3 quarterly comparisons. Annual earnings (A criteria) growth has been strong after a downturn and losses in FY '15 & '16." It has the highest possible Earnings Per Share Rating of 99.
The company hails from the FINANCIAL SERVICES - Investment Brokerage - Regional industry group which is now ranked 33rd on the 197 Industry Groups list(L criteria). There is a small supply of only 9 million shares in the publicly traded float (S criteria) which can contribute to greater price volatility in the event of institutional buying or selling. The number of top-rated funds owning its shares reported fell from 214 in Jun '2 to 199 in Dec '20, however, its current Up/Down Volume Ratio of 1.1 is an unbiased indication its shares have been under slight accumulation over the past 50 days (I criteria).
