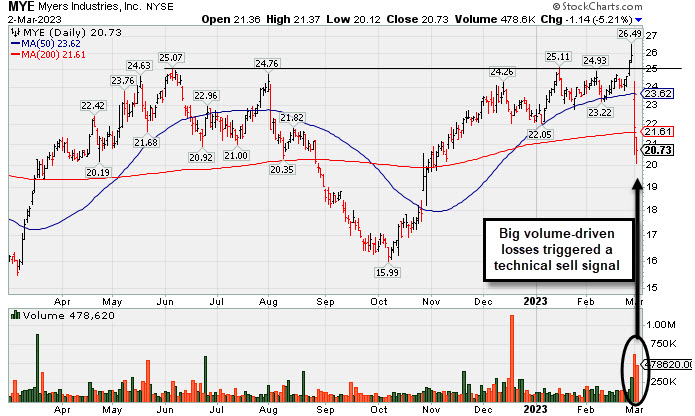
Damaging Losses Triggered Technical Sell Signals - Thursday, March 2, 2023
Myers Industries Inc (MYE -$1.14 or -5.21% to $20.73) suffered a 2nd consecutive volume-driven loss. earish action came after it reported Dec '22 quarterly earnings +39% on +7% sales revenues versus the year ago period. Volume and volatility often increase near earnings news. It violated its 50 DMA line ($23.62) triggering a technical sell signal and undercut its 200 DMA line ($21.87) as it gapped down on Wednesday, abruptly retreating after 4 consecutive gains reaching new 52-week and all-time highs. A prompt rebound above the 50 DMA line is needed for its outlook to improve.MYE was highlighted in yellow in the 12/08/22 mid-day report (read here). It was last covered in greater detail in the FSU section on 2/03/23 with an annotated graph under the headline, "Perched Near High After Finding Support at 50 DMA". It has a 96 Earnings Per Share Rating. The Sep '22 quarter showed +78% earnings on +14% sales revenues versus the year ago period. The past 4 quarterly comparisons were above the +25% minimum guideline (C criteria), however, its sales revenues growth rate has shown deceleration in sequential comparisons +45%, +29%, +24%, to +14%. Annual earnings (A criteria) history had a slight downturn in FY '19 but growth has been otherwise strong and steady.
It hails from the Containers/Packaging industry group which is now ranked 85th on the 197 Industry Groups list (L criteria). There are only 36.5 million shares outstanding (S criteria) which can contribute to greater price volatility in the event of institutional buying or selling. The number of top-rated funds owning its shares was 336 in Mar '22 and was reported at 346 as of Dec '22. Its current Up/Down Volume Ratio of 1.1 is an unbiased indication its shares have been nearly neutral concerning accumulation/distribution over the past 50 days (I criteria).
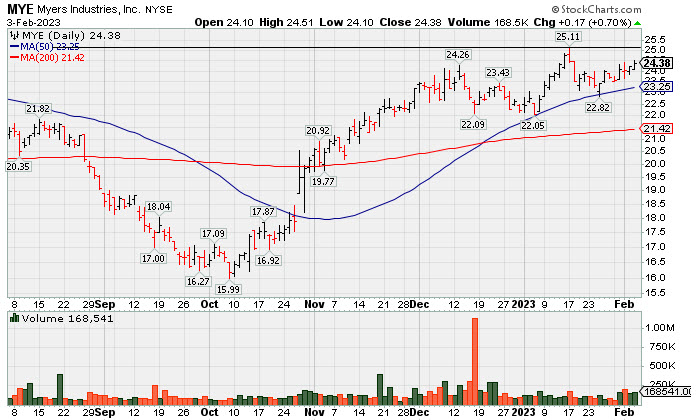
Perched Near High After Finding Support at 50 DMA - Friday, February 3, 2023
Myers Industries Inc (MYE +$0.17 or +0.70% to $24.38) found support while testing its 50-day moving average (DMA) line ($23.27) in recent weeks. It faces little resistance due to overhead supply up to the $25.50 level. Subsequent volume-driven gains for new highs would be a reassuring sign of fresh institutional buying demand that could lead to a more meaningful leg up.MYE was highlighted in yellow in the 12/08/22 mid-day report (read here). It was last covered in greater detail in the FSU section on 1/20/23 with an annotated graph under the headline, "Myers Quietly Consolidating Within Striking Distance of Prior High". It has a 97 Earnings Per Share Rating. The Sep '22 quarter showed +78% earnings on +14% sales revenues versus the year ago period. The past 4 quarterly comparisons were above the +25% minimum guideline (C criteria), however, its sales revenues growth rate has shown deceleration in sequential comparisons +45%, +29%, +24%, to +14%. Annual earnings (A criteria) history had a slight downturn in FY '19 but growth has been otherwise strong and steady.
It hails from the Containers/Packaging industry group which is now ranked 50th on the 197 Industry Groups list (L criteria). There are only 36.5 million shares outstanding (S criteria) which can contribute to greater price volatility in the event of institutional buying or selling. The number of top-rated funds owning its shares was 336 in Mar '22 and was reported at 343 as of Dec '22. Its current Up/Down Volume Ratio of 1.0 is an unbiased indication its shares have been neutral concerning accumulation/distribution over the past 50 days (I criteria).
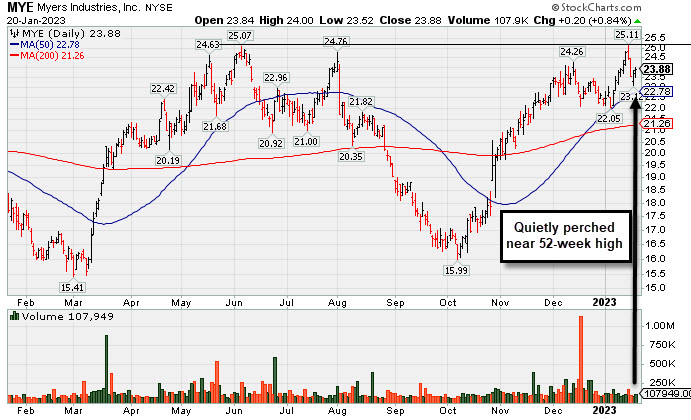
Myers Quietly Consolidating Within Striking Distance of Prior High - Friday, January 20, 2023
Myers Industries Inc (MYE +$0.20 or +0.84% to $23.88\) posted a small gain today with below average volume after it managed a "positive reversal" on the prior session . Its 50-day moving average (DMA) line ($22.82) defines near-term support to watch on pullbacks. It faces little resistance due to overhead supply up to the $25.50 level.MYE was highlighted in yellow in the 12/08/22 mid-day report (read here). It was last covered in greater detail in the FSU section on 1/05/23 with an annotated graph under the headline, "Pullback Testing 50-Day Moving Average Line". It has a 96 Earnings Per Share Rating. The Sep '22 quarter showed +78% earnings on +14% sales revenues versus the year ago period. The past 4 quarterly comparisons were above the +25% minimum guideline (C criteria), however, its sales revenues growth rate has shown deceleration in sequential comparisons +45%, +29%, +24%, to +14%. Annual earnings (A criteria) history had a slight downturn in FY '19 but growth has been otherwise strong and steady.
It hails from the Containers/Packaging industry group which is now ranked 47th on the 197 Industry Groups list (L criteria). There are only 36.5 million shares outstanding (S criteria) which can contribute to greater price volatility in the event of institutional buying or selling. The number of top-rated funds owning its shares was 336 in Mar '22 and was reported at 336 as of Dec '22. Its current Up/Down Volume Ratio of 1.0 is an unbiased indication its shares have been neutral concerning accumulation/distribution over the past 50 days (I criteria).
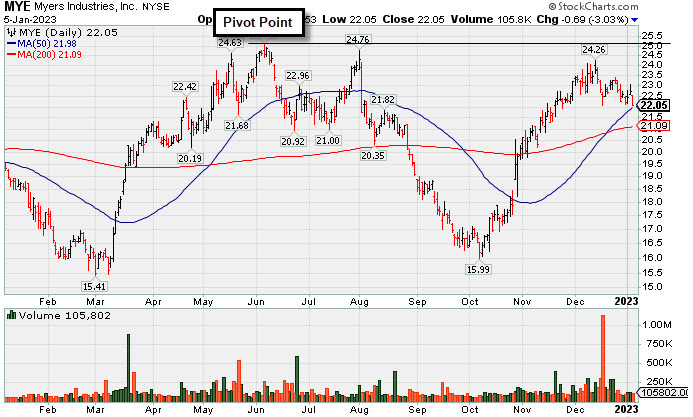
Pullback Testing 50-Day Moving Average Line - Thursday, January 5, 2023
Myers Industries Inc (MYE -$0.69 or -3.03% to $22.05) lost ground today with below average volume while testing its 50-day moving average (DMA) line ($22.04). More damaging losses would trigger a technical sell signal. Still faces resistance due to overhead supply up to the $25.50 level.
MYE was highlighted in yellow in the 12/08/22 mid-day report (read here) and covered in greater detail that evening with an annotated graph under the headline, "Myers Industries on Track for 9th Straight Weekly Gain". It has a 96 Earnings Per Share Rating. The Sep '22 quarter showed +78% earnings on +14% sales revenues versus the year ago period. The past 4 quarterly comparisons were above the +25% minimum guideline (C criteria), however, its sales revenues growth rate has shown deceleration in sequential comparisons +45%, +29%, +24%, to +14%. Annual earnings (A criteria) history had a slight downturn in FY '19 but growth has been otherwise strong and steady.
It hails from the Containers/Packaging industry group which is now ranked 26th on the 197 Industry Groups list (L criteria). There are only 36.5 million shares outstanding (S criteria) which can contribute to greater price volatility in the event of institutional buying or selling. The number of top-rated funds owning its shares was 336 in Mar '22 and was reported at 335 as of Dec '22. Its current Up/Down Volume Ratio of 1.1 is an unbiased indication its shares have been under slight accumulation over the past 50 days (I criteria).
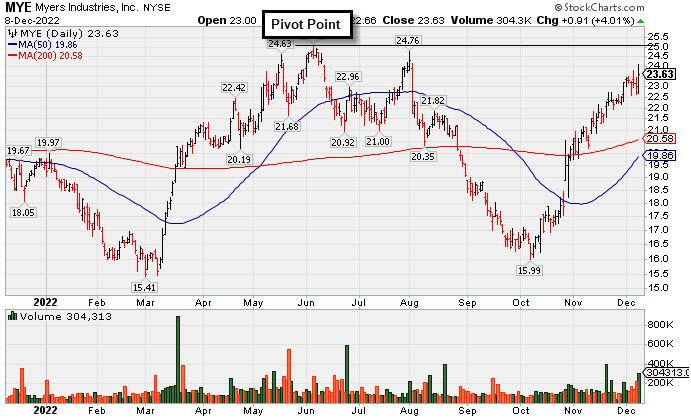
Myers Industries on Track for 9th Straight Weekly Gain - Thursday, December 8, 2022
Myers Industries Inc (MYE +$0.91 or +4.01% to $23.63) posted a solid gain today with +157% above average volume. It was highlighted in yellow in the earlier mid-day report (read here). Subsequent gains above the pivot point backed by at least +40% above average volume may trigger a technical buy signal. It is on track for its 9th consecutive weekly gain.
The Sep '22 quarter showed +78% earnings on +14% sales revenues versus the year ago period. The past 4 quarterly comparisons were above the +25% minimum guideline (C criteria), however, its sales revenues growth rate has shown deceleration in sequential comparisons +45%, +29%, +24%, to +14%. Annual earnings (A criteria) history had a slight downturn in FY '19 but growth has been otherwise strong and steady.
It hails from the Containers/Packaging industry group which is now ranked 34th on the 197 Industry Groups list (L criteria). There are only 36.5 million shares outstanding (S criteria) which can contribute to greater price volatility in the event of institutional buying or selling. The number of top-rated funds owning its shares was 140 in Dec '21 and was reported at 335 as of Sep '22. However, its current Up/Down Volume Ratio of 1.6 is an unbiased indication its shares have been under accumulation over the past 50 days (I criteria).