Gain With Heavy Volume Triggered Technical Buy Signal - Friday, April 13, 2018
Lemaitre Vascular Inc (LMAT -$0.43 or -1.06% to $40.25) triggered a technical buy signal on 4/11/18 as it posted a solid gain with +87% above average volume, rising above the new pivot point cited based on its 10/20/17 high plus 10 cents. It found support recently near its 50-day moving average (DMA) line ($36.17).
LMAT was highlighted again in yellow with new pivot point cited based on its 10/20/17 high plus 10 cents in the 3/19/18 mid-day report (read here). Fundamentals remain strong, as it reported +62% earnings on +12% sales revenues for the Dec '17 quarter. The past 4 quarterly comparisons were above the +25% minimum guideline (C criteria), a reassuring sign.
The high-ranked Medical - Products firm currently has an A Timeliness rating and a C Sponsorship rating. It was last shown in this FSU section on 3/19/18 with an annotated graph under the headline, "Rebounding Near High After Choppy Consolidation".
Its current Up/Down Volume ratio of 1.0 is an unbiased indication that its shares have been neutral concerning accumulation/distribution over the past 50 days. The number of top-rated funds owning its share rose from 184 in Dec '15 to 288 in Dec '17, a reassuring sign concerning the I criteria. Its small supply of 14.7 million shares (S criteria) in the public float can contribute to greater price volatility in the event of institutional buying or selling.
Charts used courtesy of www.stockcharts.com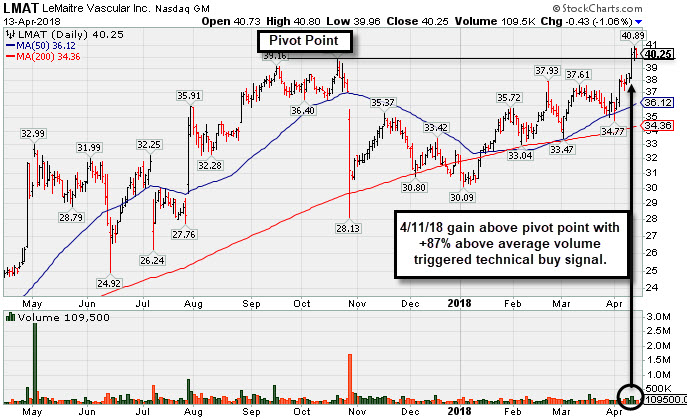
Rebounding Near High After Choppy Consolidation - Monday, March 19, 2018
Lemaitre Vascular Inc (LMAT -$0.15 or -0.41% to $36.57) was highlighted again in yellow with new pivot point cited based on its 10/20/17 high plus 10 cents in the earlier mid-day report (read here). Subsequent volume-driven gains for new highs are needed to trigger a technical buy signal. Fundamentals remain strong, as it reported +62% earnings on +12% sales revenues for the Dec '17 quarter. The past 4 quarterly comparisons were above the +25% minimum guideline (C criteria), a reassuring sign.
The high-ranked Medical - Products firm has recently been consolidating above its 50 and 200 DMA lines. It was dropped from the Featured Stocks list on 12/04/17. Weak action triggering a technical sell signal came immediately after it reported Sep '17 quarterly earnings +47% on +7%
It currently has an A Timeliness Rating and a C Sponsorship rating. It was last shown in this FSU section on 11/15/17 with an annotated graph under the headline, "Halted Slide After Damaging 50-Day Moving Average Breach ".
Its current Up/Down Volume ratio of 1.2 is an unbiased indication that its shares were under slight accumulation over the past 50 days. The number of top-rated funds owning its share rose from 184 in Dec '15 to 288 in Dec '17, a reassuring sign concerning the I criteria. Its small supply of 14.7 million shares (S criteria) in the public float can contribute to greater price volatility in the event of institutional buying or selling.
Charts used courtesy of www.stockcharts.com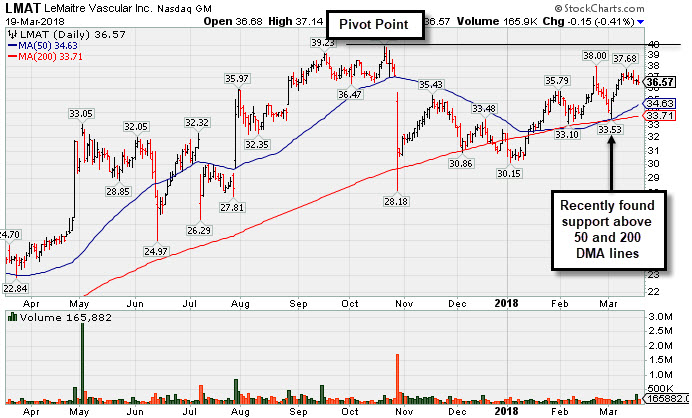
Halted Slide After Damaging 50-Day Moving Average Breach - Wednesday, November 15, 2017
Lemaitre Vascular Inc's (LMAT +$0.16 or +0.47% to $34.44) Relative Strength rating has improved to 85, above the 80+ minimum guideline for buy candidates. A rebound above the 50-day moving average (DMA) line ($36.39) is still needed for its outlook to improve. Subsequent losses below the 200 DMA line and recent low would raise greater concerns. Disciplined investors avoid chasing extended stocks more than +5% above prior highs, and they always limit losses by selling any stock that falls more than -7% from their purchase price.
LMAT currently has a B Timeliness Rating and a C Sponsorship rating. It was last shown in this FSU section on 10/18/17 with an annotated graph under the headline, "Consolidating Above 50-Day Moving Average Before Earnings". Weak action triggering a technical sell signal came immediately after it reported Sep '17 quarterly earnings +47% on +7% sales revenues. The past 3 quarterly comparisons were above the +25% minimum guideline (C criteria), however, a reassuring sign.
The high-ranked Medical - Products firm was first highlighted in yellow with a pivot point based on its 9/20/16 high plus 10 cents in the 10/27/16 mid-day report (read here). More recently, it was highlighted in yellow in the 7/28/17 mid-day report (read here) with new pivot point cited based on its 5/02/17 high plus 10 cents.
Its current Up/Down Volume ratio of 1.1 is an unbiased indication that its shares were only under slight accumulation over the past 50 days. The number of top-rated funds owning its share rose from 184 in Dec '15 to 280 in Sep '17, a reassuring sign concerning the I criteria. Its small supply of 14.6 million shares (S criteria) in the public float can contribute to greater price volatility in the event of institutional buying or selling.
Charts used courtesy of www.stockcharts.com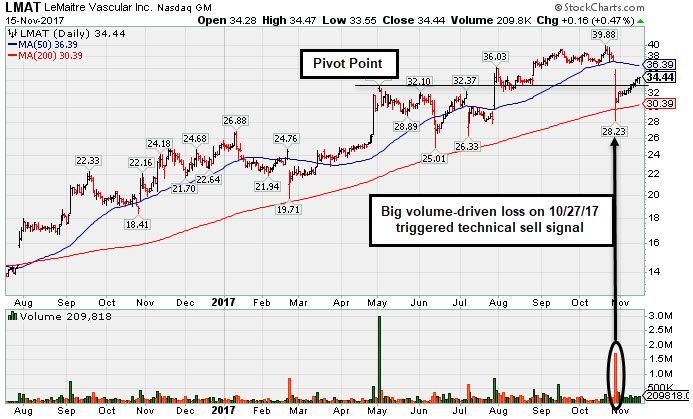
Consolidating Above 50-Day Moving Average Before Earnings - Wednesday, October 18, 2017
Lemaitre Vascular Inc (LMAT +$1.12 or +3.02% to $38.21) is consolidating above support at its 50-day moving average (DMA) line ($36.60) and prior highs in the $36 area. Violations would raise concerns and trigger technical sell signals. It is due to report Sep '17 quarterly results on Thursday, 10/26/17 after the market closes. Volume and volatility often increase near earnings news. It reported earnings +64% on +15% sales revenues for the Jun '17 quarter. Three of the past four quarterly comparisons were above the +25% minimum guideline (C criteria).
Disciplined investors avoid chasing extended stocks more than +5% above prior highs, and they always limit losses by selling any stock that falls more than -7% from their purchase price. Patient investors may watch for a new base or secondary buy point to possibly develop and be noted in the weeks ahead.
LMAT was last shown in this FSU section on 9/22/17 with an annotated graph under the headline. "Quietly Pulling Back From High After More Volume-Driven Gains". The high-ranked Medical - Products firm was first highlighted in yellow with a pivot point based on its 9/20/16 high plus 10 cents in the 10/27/16 mid-day report (read here). More recently, it was highlighted in yellow in the 7/28/17 mid-day report (read here) with new pivot point cited based on its 5/02/17 high plus 10 cents.
Its current Up/Down Volume ratio of 1.4 is an unbiased indication that its shares were under some accumulation over the past 50 days. The number of top-rated funds owning its share rose from 184 in Dec '15 to 275 in Sep '17, a reassuring sign concerning the I criteria. Its small supply of 14.5 million shares (S criteria) in the public float can contribute to greater price volatility in the event of institutional buying or selling.
Charts used courtesy of www.stockcharts.com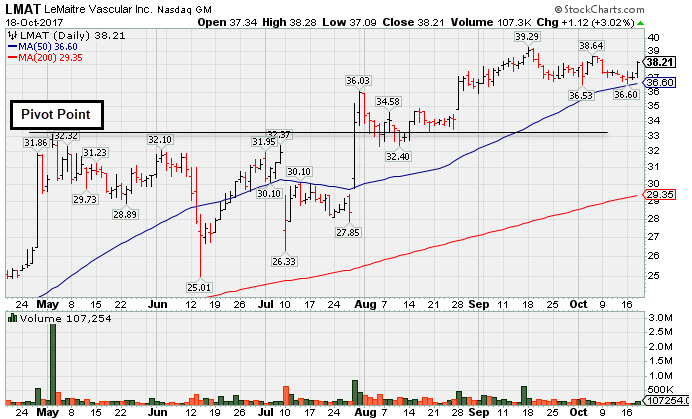
Quietly Pulling Back From High After More Volume-Driven Gains - Friday, September 22, 2017
Lemaitre Vascular Inc (LMAT -$0.04 or -0.11% to $37.25) has been quietly pulling back from its all-time high following a gain on 9/15/17 backed by above average volume. The 50-day moving average (DMA) line ($34.31) defines near-term support to watch above prior highs in the $33 area. Disciplined investors avoid chasing extended stocks more than +5% above prior highs, and they always limit losses by selling any stock that falls more than -7% from their purchase price. Patient investors may watch for a new base or secondary buy point to possibly develop and be noted in the weeks ahead.
LMAT was highlighted in yellow in the 7/28/17 mid-day report (read here) with new pivot point cited based on its 5/02/17 high plus 10 cents. It triggered a technical buy signal as it powered to a new all-time high after gapping up for a big volume-driven gain following earnings news. It reported earnings +64% on +15% sales revenues for the Jun '17 quarter, Three of the past four quarterly comparisons were above the +25% minimum guideline (C criteria).
LMAT was last shown in this FSU section on 8/28/17 with an annotated graph under the headline. "Volume-Driven Gain for New High And Strong Finish Bode Well". The high-ranked Medical - Products firm was first highlighted in yellow with a pivot point based on its 9/20/16 high plus 10 cents in the 10/27/16 mid-day report (read here).
Its current Up/Down Volume ratio of 1.4 is an unbiased indication that its shares were under some accumulation over the past 50 days. The number of top-rated funds owning its share rose from 184 in Dec '15 to 254 in Jun '17, a reassuring sign concerning the I criteria. Its small supply of 14.5 million shares (S criteria) in the public float can contribute to greater price volatility in the event of institutional buying or selling.
Charts used courtesy of www.stockcharts.com
Volume-Driven Gain for New High And Strong Finish Bode Well - Monday, August 28, 2017
Lemaitre Vascular Inc (LMAT +$2.72 or +7.98% to $36.79) gapped up today and rallied with +134% above average volume hitting another new all-time high after a brief consolidation. Its color code was changed to green after rising more than +5% above the previous pivot point cited. The finish in the upper third of its intra-day session range bodes very well for the near term, whereas a weak finish would have been an indication it was encountering prompt distributional pressure when hitting new highs.
Disciplined investors avoid chasing extended stocks more than +5% above prior highs, and they always limit losses by selling any stock that falls more than -7% from their purchase price. LMAT was highlighted in yellow in the 7/28/17 mid-day report (read here) with new pivot point cited based on its 5/02/17 high plus 10 cents. It triggered a technical buy signal as it powered to a new all-time high after gapping up for a big volume-driven gain following earnings news. It reported earnings +64% on +15% sales revenues for the Jun '17 quarter, Three of the past four quarterly comparisons were above the +25% minimum guideline (C criteria).
Disciplined investors avoid chasing extended stocks more than +5% above prior highs, and they always limit losses by selling any stock that falls more than -7% from their purchase price. LMAT was highlighted in yellow in the 7/28/17 mid-day report (read here) with new pivot point cited based on its 5/02/17 high plus 10 cents. It triggered a technical buy signal as it powered to a new all-time high after gapping up for a big volume-driven gain following earnings news. It reported earnings +64% on +15% sales revenues for the Jun '17 quarter, Three of the past four quarterly comparisons were above the +25% minimum guideline (C criteria).
LMAT was last shown in this FSU section on 7/28/17 with an annotated graph under the headline, "Big Volume-Driven Gain Following Strong Earnings News". The high-ranked Medical - Products firm was first highlighted in yellow with a pivot point based on its 9/20/16 high plus 10 cents in the 10/27/16 mid-day report (read here).
Its current Up/Down Volume ratio of 1.2 is an unbiased indication that its shares were under some accumulation over the past 50 days. The number of top-rated funds owning its share rose from 184 in Dec '15 to 249 in Jun '17, a reassuring sign concerning the I criteria. Its small supply of 14.5 million shares (S criteria) in the public float can contribute to greater price volatility in the event of institutional buying or selling.
Charts used courtesy of www.stockcharts.com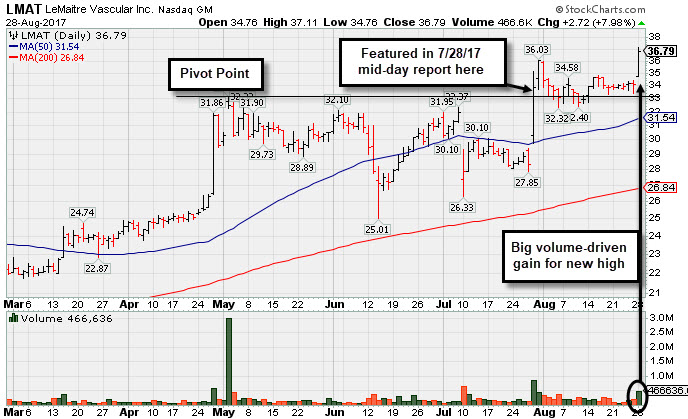
Big Volume-Driven Gain Following Strong Earnings News - Friday, July 28, 2017
Lemaitre Vascular Inc (LMAT +$5.54 or +19.51% to $33.94) was highlighted in yellow in the earlier mid-day report (read here) with new pivot point cited based on its 5/02/17 high plus 10 cents. It triggered a technical buy signal as it powered to a new all-time high after gapping up for a big volume-driven gain following earnings news. It reported earnings +64% on +15% sales revenues for the Jun '17 quarter, Three of the past four quarterly comparisons were above the +25% minimum guideline (C criteria).
LMAT was last shown in this FSU section on 2/24/17 with an annotated graph under the headline, "Fundamental and Technical Deterioration Raised Concerns". The high-ranked Medical - Products firm was first highlighted in yellow with a pivot point based on its 9/20/16 high plus 10 cents in the 10/27/16 mid-day report (read here).
Its current Up/Down Volume ratio of 1.3 is an unbiased indication that its shares were under distributional pressure over the past 50 days. The number of top-rated funds owning its share rose from 184 in Dec '15 to 239 in Jun '17, a reassuring sign concerning the I criteria. Its small supply of 14.3 million shares (S criteria) in the public float can contribute to greater price volatility in the event of institutional buying or selling.
Charts used courtesy of www.stockcharts.com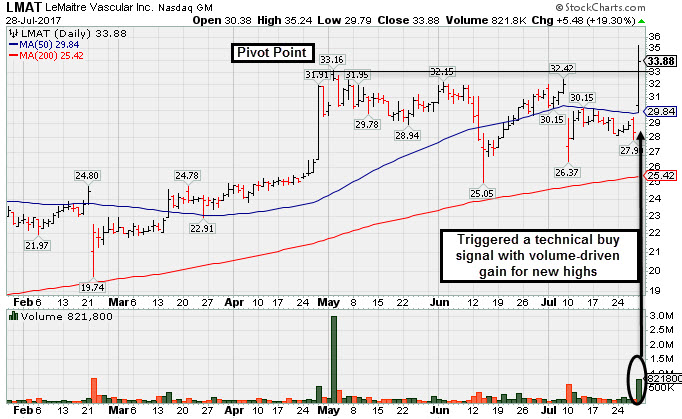
Fundamental and Technical Deterioration Raised Concerns - Friday, February 24, 2017
Lemaitre Vascular Inc (LMAT +$0.27 or +1.23% to $22.17) held its ground on Friday. Technical and fundamental deterioration have been noted, however, and it will be dropped from the Featured Stocks list tonight. It gapped down on 2/22/17 for a damaging loss after reporting earnings +0% on +14% sales revenues for the Dec '16 quarter, below the +25% minimum guideline (C criteria), raising fundamental concerns.
LMAT was last shown in this FSU section on 1/27/17 with an annotated graph under the headline, "Concerns Increase While Lingering Below 50-Day Moving Average". It stalled soon after a gain for new highs on 1/10/17 was backed by +46% above average volume, just above the minimum of +40% above average volume needed to trigger a proper technical buy signal. Although no resistance remained due to overhead supply, the stock immediately encountered some distributional pressure and slumped back into its prior base, raising concerns.
The high-ranked Medical - Products firm was first highlighted in yellow with a pivot point based on its 9/20/16 high plus 10 cents in the 10/27/16 mid-day report (read here). Its current Up/Down Volume ratio of 0.7 is an unbiased indication that its shares were under distributional pressure over the past 50 days. The number of top-rated funds owning its share rose from 184 in Dec '15 to 201 in Dec '16, a reassuring sign concerning the I criteria. Its small supply of 13.2 million shares (S criteria) in the public float can contribute to greater price volatility in the event of institutional buying or selling.
Charts used courtesy of www.stockcharts.com
Concerns Increase While Lingering Below 50-Day Moving Average - Friday, January 27, 2017
Lemaitre Vascular Inc (LMAT +$0.28 or +1.21% to $23.42) has seen volume totals cooling for the past 2 weeks. However, the longer it lingers below its 50-day moving average (DMA) line the worse its outlook gets. A rebound above its 50 DMA line ($23.98) is needed for its outlook to improve.
LMAT was last shown in this FSU section on 12/23/16 with an annotated graph under the headline, " Built an Orderly Base-On-Base Pattern". A new pivot point was cited based on its 11/17/16 high plus 10 cents after an orderly base-on-base pattern. Its subsequent gain for new highs on 1/10/17 was backed by +46% above average volume, just above the minimum of +40% above average volume needed to trigger a proper technical buy signal.
Although no resistance remained due to overhead supply, the stock immediately encountered some distributional pressure and slumped back into its prior base raising concerns.
The high-ranked Medical - Products firm was first highlighted in yellow with a pivot point based on its 9/20/16 high plus 10 cents in the 10/27/16 mid-day report (read here). It recently reported earnings +55% on +22% sales revenues for the Sep '16 quarter, marking its 3rd consecutive quarter above the +25% minimum earnings guideline (C criteria), helping it better match the fact-based investment system's fundamental guidelines. Earnings rose +18%, +38%, +40% and +55% in the Dec '15, Mar, Jun, and Sep '16 quarters, respectively, demonstrating encouraging sales revenues and earnings acceleration. Sales revenues rose +10%, +7%, +13% and +20% over that same span. Annual earnings (A criteria) history has been steadily improving since a downturn in FY '11.
Its current Up/Down Volume ratio of 0.9 is an unbiased indication that its shares were under slight distributional pressure over the past 50 days. The number of top-rated funds owning its share rose from 184 in Dec '15 to 202 in Dec '16, a reassuring sign concerning the I criteria. Its small supply of 13.2 million shares (S criteria) in the public float can contribute to greater price volatility in the event of institutional buying or selling.
Charts used courtesy of www.stockcharts.com
Built an Orderly Base-On-Base Pattern - Friday, December 23, 2016
Lemaitre Vascular Inc (LMAT +$0.01 or +0.04% to $24.30) held its ground with volume light today. While poised to breakout it met resistance yesterday and finished in the middle of its intra-day range. A new pivot point was cited based on its 11/17/16 high plus 10 cents after an orderly base-on-base pattern. It was noted - "A volume-driven gain and strong close above the pivot point may clinch a new (or add-on) technical buy signal." Subsequent gains for new highs should be backed by at least +40% above average volume to trigger a proper technical buy signal.
Recent lows in the $22 area and its 50-day moving average (DMA) line ($22.39) coincide defining important support to watch on pullbacks. It made limited progress after its 11/09/16 technical breakout. No resistance remains due to overhead supply. LMAT was last shown in this FSU section on 11/25/16 with an annotated graph under the headline, "Perched Near Highs Following Recent Technical Breakout". It was first highlighted in yellow with pivot point cited based on its 9/20/16 high plus 10 cents in the 10/27/16 mid-day report (read here).
The high-ranked Medical - Products firm recently reported earnings +55% on +22% sales revenues for the Sep '16 quarter, marking its 3rd consecutive quarter above the +25% minimum earnings guideline (C criteria), helping it better match the fact-based investment system's fundamental guidelines. Earnings rose +18%, +38%, +40% and +55% in the Dec '15, Mar, Jun, and Sep '16 quarters, respectively, demonstrating encouraging sales revenues and earnings acceleration. Sales revenues rose +10%, +7%, +13% and +20% over that same span. Annual earnings (A criteria) history has been steadily improving since a downturn in FY '11.
Its current Up/Down Volume ratio of 1.3 is an unbiased indication that its shares were under accumulation over the past 50 days, a reassuring sign concerning the I criteria. The number of top-rated funds owning its share rose from 184 in Dec '15 to 198 in Sep '16. Its small supply of 13.2 million shares (S criteria) in the public float can contribute to greater price volatility in the event of institutional buying or selling.
Charts used courtesy of www.stockcharts.com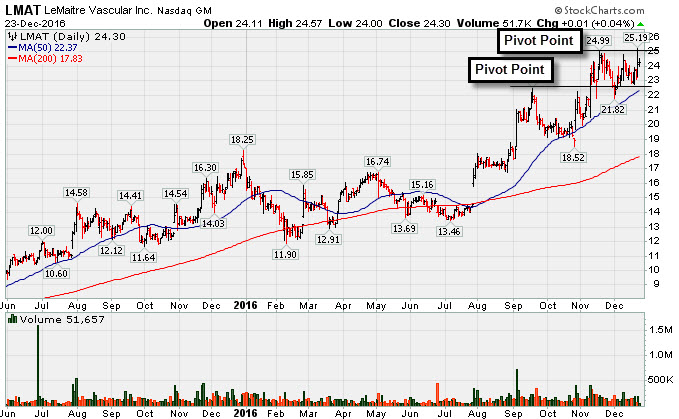
Perched Near Highs Following Recent Technical Breakout - Friday, November 25, 2016
Lemaitre Vascular Inc (LMAT -$0.15 or -0.62% to $24.09) remains perched near its all-time high while consolidating above its "max buy" level. It found support near prior highs in the $22 area when pulling back after its 11/09/16 technical breakout. No resistance remains due to overhead supply. It was last shown in this FSU section on 11/09/16 with an annotated graph under the headline, "Technical Breakout Backed By +151% Above Average Volume ". It was first highlighted in yellow with pivot point cited based on its 9/20/16 high plus 10 cents in the 10/27/16 mid-day report (read here).
The high-ranked Medical - Products firm recently reported earnings +55% on +22% sales revenues for the Sep '16 quarter, marking its 3rd consecutive quarter above the +25% minimum earnings guideline (C criteria), helping it better match the fact-based investment system's fundamental guidelines. Earnings rose +18%, +38%, +40% and +55% in the Dec '15, Mar, Jun, and Sep '16 quarters, respectively, demonstrating encouraging sales revenues and earnings acceleration. Sales revenues rose +10%, +7%, +13% and +20% over that same span. Annual earnings (A criteria) history has been steadily improving since a downturn in FY '11.
Its current Up/Down Volume ratio of 1.4 is an unbiased indication that its shares were under accumulation over the past 50 days, a reassuring sign concerning the I criteria. The number of top-rated funds owning its share rose from 184 in Dec '15 to 197 in Sep '16. Its small supply of 13.1 million shares (S criteria) in the public float can contribute to greater price volatility in the event of institutional buying or selling.
Charts used courtesy of www.stockcharts.com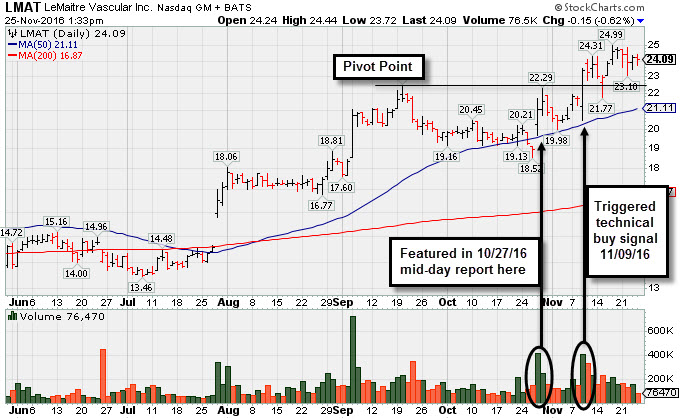
Technical Breakout Backed By +151% Above Average Volume - Wednesday, November 9, 2016
Lemaitre Vascular Inc (LMAT +$1.66 or +7.63% to $23.43) triggered a technical buy signal with today's considerable gain for a new high backed by +151% above average volume. No resistance remains due to overhead supply. It was last shown in this FSU section on 10/27/16 with an annotated graph under the headline, "Challenged 52-Week High With Gap Up and Volume-Driven Gain", after highlighted in yellow with pivot point cited based on its 9/20/16 high plus 10 cents in the earlier mid-day report (read here).
The high-ranked Medical - Products form found support above prior highs in the $18 area during its quiet consolidation. LMAT recently reported earnings +55% on +22% sales revenues for the Sep '16 quarter, marking its 3rd consecutive quarter above the +25% minimum earnings guideline (C criteria), helping it better match the fact-based investment system's fundamental guidelines. Earnings rose +18%, +38%, +40% and +55% in the Dec '15, Mar, Jun, and Sep '16 quarters, respectively, demonstrating encouraging sales revenues and earnings acceleration. Sales revenues rose +10%, +7%, +13% and +20% over that same span. Annual earnings (A criteria) history has been steadily improving since a downturn in FY '11.
Its current Up/Down Volume ratio of 1.5 is an unbiased indication that its shares were under accumulation over the past 50 days, a reassuring sign concerning the I criteria. The number of top-rated funds owning its share rose from 184 in Dec '15 to 199 in Sep '16. Its small supply of 13.1 million shares (S criteria) in the public float can contribute to greater price volatility in the event of institutional buying or selling.
Charts used courtesy of www.stockcharts.com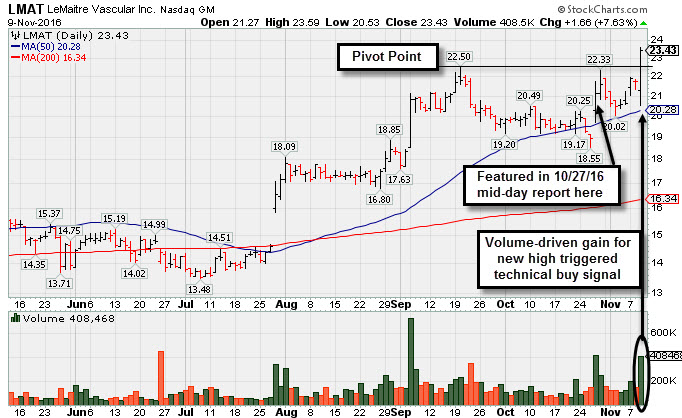
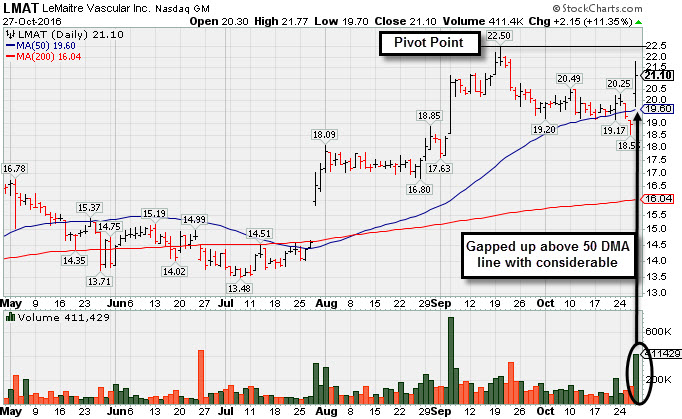
Challenged 52-Week High With Gap Up and Volume-Driven Gain - Thursday, October 27, 2016
Lemaitre Vascular Inc (LMAT +$2.16 or +11.40% to $21.11) was highlighted in yellow with pivot point cited based on its 9/20/16 high plus 10 cents in the earlier mid-day report (read here). It gapped up today, rebounding above its 50-day moving average (DMA) line to challenge its all-time highs. The high-ranked Medical - Products form found support above prior highs in the $18 area during its quiet consolidation and little resistance remains due to overhead supply. Subsequent volume-driven gains for new highs may trigger a technical buy signal following its base-on-base pattern.
Volume and volatility often increase near earnings news. LMAT just reported earnings +55% on +22% sales revenues for the Sep '16 quarter, marking its 3rd consecutive quarter above the +25% minimum earnings guideline (C criteria), helping it better match the fact-based investment system's fundamental guidelines. Earnings rose +18%, +38%, +40% and +55% in the Dec '15, Mar, Jun, and Sep '16 quarters, respectively, demonstrating encouraging sales revenues and earnings acceleration. Sales revenues rose +10%, +7%, +13% and +20% over that same span. Annual earnings (A criteria) history has been steadily improving since a downturn in FY '11.
Its current Up/Down Volume ratio of 1.6 is an unbiased indication that its shares were under accumulation over the past 50 days, a reassuring sign concerning the I criteria. The number of top-rated funds owning its share rose from 184 in Dec '15 to 196 in Sep '16. Its small supply of 13.1 million shares (S criteria) in the public float can contribute to greater price volatility in the event of institutional buying or selling.
Charts used courtesy of www.stockcharts.com