In Tight Range Near All-Time High With Volume Totals Cooling - Wednesday, July 12, 2017
Perched at All Time High Following Volume-Driven Gains - Wednesday, May 31, 2017
Wedging Higher With Recent Gains Lacking Great Volume - Monday, May 1, 2017
Best Ever Close For High-Ranked Medical Product Maker - Friday, March 31, 2017
Formed Orderly Base With Earnings News Due After Tuesday's Close - Monday, February 27, 2017
Rebound Above 50-Day Moving Average Line Helped Outlook - Thursday, October 20, 2016
Stubbornly Holding Ground Near All-Time High - Monday, September 12, 2016
Perched Within Striking Distance of Highs Following Rebound - Friday, August 5, 2016
Slumping Further After Recent Sell Signal Triggered - Wednesday, October 14, 2015
Met Resistance at 50-Day Moving Average Following Violation - Thursday, October 1, 2015
Another New High Close For Medical Products Firm - Wednesday, September 16, 2015
Further Volume-Driven Gains Into New High Territory - Wednesday, September 9, 2015
Found Support at 50-day Average Following Breakout - Monday, August 31, 2015
Finished Strong With Volume-Driven Breakout Gain - Wednesday, August 12, 2015
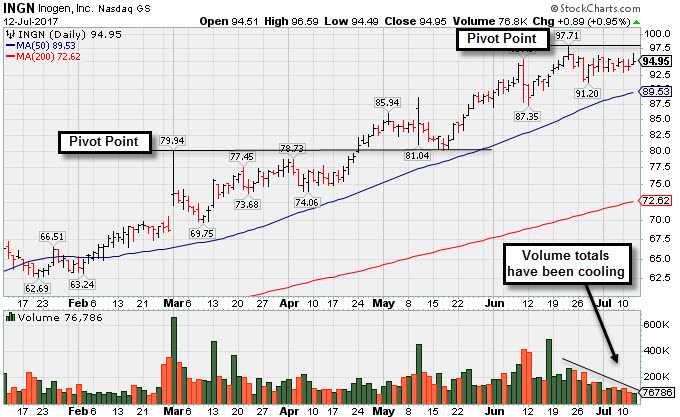
In Tight Range Near All-Time High With Volume Totals Cooling - Wednesday, July 12, 2017
Inogen Inc (INGN +$0.89 or +0.95% to $94.95) is perched near its all-time high, stubbornly holding its ground with volume totals cooling in recent weeks. Near-term support is its 50-day moving average (DMA) line ($89.53). It has formed an advanced "3-weeks tight" base. Its color code is changed to yellow with new pivot point cited based on its 6/22/17 high plus 10 cents. Subsequent volume-driven gains for new highs mat trigger a new (or add-on) technical buy signal.
Fundamentals remain strong and it has earned the highest possible Earnings Per Share Rating of 99. It reported Mar '17 quarterly earnings +125% on +22% sales revenues. The past six quarterly earnings increases versus the year-ago periods were above the +25% minimum guideline (C criteria). Its annual earnings (A criteria) history has been very strong since the high ranked Medical - Products firm completed a new Public Offering in February 2014.
INGN was most recently highlighted in yellow on 4/17/17 as a new pivot point was cited based on its 3/01/17 high plus 10 cents. It was last shown in this FSU section on 5/31/17 with an annotated graph under the headline, "Perched at All Time High Following Volume-Driven Gains".
The number of top-rated funds owning its shares rose from 318 in Jun '16 to 340 in Mar '17, a reassuring sign concerning the I criteria. The current Up/Down Volume Ratio of 1.5 is an unbiased indication its shares have been under accumulation over the past 50 days. It has a fairly small supply of only 20.6 million shares (S criteria) outstanding, which can contribute to greater price volatility in the event of institutional buying or selling.
Perched at All Time High Following Volume-Driven Gains - Wednesday, May 31, 2017
Inogen Inc (INGN -$0.25 or -0.28% to $88.64) traded lighter volume today while hovering near its all-time high. No resistance remains due to overhead supply. Disciplined investors avoid chasing extended stocks. Prior highs in the $79 area define support along with its 50-day moving average (DMA) line ($80.60).
Fundamentals remain strong and it has earned the highest possible Earnings Per Share Rating of 99. It reported Mar '17 quarterly earnings +45% on +39% sales revenues. Three of the past four quarterly earnings were above the +25% minimum guideline (C criteria). Its annual earnings (A criteria) history has been very strong since the high ranked Internet Content firm completed a new Public Offering on 9/03/14.
INGN was last shown in this FSU section on 5/01/17 with an annotated graph under the headline, "Wedging Higher With Recent Gains Lacking Great Volume". It was highlighted in yellow with pivot point cited based on its 9/29/16 high plus 10 cents in the 4/28/17 mid-day report (read here).
The number of top-rated funds owning its shares rose from 318 in Jun '16 to 344 in Mar '17, a reassuring sign concerning the I criteria. The current Up/Down Volume Ratio of 1.7 is an unbiased indication its shares have been under accumulation over the past 50 days. It has a fairly small supply of only 20.6 million shares (S criteria) outstanding, which can contribute to greater price volatility in the event of institutional buying or selling.
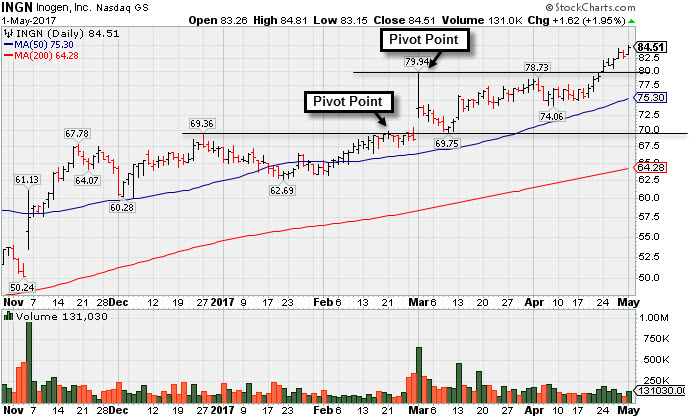
Wedging Higher With Recent Gains Lacking Great Volume - Monday, May 1, 2017
Inogen Inc (INGN +$1.62 or +1.95%to $84.51) hit a new all-time high with today's gain on below average volume, edging further above its "max buy" level. Disciplined investors avoid chasing extended stocks. No resistance remains due to overhead supply. Recent gains above the pivot point lacked the minimum +40% above average volume needed to trigger a proper new (or add-on) technical buy signal. Its 50-day moving average (DMA) line ($75.30) defines near-term support to watch on pullbacks.
INGN was last shown in this FSU section on 3/31/17 with an annotated graph under the headline, "Best Ever Close For High-Ranked Medical Product Maker". It was highlighted in yellow with pivot point cited based on its 9/29/16 high plus 10 cents in the earlier mid-day report (read here).
It reported Mar '17 quarterly earnings +45% on +39% sales revenues. Three of the past four quarterly earnings were above the +25% minimum guideline (C criteria). Its annual earnings (A criteria) history has been very strong since the high ranked Internet Content firm completed a new Public Offering on 9/03/14.
The number of top-rated funds owning its shares rose from 318 in Jun '16 to 334 in Mar '17, a reassuring sign concerning the I criteria. The current Up/Down Volume Ratio of 1.5 is an unbiased indication its shares have been under accumulation over the past 50 days. It has a fairly small supply of only 20.6 million shares (S criteria) outstanding, which can contribute to greater price volatility in the event of institutional buying or selling.
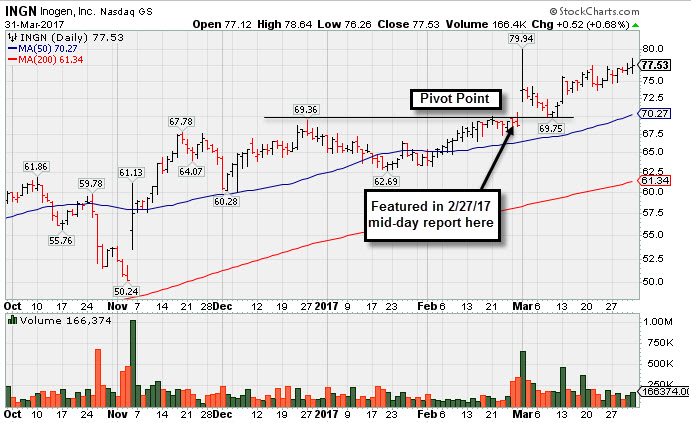
Best Ever Close For High-Ranked Medical Product Maker - Friday, March 31, 2017
Inogen Inc (INGN +$0.55 or +0.71% to $77.56) inched higher with average volume today for a best-ever close. It has been stubbornly holding its ground and making steady progress near its all-time high. Its 50-day moving average (DMA) line ($70.27) and prior highs in the $69 area define important near-term support to watch on pullbacks. The company reported earnings +70% on +26% sales revenues for the Dec'16 quarter, and the stock's reaction to the news was a big gap up and volume-driven gain on 3/01/17 for new highs.
INGN was highlighted in yellow with pivot point cited based on its 2/21/17 high in the mid-day report (read here), perched near all-time highs after a saucer-with-handle base. In this FSU section on 2/27/17 an annotated graph was included under the headline, "Formed Orderly Base With Earnings News Due After Tuesday's Close", just ahead of its earnings announcement. It was noted - "Subsequent volume-driven gains for new highs coupled with strong earnings may clinch a technical buy signal. Reported earnings +23% on +33% sales revenues for the Sep '16 quarter, slightly below the +25% minimum guideline. Due to report Dec '16 earnings news on 2/28/17, and volume and volatility often increase near earnings news. Rebounded and made gradual progress since dropped from the Featured Stocks list on 10/27/16."
INGN currently has an A Timeliness Rating and a B Sponsorship Rating. Its current Up/Down Volume ratio of 1.5 is an unbiased indication that its shares were under accumulation over the past 50 days. The number of top-rated funds owning its share rose from 302 in Mar '16 to 339 in Dec '16, a reassuring sign concerning the I criteria. Its small supply of 15.6 million shares (S criteria) in the public float can contribute to greater price volatility in the event of institutional buying or selling.
The high-ranked Medical - Products firm makes portable oxygen concentrators for people with chronic respiratory conditions. It went through a deeper correction and rebounded since first highlighted in yellow with new pivot point cited based on its 9/14/15 high plus 10 cents in 8/05/16 mid-day report (read here).
Formed Orderly Base With Earnings News Due After Tuesday's Close - Monday, February 27, 2017
Inogen Inc (INGN -$0.11 or -0.16% to $69.11) endured some distributional pressure today ahead of its earnings announcement. It returned to the Featured Stocks list and it was highlighted in yellow with pivot point cited based on its 2/21/17 high in the earlier mid-day report (read here). It is perched near all-time highs after a saucer-with-handle base, and it was noted - "Subsequent volume-driven gains for new highs coupled with strong earnings may clinch a technical buy signal. Reported earnings +23% on +33% sales revenues for the Sep '16 quarter, slightly below the +25% minimum guideline. Due to report Dec '16 earnings news on 2/28/17, and volume and volatility often increase near earnings news. Rebounded and made gradual progress since dropped from the Featured Stocks list on 10/27/16."
The fact-based investment system calls for earnings per share increases above the +25% minimum guideline (C criteria) in at least 3 of the past 4 quarterly comparisons. Disciplined investors will be closely watching the earnings news, and more importantly, the stock's reaction to the news. INGN currently has a B Timeliness Rating and a C Sponsorship Rating. Its current Up/Down Volume ratio of 1.1 is an unbiased indication that its shares were under slight accumulation over the past 50 days. The number of top-rated funds owning its share rose from 302 in Mar '16 to 335 in Dec '16, a reassuring sign concerning the I criteria. Its small supply of 15.4 million shares (S criteria) in the public float can contribute to greater price volatility in the event of institutional buying or selling.
The high-ranked Medical - Products firm makes portable oxygen concentrators for people with chronic respiratory conditions. It went through a deeper correction and rebounded since last shown in this FSU section on 10/20/16 with an annotated graph under the headline, "Rebound Above 50-Day Moving Average Line Helped Outlook". It was first highlighted in yellow with new pivot point cited based on its 9/14/15 high plus 10 cents in 8/05/16 mid-day report (read here).
Rebound Above 50-Day Moving Average Line Helped Outlook - Thursday, October 20, 2016
Inogen Inc (INGN +$1.30 or +2.26% to $58.76) rebounded above its 50-day moving average (DMA) line with today's big gain on average volume and strong finish near the session high helping its outlook improve. It has not formed a sound base yet found support recently near Sep '15 highs in the $56 area. More damaging losses would raise concerns and trigger a worrisome technical sell signal. It was last shown in this FSU section on 9/12/16 with an annotated graph under the headline, "Stubbornly Holding Ground Near All-Time High".
INGN was highlighted in yellow with new pivot point cited based on its 9/14/15 high plus 10 cents in 8/05/16 mid-day report (read here). It has made limited progress since its 8/09/16 volume-driven gain triggered a technical buy signal.
The Dec '15, Mar and Jun '16 quarters showed earnings increases above the +25% minimum guideline (C criteria). Sales revenues growth has been in the +24-39% range, a reassuring sign of increasing demand for its new products and services (N criteria). Annual earnings (A criteria) growth has been strong.
The number of top-rated funds owning its shares rose from 114 in Sep '14 to 319 in Sep '16, a reassuring sign concerning the I criteria. Its small supply of only 15.3 million shares (S criteria) in the public float can contribute to greater price volatility in the event of institutional buying or selling. it is up considerably from its $16 IPO on 2/14/14 followed by a Secondary Offering on 10/30/14.
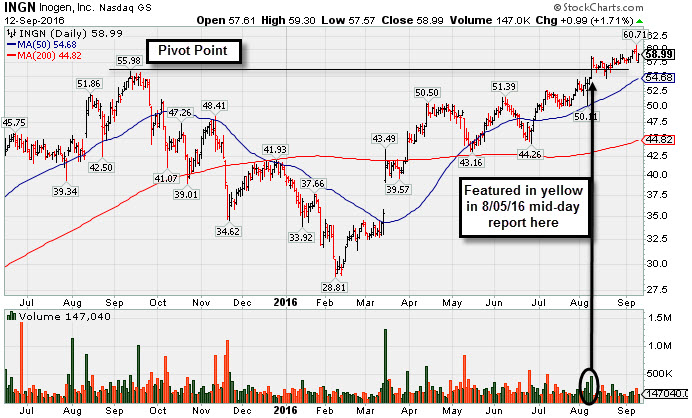
Stubbornly Holding Ground Near All-Time High - Monday, September 12, 2016
Inogen Inc (INGN +$0.99 or +1.71% to $58.99) posted a gain with light volume today. It remains near its 52-week high, stubbornly holding its ground. INGN was highlighted in yellow with new pivot point cited based on its 9/14/15 high plus 10 cents in 8/05/16 mid-day report (read here). It was last shown in this FSU section on 8/05/16 with an annotated graph under the headline, "Perched Within Striking Distance of Highs Following Rebound". It has made limited progress since its 8/09/16 volume-driven gain triggered a technical buy signal.
The Dec '15, Mar and Jun '16 quarters showed earnings increases above the +25% minimum guideline (C criteria). Sales revenues growth has been in the +24-39% range, a reassuring sign of increasing demand for its new products and services (N criteria). Annual earnings (A criteria) growth has been strong.
The number of top-rated funds owning its shares rose from 114 in Sep '14 to 317 in Jun '16, a reassuring sign concerning the I criteria. Its small supply of only 15.3 million shares (S criteria) in the public float can contribute to greater price volatility in the event of institutional buying or selling. it is up considerably from its $16 IPO on 2/14/14 followed by a Secondary Offering on 10/30/14.
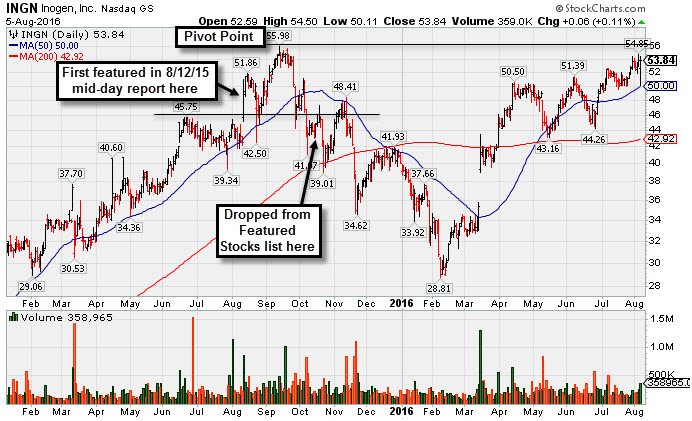
Perched Within Striking Distance of Highs Following Rebound - Friday, August 5, 2016
Inogen Inc (INGN +$0.06 or +0.11% to $53.84) was highlighted in yellow with new pivot point cited based on its 9/14/15 high plus 10 cents in the earlier mid-day report (read here). Recently it has been rebounding near its 52-week high, however, a volume-driven gain above the pivot point is still needed to trigger a technical buy signal.
The Dec '15, Mar and Jun '16 quarters showed earnings increases above the +25% minimum guideline (C criteria). Sales revenues growth has been in the +24-39% range, a reassuring sign of increasing demand for its new products and services (N criteria). Annual earnings (A criteria) growth has been strong.
INGN waslast shown in this FSU section on 10/14/15 with an annotated graph under the headline, "Slumping Further After Recent Sell Signal Triggered", and it went through a deep consolidation below its 200 DMA line and rebounded since dropped from the Featured Stocks list on 10/16/15. It had triggered a technical sell signal with big volume-driven losses undercutting its 50-day moving average (DMA) line and prior highs near $45.
The number of top-rated funds owning its shares rose from 114 in Sep '14 to 318 in Jun '16, a reassuring sign concerning the I criteria. Its small supply of only 15.1 million shares (S criteria) in the public float can contribute to greater price volatility in the event of institutional buying or selling. it is up considerably from its $16 IPO on 2/14/14 followed by a Secondary Offering on 10/30/14.
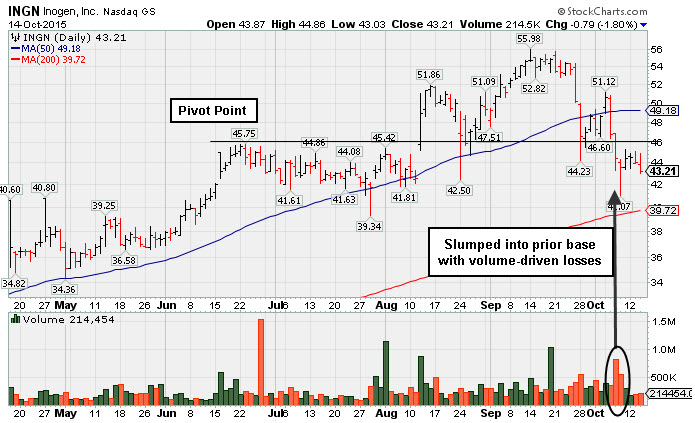
Slumping Further After Recent Sell Signal Triggered - Wednesday, October 14, 2015
Inogen Inc (INGN -$0.79 or -1.80% to $43.21) is still struggling and slumping further below its 50-day moving average (DMA) line after suffering damaging losses in recent weeks. A rebound above the 50 DMA line is needed for its outlook to improve. The 200 DMA line ($39.72) defines important near-term support where a violation would raise more serious concerns.
Technically, it broke out with a gap up and considerable volume-driven gain when highlighted in yellow with pivot point cited based on its 6/23/15 high plus 10 cents in the 8/12/15 mid-day report (read here). It reported Jun '15 earnings +55% on 45% sales revenues, its 4th consecutive quarterly earnings increase above the +25% minimum guideline (C criteria). Sales revenues growth has been in the +43-49% range, a reassuring sign of increasing demand for its new products and services (N criteria).
The number of top-rated funds owning its shares rose from 114 in Sep '14 to 236 in Sep '15, a reassuring sign concerning the I criteria. Its current Up/Down Volume Ratio of 1.1 is an unbiased indication its shares have been under accumulation over the past 50-days. Its small supply of only 13.4 million shares (S criteria) in the public float can contribute to greater price volatility in the event of institutional buying or selling.
Its limited history was previously noted as a concern, yet it is up considerably from its $16 IPO on 2/14/14 followed by a Secondary Offering on 10/30/14.
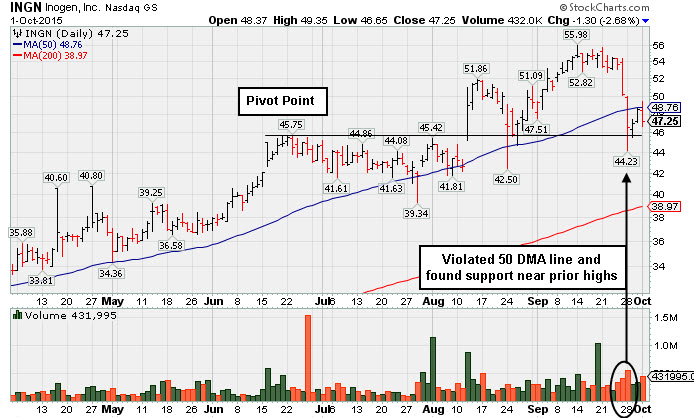
Met Resistance at 50-Day Moving Average Following Violation - Thursday, October 1, 2015
Inogen Inc (INGN -$1.30 or -2.68% to $47.25) met resistance at its 50-day moving average (DMA) line when trying to rebound then fell on higher volume today. It raised concerns and triggered a technical sell signal with big volume-driven losses undercutting its 50 DMA line. Prior highs near $45 acted as support. Any more damaging losses would raise serious concerns.
INGN was last shown in this FSU section on 9/16/15 with an annotated graph under the headline, "Another New High Close For Medical Products Firm", getting more extended from its prior base. Technically, it broke out with a gap up and considerable volume-driven gain when highlighted in yellow with pivot point cited based on its 6/23/15 high plus 10 cents in the 8/12/15 mid-day report (read here).
It reported Jun '15 earnings +55% on 45% sales revenues, its 4th consecutive quarterly earnings increase above the +25% minimum guideline (C criteria). During that time its sales revenues growth has been in the +43-49% range, a reassuring sign of increasing demand for its new products and services (N criteria).
The number of top-rated funds owning its shares rose from 114 in Sep '14 to 202 in Jun '15, a reassuring sign concerning the I criteria. Its current Up/Down Volume Ratio of 1.7 is an unbiased indication its shares have been under accumulation over the past 500 days. Its small supply of only 13.4 million shares (S criteria) in the public float can contribute to greater price volatility in the event of institutional buying or selling.
Its limited history was previously noted as a concern, yet it is up considerably from its $16 IPO on 2/14/14 followed by a Secondary Offering on 10/30/14.
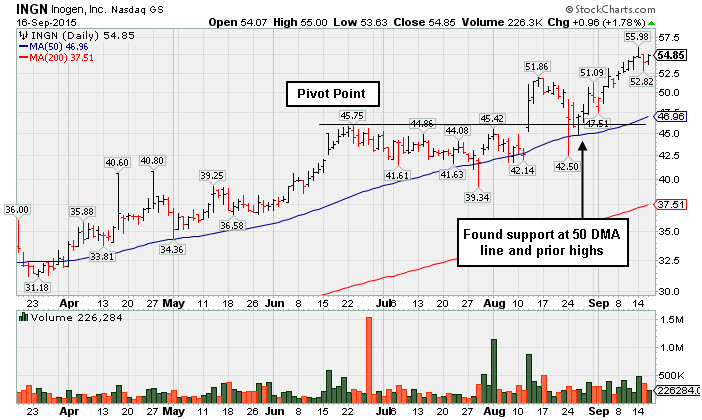
Another New High Close For Medical Products Firm - Wednesday, September 16, 2015
Inogen Inc (INGN +$0.96 or +1.78% to $54.85) finished at a best-ever close with today's gain, getting more extended from its prior base. Its 50-day moving average (DMA) line and prior highs define near-term support to watch on pullbacks.
INGN was last shown in this FSU section on 9/09/15 with an annotated graph under the headline, "Further Volume-Driven Gains Into New High Territory". Technically, it broke out with a gap up and considerable volume-driven gain when highlighted in yellow with pivot point cited based on its 6/23/15 high plus 10 cents in the 8/12/15 mid-day report (read here).
It reported Jun '15 earnings +55% on 45% sales revenues, its 4th consecutive quarterly earnings increase above the +25% minimum guideline (C criteria). During that time its sales revenues growth has been in the +43-49% range, a reassuring sign of increasing demand for its new products and services (N criteria).
The number of top-rated funds owning its shares rose from 114 in Sep '14 to 201 in Jun '15, a reassuring sign concerning the I criteria. Its current Up/Down Volume Ratio of 1.7 is an unbiased indication its shares have been under accumulation over the past 500 days. Its small supply of only 16.9 million shares (S criteria) in the public float can contribute to greater price volatility in the event of institutional buying or selling.
Its limited history was previously noted as a concern, yet it is up considerably from its $16 IPO on 2/14/14 followed by a Secondary Offering on 10/30/14.
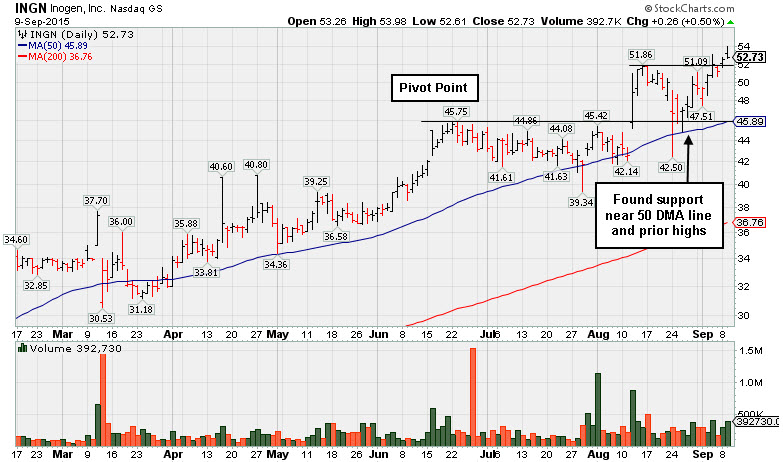
Further Volume-Driven Gains Into New High Territory - Wednesday, September 9, 2015
Inogen Inc (INGN +$0.26 or +0.50% to $52.73) rose into new high territory today with a volume-driven gain after a brief consolidation. It found prompt support near its 50-day moving average (DMA) line and prior highs when consolidating. Technically, it broke out with a gap up and considerable volume-driven gain when last shown in this FSU section on 8/12/15 with an annotated graph under the headline, "Finished Strong With Volume-Driven Breakout Gain".It was highlighted in yellow with pivot point cited based on its 6/23/15 high plus 10 cents in the 8/12/15 mid-day report (read here).
Bullish action came as it reported Jun '15 earnings +55% on 45% sales revenues, its 4th consecutive quarterly earnings increase above the +25% minimum guideline (C criteria). During that time its sales revenues growth has been in the +43-49% range, a reassuring sign of increasing demand for its new products and services (N criteria).
The number of top-rated funds owning its shares rose from 114 in Sep '14 to 200 in Jun '15, a reassuring sign concerning the I criteria. Its current Up/Down Volume Ratio of 1.5 is an unbiased indication its shares have been under accumulation over the past 500 days. Its small supply of only 11.8 million shares (S criteria) in the public float can contribute to greater price volatility in the event of institutional buying or selling.
Its limited history was previously noted as a concern, yet it is up considerably from its $16 IPO on 2/14/14 followed by a Secondary Offering on 10/30/14.
Found Support at 50-day Average Following Breakout - Monday, August 31, 2015
Inogen Inc (INGN -$0.49 or -0.98% to $49.29) found prompt support near its 50-day moving average (DMA) line and prior highs when consolidating. It was last shown in this FSU section on 8/12/15 with an annotated graph under the headline, "Finished Strong With Volume-Driven Breakout Gain", after highlighted in yellow with pivot point cited based on its 6/23/15 high plus 10 cents in the earlier mid-day report (read here).
Technically, it broke out with a gap up and considerable volume-driven gain. Bullish action came as it reported Jun '15 earnings +55% on 45% sales revenues, its 4th consecutive quarterly earnings increase above the +25% minimum guideline (C criteria). During that time its sales revenues growth has been in the +43-49% range, a reassuring sign of increasing demand for its new products and services (N criteria).
The number of top-rated funds owning its shares rose from 114 in Sep '14 to 195 in Jun '15, a reassuring sign concerning the I criteria. Its current Up/Down Volume Ratio of 1.2 is an unbiased indication its shares have been under slight accumulation over the past 500 days. Its small supply of only 11.8 million shares (S criteria) in the public float can contribute to greater price volatility in the event of institutional buying or selling.
Recent market weakness (M criteria) remains an overriding concern arguing against new buying efforts. Its limited history was previously noted as a concern, yet it is up considerably from its $16 IPO on 2/14/14 followed by a Secondary Offering on 10/30/14.
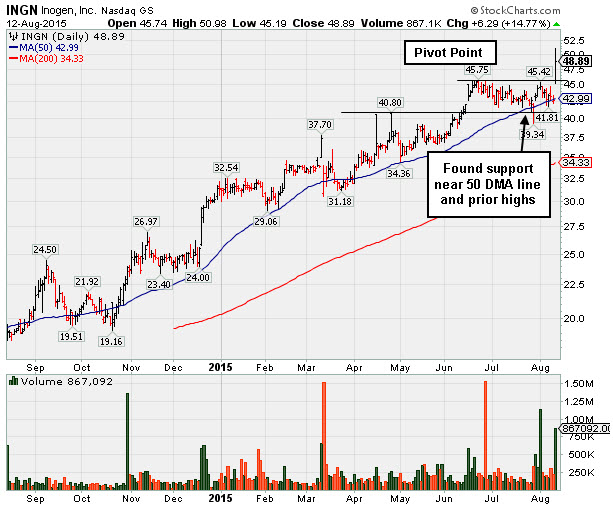
Finished Strong With Volume-Driven Breakout Gain - Wednesday, August 12, 2015
Inogen Inc (INGN +$6.29 or +14.77% to $48.89) was highlighted in yellow with pivot point cited based on its 6/23/15 high plus 10 cents in the earlier mid-day report (read here). Technically, it broke out with a gap up and considerable volume-driven gain today hitting a new 52-week high, finishing in the upper half of its intra-day range. It recently found support at its 50-day moving average (DMA) line and formed an orderly base above prior highs in the $40 area.
Bullish action came as it reported Jun '15 earnings +55% on 45% sales revenues, its 4th consecutive quarterly earnings increase above the +25% minimum guideline (C criteria). During that time its sales revenues growth has been in the +43-49% range, a reassuring sign of increasing demand for its new products and services (N criteria).
The number of top-rated funds owning its shares rose from 114 in Sep '14 to 200 in Jun '15, a reassuring sign concerning the I criteria. Its current Up/Down Volume Ratio of 1.3 is an unbiased indication its shares have been under accumulation over the past 500 days. Its small supply of only 11.8 million shares (S criteria) in the public float can contribute to greater price volatility in the event of institutional buying or selling.
Its limited history and broader market weakness (M criteria) are concerns. It is up considerably from its $16 IPO on 2/14/14 followed by a Secondary Offering on 10/30/14.