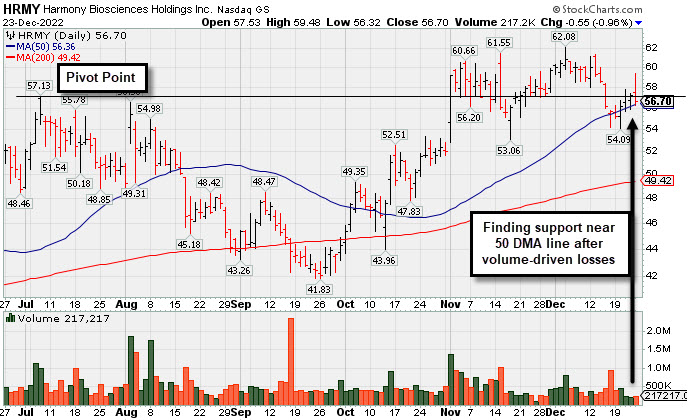
Finding Support Near Prior Highs and 50-Day Moving Average Line - Friday, December 23, 2022
Harmony Biosciences Hldg (HRMY -$0.55 or -0.96% to $56.70) has been consolidating near its prior highs and pivot point. Its 50-day moving average (DMA) line ($56.37) and 11/17/22 low ($53.06) define important near-term support to watch.
HRMY was highlighted in yellow with new pivot point cited based on its 7/07/22 high plus 10 cents in the 11/01/22 mid-day report (read here). Bullish action came after it reported Sep '22 quarterly earnings +132% on +45% sales revenues versus the year ago period. It powered to a new 52-week high with a considerable gain and strong close above the pivot point backed by at least +200% above average volume triggering a technical buy signal. It was last shown in this FSU section on 11/28/22 with detailed analysis and an annotated graph under the headline, "Harmony Still Hovering Near All-Time High".
Prior quarterly comparisons were strong, well above the +25% minimum earnings guideline (C criteria), and it has an 80 Earnings Per Share Rating. It hails from the Medical-Biomed/Biotech industry group, currently ranked 30th on the 197 Industry Groups list (L criteria). Its annual earnings history (A criteria) is limited.
HRMY completed its $24 IPO on 8/19/20. Its small supply of only 23.1 million shares (S criteria) in the public float can contribute to greater price volatility in the event of institutional buying or selling. The number of top-rated funds owning its shares rose from 208 in Sep '21 to 450 in Sep '22, a reassuring sign concerning the I criteria. Its current Up/Down Volume Ratio of 1.2 is an unbiased indication its shares have been under slight accumulation over the past 50 days.
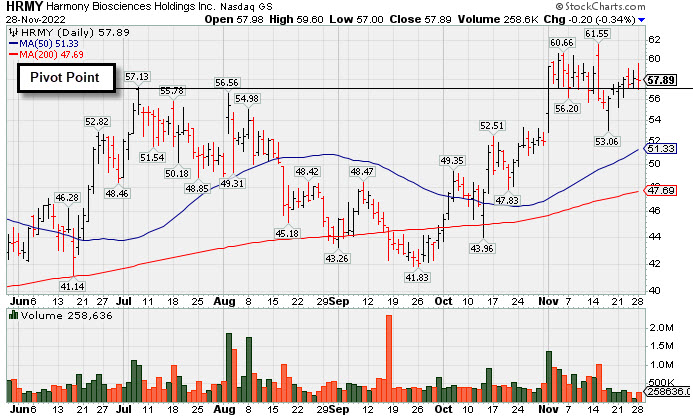
Harmony Still Hovering Near All-Time High - Monday, November 28, 2022
Harmony Biosciences Hldg (HRMY -$0.20 or -0.34% to $57.89) pulled back today after wedging higher with recent gains lacking great volume conviction. The 11/17/22 low ($53.06) defines initial support to watch above its 50-day moving average DMA line ($51.33).
HRMY was highlighted in yellow with new pivot point cited based on its 7/07/22 high plus 10 cents in the 11/01/22 mid-day report (read here) . Bullish action came after it reported Sep '22 quarterly earnings +132% on +45% sales revenues versus the year ago period. It powered to a new 52-week high with a considerable gain and strong close above the pivot point backed by at least +200% above average volume triggering a technical buy signal. It was last shown in this FSU section on 11/01/22 with detailed analysis and an annotated graph under the headline, "Volume Heavy Behind Technical Breakout After Earnings".
Prior quarterly comparisons were strong, well above the +25% minimum earnings guideline (C criteria), and it has an 80 Earnings Per Share Rating. It hails from the Medical-Biomed/Biotech industry group, currently ranked 22nd on the 197 Industry Groups list (L criteria). Its annual earnings history (A criteria) is limited.
HRMY completed its $24 IPO on 8/19/20. Its small supply of only 23.1 million shares (S criteria) in the public float can contribute to greater price volatility in the event of institutional buying or selling. The number of top-rated funds owning its shares rose from 208 in Sep '21 to 446 in Sep '22, a reassuring sign concerning the I criteria. Its current Up/Down Volume Ratio of 1.0 is an unbiased indication its shares have been neutral concerning accumulation/distribution over the past 50 days.
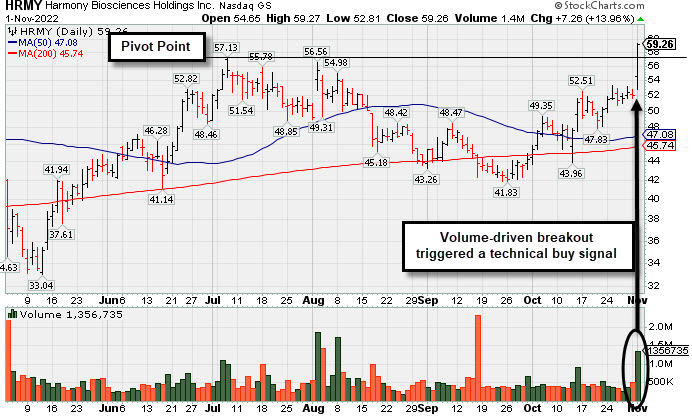
Volume Heavy Behind Technical Breakout After Earnings - Tuesday, November 1, 2022
Harmony Biosciences Hldg (HRMY +$7.26 or +13.96% to $59.26) finished strong after it was highlighted in yellow with new pivot point cited based on its 7/07/22 high plus 10 cents in the earlier mid-day report (read here) . Bullish action came after it reported Sep '22 quarterly earnings +132% on +45% sales revenues versus the year ago period. It powered to a new 52-week high with today's considerable gain and strong close above the pivot point backed by at least +200% above average volume triggering a technical buy signal. It recently rebounded above its 200 and 50-day moving average (DMA) lines after sputtering since dropped from the Featured Stocks list on 8/24/22.
HRMY stalled after highlighted in the 7/06/22 mid-day report (read here). It was last shown in this FSU section on 8/24/22 with detailed analysis and an annotated graph under the headline, "Failed to Rebound After 50-Day Moving Average Violation".
Prior quarterly comparisons were strong, well above the +25% minimum earnings guideline (C criteria), and it has an 80 Earnings Per Share Rating. It hails from the Medical-Biomed/Biotech industry group, currently ranked 7th on the 197 Industry Groups list (L criteria). Its annual earnings history (A criteria) is limited.
HRMY completed its $24 IPO on 8/19/20. Its small supply of only 23.1 million shares (S criteria) in the public float can contribute to greater price volatility in the event of institutional buying or selling. The number of top-rated funds owning its shares rose from 208 in Sep '21 to 438 in Sep '22, a reassuring sign concerning the I criteria. Its current Up/Down Volume Ratio of 0.7 is an unbiased indication its shares have been under distributional pressure over the past 50 days.
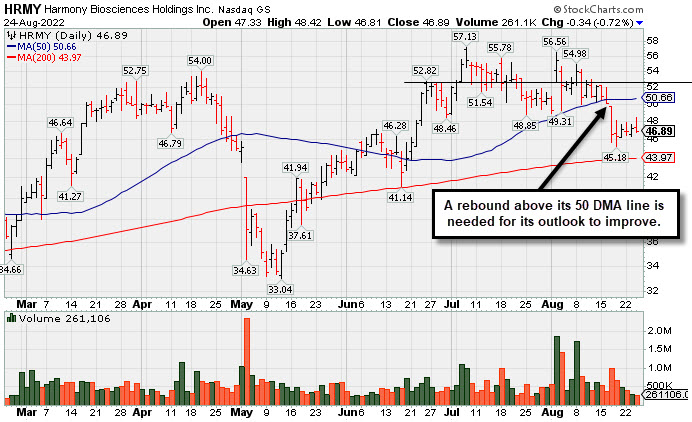
Failed to Rebound After 50-Day Moving Average Violation - Wednesday, August 24, 2022
Harmony Biosciences Hldg (HRMY -$0.34 or -0.72% to $46.89) closed near the low of the session with a small loss. Volume totals have cooled after damaging losses, meanwhile it has failed to rebound after violating its 50-day moving average (DMA) line and prior low ($48.85) triggering technical sell signals. It will be dropped from the Featured Stocks list tonight. A rebound above the 50 DMA line ($50.67) is needed for its to outlook improve. It met stubborn resistance in the $57 area.
HRMY stalled after highlighted in the 7/06/22 mid-day report (read here). It was last shown in this FSU section on 8/04/22 with detailed analysis and an annotated graph under the headline, "Churning Higher Volume While Perched Near High After Earnings News".
Jun '22 quarterly earnings rose +54% on +45% sales revenues versus the year ago period and prior quarterly comparisons were strong, well above the +25% minimum earnings guideline (C criteria). It hails from the Medical-Biomed/Biotech industry group, currently ranked 3rd on the 197 Industry Groups list (L criteria). Its annual earnings history (A criteria) is limited. It has an 80 Earnings Per Share Rating.
HRMY completed its $24 IPO on 8/19/20. Its small supply of only 23.7 million shares (S criteria) in the public float can contribute to greater price volatility in the event of institutional buying or selling. The number of top-rated funds owning its shares rose from 208 in Sep '21 to 408 in Jun '22, a reassuring sign concerning the I criteria. Its current Up/Down Volume Ratio of 1.2 is an unbiased indication its shares have been under accumulation over the past 50 days.
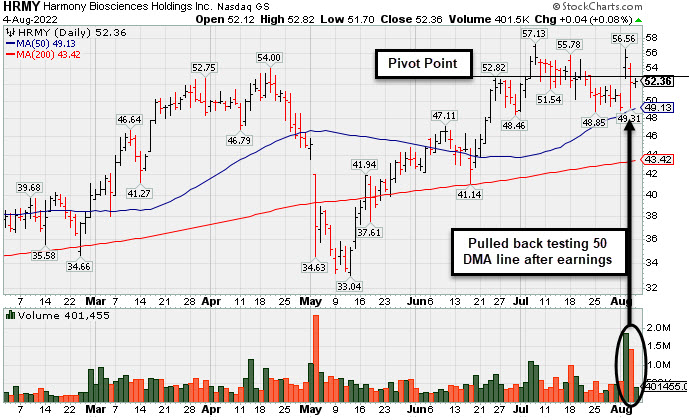
Churning Higher Volume While Perched Near High After Earnings News - Thursday, August 4, 2022
Harmony Biosciences Hldg (HRMY +$0.04 or +0.08% to $52.36) held its ground today. On the prior session its intra-day low tested its 50-day moving average (DMA) line ($49.13) and prior low. It had challenged its all-time high with above average volume behind a big gain on Tuesday's session after it reported Jun '22 quarterly earnings +54% on +45% sales revenues versus the year ago period. Volume and volatility often increase near earnings news.
HRMY has made little headway since highlighted in yellow with pivot point cited based on its 6/27/22 high in the 7/06/22 mid-day report (read here). It stalled after hitting a new all-time high (N criteria) back then with a gain and close above the pivot point backed by +118% above average volume triggering a technical buy signal. It was last shown in this FSU section on 7/18/22 with detailed analysis and an annotated graph under the headline, "Harmony Has Been Encountering Distributional Pressure".
The high-ranked Medical-Biomed/Biotech firm's annual earnings history (A criteria) is limited, however it has an 80 Earnings Per Share Rating. It completed its $24 IPO on 8/19/20. Its small supply of only 23.6 million shares (S criteria) in the public float can contribute to greater price volatility in the event of institutional buying or selling. The number of top-rated funds owning its shares rose from 208 in Sep '21 to 406 in Jun '22, a reassuring sign concerning the I criteria. Its current Up/Down Volume Ratio of 1.2 is an unbiased indication its shares have been under accumulation over the past 50 days.
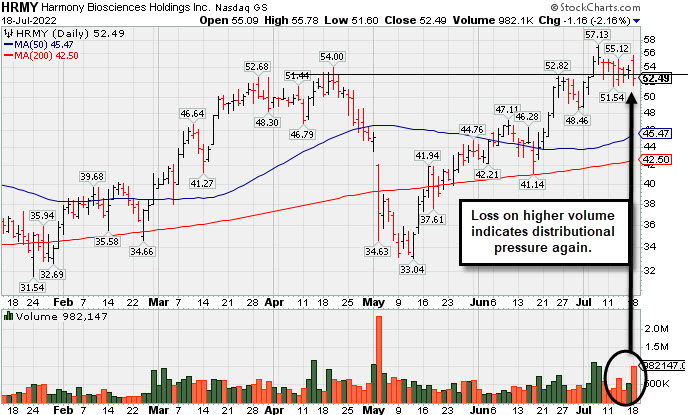
Harmony Has Been Encountering Distributional Pressure - Monday, July 18, 2022
Harmony Biosciences Hldg (HRMY -$1.16 or -2.16% to $52.49) was trading near its 52-week high but encountered distributional pressure and had a "negative reversal" today, ending near the session low with volume +104% above average behind the loss. It held its ground but made very little headway since recently triggering a technical buy signal. Recent lows in the $51.50 area define near-term support to watch well above its 50-day moving average (DMA) line $45.47).
HRMY was highlighted in yellow with pivot point cited based on its 6/27/22 high in the 7/06/22 mid-day report (read here). It hit a new all-time high (N criteria) with a gain and close above the pivot point backed by +118% above average volume triggering a technical buy signal. It was shown in this FSU section with detailed analysis that evening under the headline, "Volume-Driven Breakout For Biotech Firm".
The high-ranked Medical-Biomed/Biotech firm reported strong sales revenues and earnings increases well above the +25% minimum guideline (C criteria) in quarterly comparisons through Mar '22 versus the year ago periods. Its annual earnings history (A criteria) is limited, however it has an 80 Earnings Per Share Rating. It completed its $24 IPO on 8/19/20.
Its small supply of only 23.6 million shares (S criteria) in the public float can contribute to greater price volatility in the event of institutional buying or selling. The number of top-rated funds owning its shares rose from 208 in Sep '21 to 390 in Jun '22, a reassuring sign concerning the I criteria. Its current Up/Down Volume Ratio of 1.4 is an unbiased indication its shares have been under accumulation over the past 50 days.
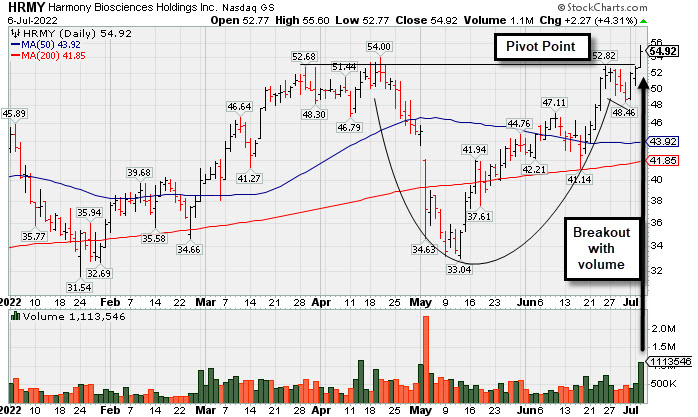
Volume-Driven Breakout For Biotech Firm - Wednesday, July 6, 2022
Harmony Biosciences Hldg (HRMY +$2.27 or +4.31% to $54.92) was highlighted in yellow with pivot point cited based on its 6/27/22 high in the earlier mid-day report (read here). It hit a new all-time high (N criteria) with today's gain and close above the pivot point backed by +118% above average volume triggering a technical buy signal.
The high-ranked Medical-Biomed/Biotech firm reported strong sales revenues and earnings increases well above the +25% minimum guideline (C criteria) in quarterly comparisons through Mar '22 versus the year ago periods. Its annual earnings history (A criteria) is limited, however it has an 80 Earnings Per Share Rating. It completed its $24 IPO on 8/19/20.
The high-ranked Medical-Biomed/Biotech firm reported strong sales revenues and earnings increases well above the +25% minimum guideline (C criteria) in quarterly comparisons through Mar '22 versus the year ago periods. Its annual earnings history (A criteria) is limited, however it has an 80 Earnings Per Share Rating. It completed its $24 IPO on 8/19/20.
Its small supply of only 236 million shares (S criteria) in the public float can contribute to greater price volatility in the event of institutional buying or selling. The number of top-rated funds owning its shares rose from 208 in Sep '21 to 382 in Jun '22, a reassuring sign concerning the I criteria. Meanwhile, its current Up/Down Volume Ratio of 1.0 is neutral concerning Accumulation/Distribution over the past 50 days.