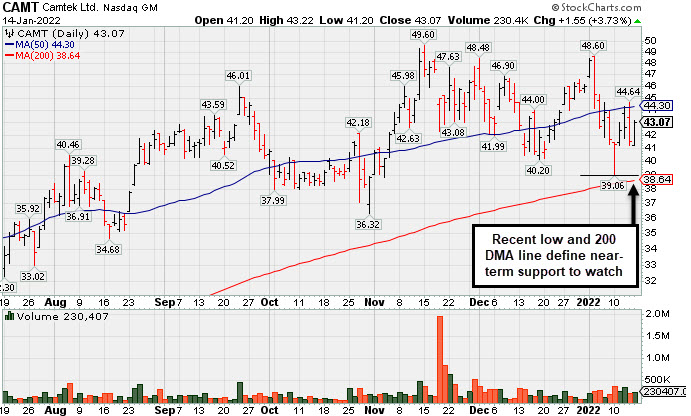
Recent Low and 200 DMA Line Define Near-Term Support - Friday, January 14, 2022
Camtek Ltd (CAMT +$1.55 or +3.73% to $43.07) has been sputtering after slumping below its 50-day moving average (DMA) line ($44.30). A rebound above the 50 DMA line is needed for its outlook to improve. The recent low and its 200 DMA line define the next important support level in the $39 area where any violation would raise more serious concerns.Fundamentals remain strong. Recently it reported Sep '21 quarterly earnings +150% versus the year ago period, continuing its strong earnings track record. That marked its 5th strong quarterly comparison well above the +25% minimum guideline (C criteria) and showing impressive sequential acceleration. This Israeli Electronics firm has a strong annual earnings (A criteria) history. It has a 99 Earnings Per Share Rating.
CAMT was first highlighted in yellow with pivot point cited based on its 4/13/21 high plus 10 cents in the 4/28/21 mid-day report (read here). It was last shown in this FSU section on 12/15/21 with an annotated graph included under the headline, "Closed Above 50-Day Average After Big Gain With Light Volume".
The number of top-rated funds owning its shares rose from 48 in Jun '20 to 114 in Dec '21 a reassuring sign concerning the I criteria. Its current Up/Down Volume Ratio of 0.7 is an unbiased indication its shares have been under distributional pressure over the past 50 days. It completed a new Public Offering on 11/19/20. Still, its small supply of only 43.7 million shares outstanding (S criteria) can contribute to greater price volatility in the event of institutional buying or selling. It has a Timeliness Rating of B and a Sponsorship Rating of C.
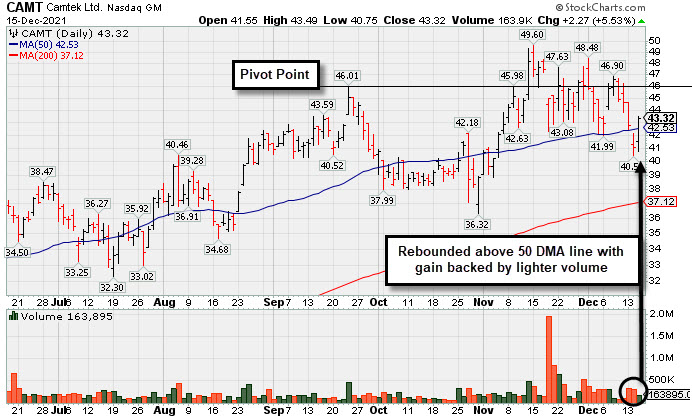
Closed Above 50-Day Average After Big Gain With Light Volume - Wednesday, December 15, 2021
Camtek Ltd (CAMT +$2.27 or +5.53% to $43.32) rebounded above its 50-day moving average (DMA) line ($42.53) helping its outlook improve, but there was lighter than average volume behind today's gain. It still faces some near-term resistance due to overhead supply up to the $49 level.Fundamentals remain strong. Recently it reported Sep '21 quarterly earnings +150% versus the year ago period, continuing its strong earnings track record. That marked its 5th strong quarterly comparison well above the +25% minimum guideline (C criteria) and showing impressive sequential acceleration. This Israeli Electronics firm has a strong annual earnings (A criteria) history. It has a 98 Earnings Per Share Rating.
CAMT was first highlighted in yellow with pivot point cited based on its 4/13/21 high plus 10 cents in the 4/28/21 mid-day report (read here). A new pivot point was cited based on its 9/23/21 high as it showed resilience after shown in this FSU section on 11/05/21 with an annotated graph included under the headline, "Rebound Above 50-Day Moving Average Helped Outlook".
The number of top-rated funds owning its shares rose from 48 in Jun '20 to 109 on Sep '21 a reassuring sign concerning the I criteria. Its current Up/Down Volume Ratio of 0.6 is an unbiased indication its shares have been under distributional pressure over the past 50 days. It completed a new Public Offering on 11/19/20. Still, its small supply of only 43.7 million shares outstanding (S criteria) can contribute to greater price volatility in the event of institutional buying or selling. It has a Timeliness Rating of A and a Sponsorship Rating of C.
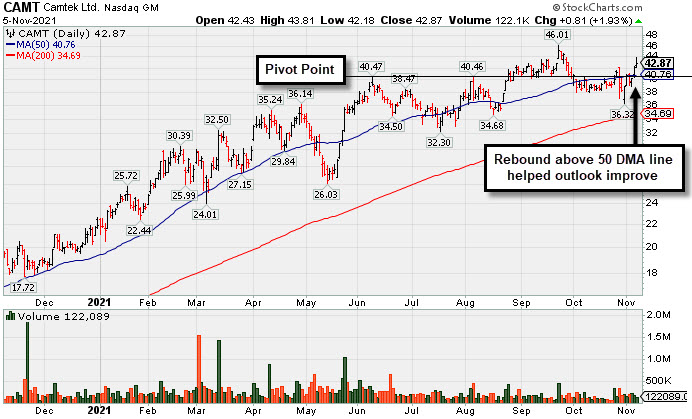
Rebound Above 50-Day Moving Average Helped Outlook - Friday, November 5, 2021
Camtek Ltd (CAMT +$0.81 or +1.93% to $42.87) rebounded well above its 50-day moving average (DMA) line ($40.76) with lighter volume behind today's 3rd consecutive gain. It still faces some near-term resistance due to overhead supply up to the $46 level.Fundamentals remain strong. Recently it reported Sep '21 quarterly earnings +150% versus the year ago period, continuing its strong earnings track record. That marked its 5th strong quarterly comparison well above the +25% minimum guideline (C criteria) and showing impressive sequential acceleration. This Israeli Electronics firm has a strong annual earnings (A criteria) history. It has a 98 Earnings Per Share Rating.
CAMT was highlighted in yellow with pivot point cited based on its 4/13/21 high plus 10 cents in the 4/28/21 mid-day report (read here). It was last shown in this FSU section on 10/05/21 with an annotated graph included under the headline, "Fell Below Prior High and Violated 50-Day Moving Average".
The number of top-rated funds owning its shares rose from 48 in Jun '20 to 112 on Sep '21 a reassuring sign concerning the I criteria. Its current Up/Down Volume Ratio of 1.4 is an unbiased indication its shares have been under accumulation over the past 50 days. It completed a new Public Offering on 11/19/20. Still, its small supply of only 43.7 million shares outstanding (S criteria) can contribute to greater price volatility in the event of institutional buying or selling. It has a Timeliness Rating of A and a Sponsorship Rating of C.
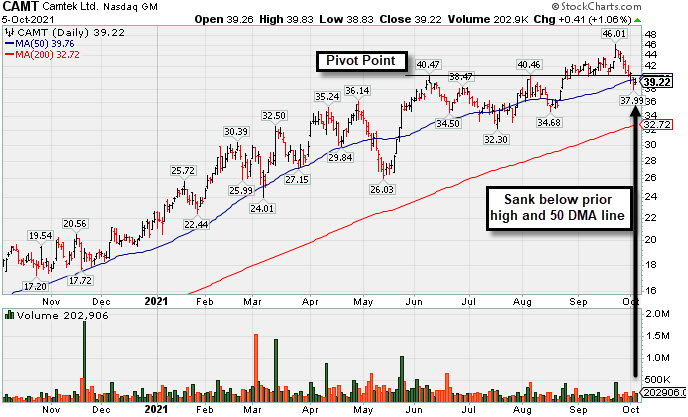
Fell Below Prior High and Violated 50-Day Moving Average - Tuesday, October 5, 2021
Camtek Ltd (CAMT +$0.41 or +1.06% to $39.22) halted its slide today. On the prior session it violated prior highs in the $40 area and sank below its 50-day moving average (DMA) line ($39.76) with a damaging volume-driven loss raising concerns and triggering a technical sell signal. A prompt rebound above the 50 DMA line is needed for its outlook to improve. The prior low ($34.68 on 8/17/21) defines the next important near-term support to watch.Fundamentals remain strong. Recently it reported Jun '21 quarterly earnings +138% on +82% sales revenues versus the year-ago period, continuing its strong earnings track record. That marked its 4th strong quarterly comparison well above the +25% minimum guideline (C criteria) and showing impressive sequential acceleration. This Israeli Electronics firm has a strong annual earnings (A criteria) history. It has a 98 Earnings Per Share Rating.
CAMT was highlighted in yellow with pivot point cited based on its 4/13/21 high plus 10 cents in the 4/28/21 mid-day report (read here). It was last shown in this FSU section on 8/17/21 with an annotated graph included under the headline, "Recent 50-Day Moving Average Violation Again Raised Concerns".
The number of top-rated funds owning its shares rose from 48 in Jun '20 to 103 on Jun '21 a reassuring sign concerning the I criteria. Its current Up/Down Volume Ratio of 1.4 is an unbiased indication its shares have been under accumulation over the past 50 days. It completed a new Public Offering on 11/19/20. Still, its small supply of only 43.7 million shares outstanding (S criteria) can contribute to greater price volatility in the event of institutional buying or selling. It has a Timeliness Rating of A and a Sponsorship Rating of C.
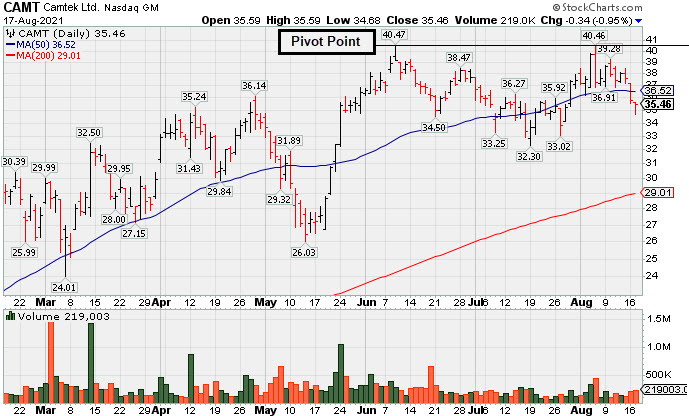
Recent 50-Day Moving Average Violation Again Raised Concerns - Tuesday, August 17, 2021
Camtek Ltd (CAMT -$0.34 or -0.95% to $35.46) suffered a 3rd consecutive loss in a streak that has raised concerns as it violated its 50-day moving average (DMA) line ($36.52). Only a prompt rebound above the 50 DMA line would help its outlook improve. The prior low ($32 30) defines the next important near-term support to watch. More damaging losses would trigger a worrisome technical sell signal.Recently it reported Jun '21 quarterly earnings +138% on +82% sales revenues versus the year-ago period, continuing its strong earnings track record. That marked its 4th strong quarterly comparison well above the +25% minimum guideline (C criteria) and showing impressive sequential acceleration. This Israeli Electronics firm has a strong annual earnings (A criteria) history. It has a 98 Earnings Per Share Rating. A new pivot point was cited based on its 6/09/21 high plus 10 cents. Subsequent gains and a close above the pivot point backed by at least +40% above average volume may trigger a new (or add-on) technical buy signal. CAMT was highlighted in yellow with pivot point cited based on its 4/13/21 high plus 10 cents in the 4/28/21 mid-day report (read here). It was last shown in this FSU section on 7/08/21 with an annotated graph included under the headline, "Loss With Light Volume Undercut 50-Day Moving Average".
The number of top-rated funds owning its shares rose from 48 in Jun '20 to 98 on Jun '21 a reassuring sign concerning the I criteria. Its current Up/Down Volume Ratio of 0.7 is an unbiased indication its shares have been under distributional pressure over the past 50 days. It completed a new Public Offering on 11/19/20. Still, its small supply of only 43.3 million shares outstanding (S criteria) can contribute to greater price volatility in the event of institutional buying or selling. It has a Timeliness Rating of B and a Sponsorship Rating of C.
Loss With Light Volume Undercut 50-Day Moving Average - Thursday, July 8, 2021
Camtek Ltd (CAMT -$1.07 or -3.02% to $34.40) gapped down today for a 5th consecutive loss with lighter than average volume. It slumped below prior highs in the $35-36 area and violated its 50-day moving average (DMA) line ($34.50) raising concerns, however, it finished the session in the upper third of its intra-day range. That signaled it may be finding support, however any more damaging losses would trigger a more worrisome technical sell signal.CAMT was highlighted in yellow with pivot point cited based on its 4/13/21 high plus 10 cents in the 4/28/21 mid-day report (read here). It was last shown in this FSU section on 6/01/21 with an annotated graph included under the headline, "Perched at 52-Week High After 4th Consecutive Gain".
CAMT reported earnings +267% on +90% sales revenues for the Mar '21 quarter versus the year ago period, its 3rd strong quarterly comparison well above the +25% minimum guideline (C criteria) and showing impressive sequential acceleration. This Israeli Electronics firm has a strong annual earnings (A criteria) history. It has a 96 Earnings Per Share Rating.
The number of top-rated funds owning its shares rose from 48 in Jun '20 to 93 on Mar '21 a reassuring sign concerning the I criteria. Its current Up/Down Volume Ratio of 0.9 is an unbiased indication its shares have been under slight distributional pressure over the past 50 days. It completed a new Public Offering on 11/19/20. Still, its small supply of only 43.3 million shares outstanding (S criteria) can contribute to greater price volatility in the event of institutional buying or selling. It has a Timeliness Rating of B and a Sponsorship Rating of C.
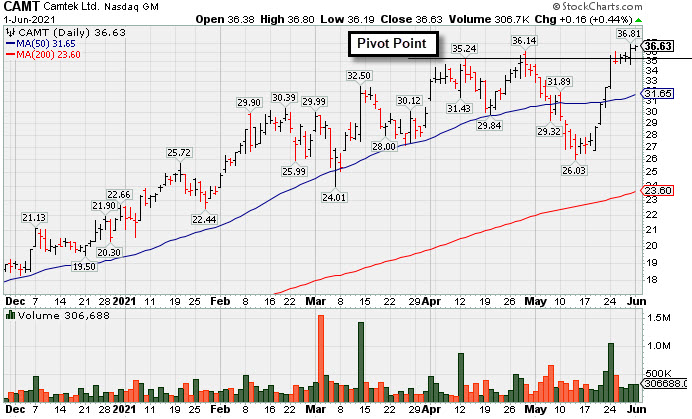
Perched at 52-Week High After 4th Consecutive Gain - Tuesday, June 1, 2021
Camtek Ltd (CAMT +$0.16 or +0.44% to $36.63) is perched at its 52-week high after today's 4th consecutive gain with average volume. It abruptly rebounded above its 50-day moving average (DMA) line ($31.65) toward the prior high.CAMT was highlighted in yellow with pivot point cited based on its 4/13/21 high plus 10 cents in the 4/28/21 mid-day report (read here). An annotated graph was included that evening under the headline, "Earnings Acceleration and Perched at High After Ascending Base".
CAMT reported earnings +267% on +90% sales revenues for the Mar '21 quarter versus the year ago period, its 3rd strong quarterly comparison well above the +25% minimum guideline (C criteria) and showing impressive sequential acceleration. This Israeli Electronics firm has a strong annual earnings (A criteria) history. It has a 96 Earnings Per Share Rating.
The number of top-rated funds owning its shares rose from 48 in Jun '20 to 90 on Mar '21 a reassuring sign concerning the I criteria. Its current Up/Down Volume Ratio of 1.2 is an unbiased indication its shares have been under accumulation over the past 50 days. It completed a new Public Offering on 11/19/20. Still, its small supply of only 43.3 million shares outstanding (S criteria) can contribute to greater price volatility in the event of institutional buying or selling. It has a Timeliness Rating of B and a Sponsorship Rating of B.
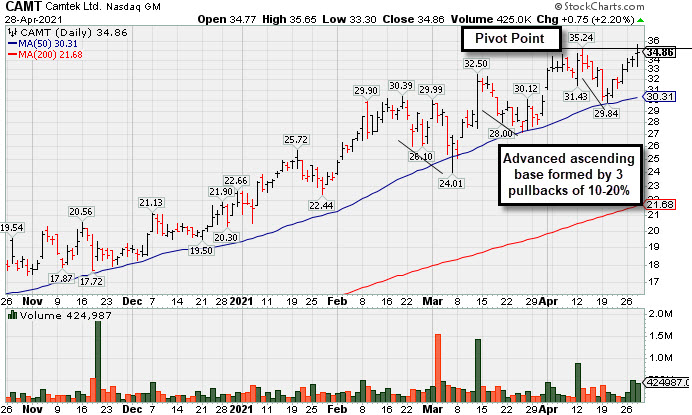
Earnings Acceleration and Perched at High After Ascending Base - Wednesday, April 28, 2021
Camtek Ltd (CAMT +$0.75 or +2.20% to $34.86) was highlighted in yellow with pivot point cited based on its 4/13/21 high plus 10 cents in the earlier mid-day report (read here). After forming an advanced "ascending base" pattern it touched a new all-time high with today's 4th consecutive gain backed by ever-increasing volume. Subsequent gains and a strong close above the pivot point backed by at least +40% above average volume may trigger a technical buy signal. It found prompt support near its 50-day moving average (DMA) line ($30.31) during recent consolidations.CAMT reported earnings +267% on +90% sales revenues for the Mar '21 quarter versus the year ago period, its 3rd strong quarterly comparison well above the +25% minimum guideline (C criteria) and showing impressive sequential acceleration. This Israeli Electronics firm has a strong annual earnings (A criteria) history. It has a 96 Earnings Per Share Rating.
The number of top-rated funds owning its shares rose from 48 in Jun '20 to 87 on Mar '21 a reassuring sign concerning the I criteria. Its current Up/Down Volume Ratio of 1.3 is an unbiased indication its shares have been under accumulation over the past 50 days. It completed a new Public Offering on 11/19/20. Still, its small supply of only 43.3 million shares outstanding (S criteria) can contribute to greater price volatility in the event of institutional buying or selling. It has a Timeliness Rating of A and a Sponsorship Rating of B.