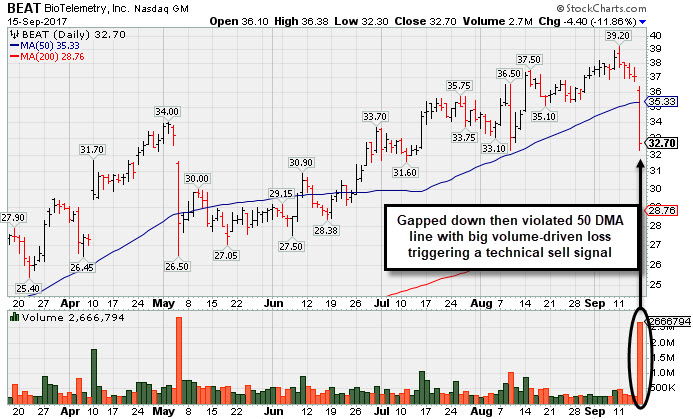
Damaging Loss Triggered Technical Sell Signal - Friday, September 15, 2017
BioTelemetry Inc (BEAT -$4.40 or -11.86% to $32.70) gapped down today and abruptly violated its 50-day moving average (DMA) line ($35.34) triggering a technical sell signal. It will be dropped from the Featured Stocks list tonight. It was repeatedly noted in recent weeks - "Fundamental concerns remain. Jun '17 quarterly earnings rose +10% on +10% sales revenues, its 2nd consecutive quarterly comparison below the +25% minimum earnings guideline (C criteria). Its 50 DMA line defines near-term support above prior highs in the $34 area."
BEAT was last shown in this FSU section on 8/17/17 with an annotated graph under the headline, ".Technically Strong Despite Recent Fundamental Concerns ".It currently has a Timeliness Rating of B and a Sponsorship Rating of C. It traded up as much as +56.18% since highlighted in yellow with pivot point cited based on its 10/05/16 high plus 10 cents in the 2/14/17 mid-day report (read here).
Its current Up/Down Volume Ratio of 1.4 is an unbiased indication its shares have been under accumulation over the past 50 days. The number of top-rated funds owning its shares rose from 194 in Dec '15 to 283 in Jun '17. Increasing ownership by top-rated funds is a reassuring sign concerning the I criteria, and it has a small supply (S criteria) of only 28.7 million shares outstanding.
Charts used courtesy of www.stockcharts.com
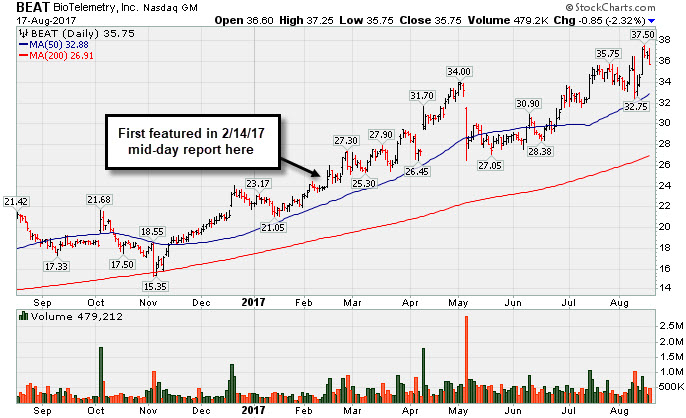
Technically Strong Despite Recent Fundamental Concerns - Thursday, August 17, 2017
BioTelemetry Inc (BEAT-$0.85 or -2.32% to $35.75) is perched near its all-time high, in technically strong shape. However, fundamental concerns have been raised, as Jun '17 quarterly earnings rose +10% on +10% sales revenues, its 2nd consecutive quarterly comparison below the +25% minimum earnings guideline (C criteria). Its 50-day moving average (DMA) line ($32.88) defines near-term support along with recent lows.
Bullish action has continued even though it recently raised fundamental concerns with sub par earnings news. BEAT was last shown in this FSU section on 7/14/17 with an annotated graph under the headline, "New Highs on Twice Average Volume; Fundamental Concerns Remain". It currently has a Timeliness Rating of B and a Sponsorship Rating of B. It traded up as much as +49.4% since highlighted in yellow with pivot point cited based on its 10/05/16 high plus 10 cents in the 2/14/17 mid-day report (read here).
Its current Up/Down Volume Ratio of 1.9 is an unbiased indication its shares have been under accumulation over the past 50 days. The number of top-rated funds owning its shares rose from 194 in Dec '15 to 280 in Jun '17. Increasing ownership by top-rated funds is a reassuring sign concerning the I criteria, and it has a small supply (S criteria) of only 28.7 million shares outstanding.
Charts used courtesy of www.stockcharts.com
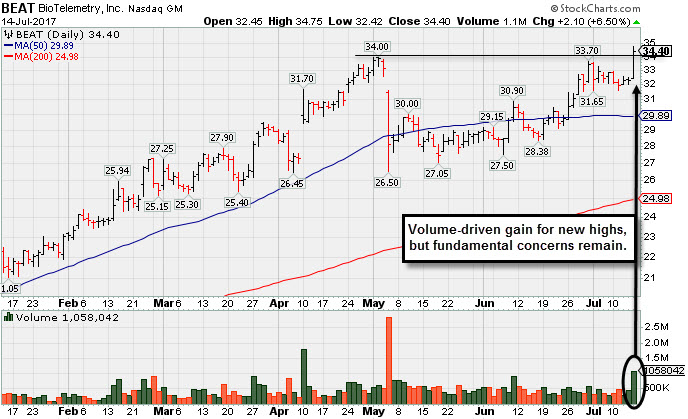
New Highs on Twice Average Volume; Fundamental Concerns Remain - Friday, July 14, 2017
BioTelemetry Inc (BEAT +$2.10 or +6.50% to $34.40) hit a new high with twice its average daily volume behind today's big gain. Bullish action has continued even though it recently raised fundamental concerns with sub par Mar '17 earnings -20% from the year ago period. Its 50-day moving average (DMA) line ($29.89) and prior lows in the $26.50 - $27.00 area define near-term support levels to watch.
BEAT was last shown in this FSU section on 6/01/17 with an annotated graph under the headline, "Lingering Below 50-Day Moving Average Line". It currently has a Timeliness Rating of C and a Sponsorship Rating of B. It traded up as much as +38.4% since highlighted in yellow with pivot point cited based on its 10/05/16 high plus 10 cents in the 2/14/17 mid-day report (read here).
Its current Up/Down Volume Ratio of 1.1 is an unbiased indication its shares have been under slight accumulation over the past 50 days. The number of top-rated funds owning its shares rose from 194 in Dec '15 to 278 in Jun '17. Increasing ownership by top-rated funds is a reassuring sign concerning the I criteria, and it has a small supply (S criteria) of only 28.7 million shares outstanding.
Charts used courtesy of www.stockcharts.com
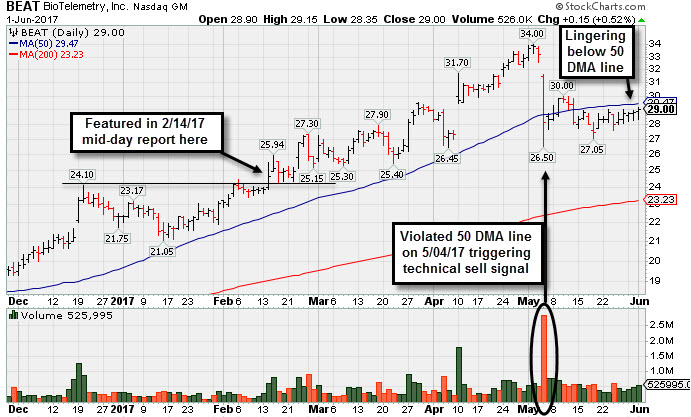
Lingering Below 50-Day Moving Average Line - Thursday, June 1, 2017
BioTelemetry Inc (BEAT +$0.15 or +0.52% to $29.00) has met resistance at its 50-day moving average (DMA) line recently when trying to rebound. Prior lows in the $26.50 - $27.00 area define the next level of support.
Volume and volatility often increase near earnings news. It reported earnings -20% on +15% sales revenues for the Mar '17 quarter versus the year ago period, raising fundamental concerns, then abruptly pulled back from all-time high territory with a big loss on heavy volume violating its 50 DMA line.
BEAT was last shown in this FSU section on 5/13/17 with an annotated graph under the headline, "Extended From Sound Base and Earnings Below +25% Guideline. It traded up as much as +35.4% since highlighted in yellow with pivot point cited based on its 10/05/16 high plus 10 cents in the 2/14/17 mid-day report (read here).
Its current Up/Down Volume Ratio of 1.4 is an unbiased indication its shares have been under accumulation over the past 50 days. The number of top-rated funds owning its shares rose from 194 in Dec '15 to 280 in Mar '17. Increasing ownership by top-rated funds is a reassuring sign concerning the I criteria, and it has a small supply (S criteria) of only 28.7 million shares outstanding.
Charts used courtesy of www.stockcharts.com
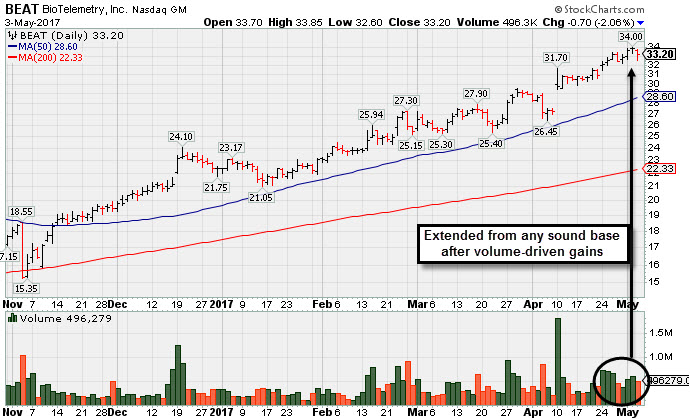
Extended From Sound Base and Earnings Below +25% Guideline - Wednesday, May 3, 2017
BioTelemetry Inc (BEAT -$0.70 or -2.06% to $33.20) pulled back from all-time high territory with a loss today on average volume. After the close it reported earnings -20% on +15% sales revenues for the Mar '17 quarter, below the +25% minimum earnings guideline (C criteria), raising fundamental concerns. Volume and volatility often increase near earnings news.
Prior earnings growth was much stronger. Members were repeatedly reminded in recent weeks - "It is extended from its prior base. Disciplined investors avoid chasing extended stocks. Prior highs in the $24 area and its 50-day moving average (DMA) line ($28.60) define important near-term support to watch."
BEAT was last shown in this FSU section on 4/03/17 with an annotated graph under the headline, "Perched Near High, Extended From Prior Base". It traded up as much as +48.4% since first highlighted in yellow with pivot point cited based on its 10/05/16 high plus 10 cents in the 12/19/16 mid-day report (read here).
Its current Up/Down Volume Ratio of 1.8 is an unbiased indication its shares have been under accumulation over the past 50 days. The number of top-rated funds owning its shares rose from 194 in Dec '15 to 276 in Mar '17. Increasing ownership by top-rated funds is a reassuring sign concerning the I criteria, and it has a small supply (S criteria) of only 28.1 million shares outstanding.
Charts used courtesy of www.stockcharts.com
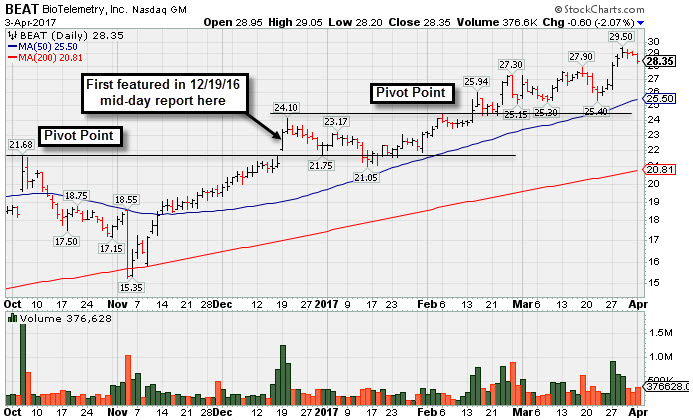
Perched Near High, Extended From Prior Base - Monday, April 3, 2017
BioTelemetry Inc (BEAT -$0.60 or -2.07% to $28.35) pulled back from all-time high territory with a 3rd consecutive small loss. It is extended from its prior base. Disciplined investors avoid chasing extended stocks. Prior highs in the $24 area and its 50-day moving average (DMA) line ($25.50) define important near-term support to watch.
BEAT was last shown in this FSU section on 2/21/17 with an annotated graph under the headline, "Perched Near All-Time High With Earnings Report Due". It was highlighted in yellow in the 2/14/17 mid-day report with new pivot point cited based on its 2/06/17 high plus 10 cents after a saucer-with-handle base above its prior base (read here). The gain above its pivot point was backed by +121% above average volume triggering a new (or add-on) technical buy signal. It was first highlighted in yellow with pivot point cited based on its 10/05/16 high plus 10 cents in the 12/19/16 mid-day report (read here).
On 2/22/17 it reported Dec '16 quarterly earnings +52% on +15% sales revenues, continuing its strong earnings track record. It has the highest possible Earnings Per Share Rating of 99, well above the 80+ minimum guideline for buy candidates. Its quarterly and annual earnings history is a good match with the C and A criteria. Earnings per share rose +200%, +233%, +67%, and +62% in the Dec '15, Mar, Jun and Sep '16 quarters, respectively. During that same span the sales revenues increases were +7%, +12%, +18%, and +22%, showing encouraging acceleration.
Its current Up/Down Volume Ratio of 1.7 is an unbiased indication its shares have been under accumulation over the past 50 days. The number of top-rated funds owning its shares rose from 194 in Dec '15 to 274 in Dec '16.Increasing ownership by top-rated funds is a reassuring sign concerning the I criteria, and it has a small supply (S criteria) of only 28.4 million shares outstanding.
Charts used courtesy of www.stockcharts.com
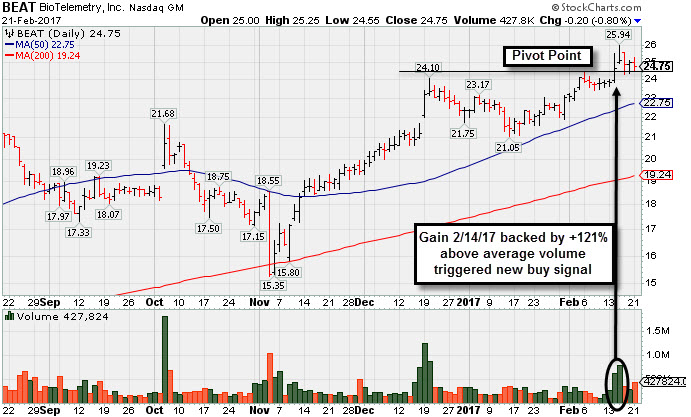
Perched Near All-Time High With Earnings Report Due - Tuesday, February 21, 2017
BioTelemetry Inc (BEAT -$0.20 or -0.80% to $24.75) was highlighted in yellow in the 2/14/17 mid-day report with new pivot point cited based on its 2/06/17 high plus 10 cents after a saucer-with-handle base above its prior base (read here). The gain above its pivot point was backed by +121% above average volume triggering a new (or add-on) technical buy signal.
Following the close on Wednesday, February 22nd it is due to report Dec '16 quarter earnings news. Volume and volatility often increase near earnings news. Prior highs in the $24 area and its 50-day moving average (DMA) line ($22.75) define important near-term support. Disciplined investors know to never chase stocks and buy them more than +5% above prior highs, and to preserve capital they always sell any stock that falls more than -8% from their purchase price.
Following the close on Wednesday, February 22nd it is due to report Dec '16 quarter earnings news. Volume and volatility often increase near earnings news. Prior highs in the $24 area and its 50-day moving average (DMA) line ($22.75) define important near-term support. Disciplined investors know to never chase stocks and buy them more than +5% above prior highs, and to preserve capital they always sell any stock that falls more than -8% from their purchase price.
BEAT was last shown in this FSU section on 1/10/17 with an annotated graph under the headline, "Volume Totals Cooling While Consolidating Above Prior Highs". It was first highlighted in yellow with pivot point cited based on its 10/05/16 high plus 10 cents in the 12/19/16 mid-day report (read here). During its consolidation it found prompt support near its 200-day moving average (DMA) line, a reassuring sign that institutional owners stepped up near that long-term average.
It has the highest possible Earnings Per Share Rating of 99, well above the 80+ minimum guideline for buy candidates. Its quarterly and annual earnings history is a good match with the C and A criteria. Earnings per share rose +200%, +233%, +67%, and +62% in the Dec '15, Mar, Jun and Sep '16 quarters, respectively. During that same span the sales revenues increases were +7%, +12%, +18%, and +22%, showing encouraging acceleration.
Its current Up/Down Volume Ratio of 1.6 is an unbiased indication its shares have been under accumulation over the past 50 days. The number of top-rated funds owning its shares rose from 194 in Dec '15 to 267 in Sep '16.Increasing ownership by top-rated funds is a reassuring sign concerning the I criteria, and it has a small supply (S criteria) of only 28.2 million shares outstanding.
Charts used courtesy of www.stockcharts.com
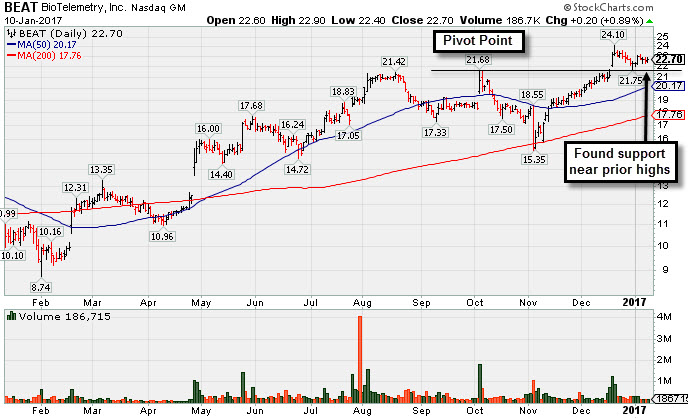
Volume Totals Cooling While Consolidating Above Prior Highs - Tuesday, January 10, 2017
BioTelemetry Inc (BEAT +$0.20 or +0.89% to $22.70) is consolidating near its "max buy" level with volume totals cooling. Disciplined investors know to never chase stocks and buy them more than +5% above prior highs, and to preserve capital they always sell any stock that falls more than -8% from their purchase price.
Prior highs in the $21-22 area define initial support to watch above its 50-day moving average (DMA) line ($20.17). Volume totals have generally been cooling since it was last shown in this FSU section on 12/19/16 with an annotated graph under the headline, "Breakaway Gap Technically Clears 11-Week V Shaped Base". It was first highlighted in yellow with pivot point cited based on its 10/05/16 high plus 10 cents in the 12/19/16 mid-day report (read here).
It finished strong with +350% above average volume behind its gain after gapping up hitting a new 52-week high (N criteria). It rose from an 11-week "V shaped pattern, which is not as ideal as a more orderly base pattern. During its consolidation it found prompt support near its 200-day moving average (DMA) line, a reassuring sign that institutional owners stepped up near that long-term average.
It has the highest possible Earnings Per Share Rating of 99, well above the 80+ minimum guideline for buy candidates. Its quarterly and annual earnings history is a good match with the C and A criteria. Earnings per share rose +200%, +233%, +67%, and +62% in the Dec '15, Mar, Jun and Sep '16 quarters, respectively. During that same span the sales revenues increases were +7%, +12%, +18%, and +22%, showing encouraging acceleration.
The number of top-rated funds owning its shares rose from 194 in Dec '15 to 261 in Sep '16.Increasing ownership by top-rated funds is a reassuring sign concerning the I criteria, and it has a small supply (S criteria) of only 28.2 million shares outstanding.
Charts used courtesy of www.stockcharts.com
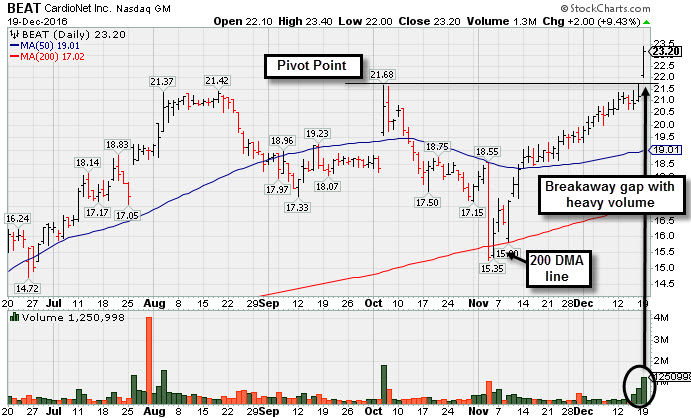
Breakaway Gap Technically Clears 11-Week V Shaped Base - Monday, December 19, 2016
BioTelemetry Inc (BEAT +$2.00 or +9.43% to $23.20) was highlighted in yellow with pivot point cited based on its 10/05/16 high plus 10 cents in the earlier mid-day report (read here). It finished strong with +350% above average volume behind its gain after gapping up today, hitting a new 52-week high (N criteria). It rose from an 11-week "V shaped pattern, which is not as ideal as a more orderly base pattern. It found prompt support near its 200-day moving average (DMA) line, a reassuring sign that institutional owners stepped up near that long-term average.
It has the highest possible Earnings Per Share Rating of 99, well above the 80+ minimum guideline for buy candidates. Its quarterly and annual earnings history is a good match with the C and A criteria. Earnings per share rose +200%, +233%, +67%, and +62% in the Dec '15, Mar, Jun and Sep '16 quarters, respectively. During that same span the sales revenues increases were +7%, +12%, +18%, and +22%, showing encouraging acceleration.
The number of top-rated funds owning its shares rose from 194 in Dec '15 to 259 in Sep '16.Increasing ownership by top-rated funds is a reassuring sign concerning the I criteria, and it has a small supply (S criteria) of only 28.2 million shares outstanding. Disciplined investors know to never chase stocks and buy them more than +5% above prior highs, and to preserve capital they always sell any stock that falls more than -8% from their purchase price.