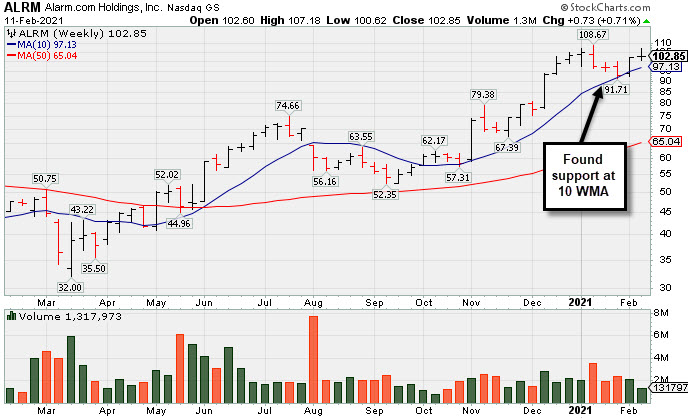
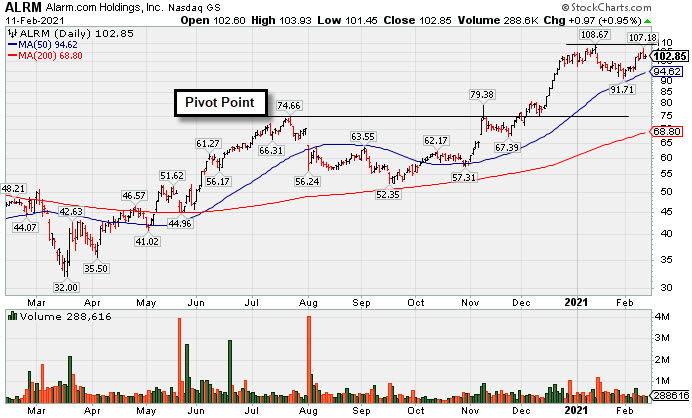
Perched Near Prior High After Finding Support at 10 WMA - Thursday, February 11, 2021
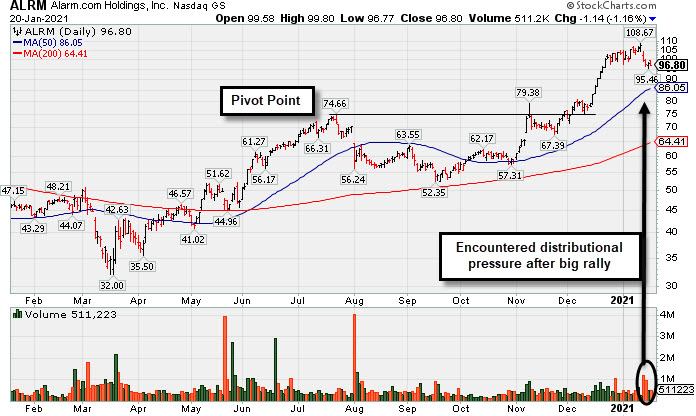
Encountered Distributional Pressure After Big Rally - Wednesday, January 20, 2021
Perched at High After Impressive Streak of Gains - Thursday, December 24, 2020
Alarm Hits a New Record High - Friday, December 4, 2020
Encountered Distributional Pressure as it Hit a New High - Monday, November 9, 2020
Technical and Fundamental Concerns Both Sound Alarms - Monday, May 13, 2019
Consolidating Near 50-Day Average Following Sub Par Report - Friday, March 29, 2019
Volume Totals Cooling While Perched at All-Time High - Wednesday, February 20, 2019
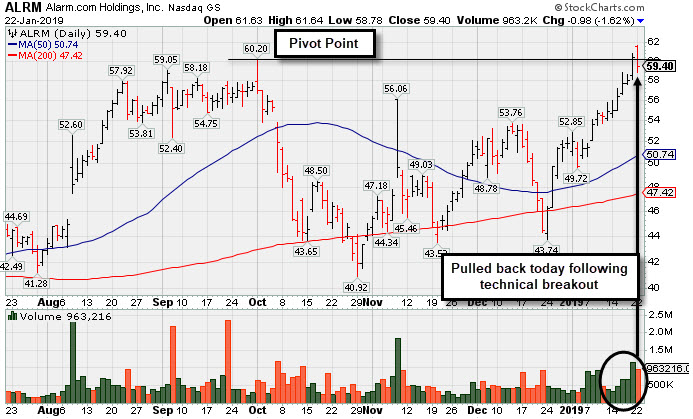
Pullback Broke Steak of Gains and Reversed From New High - Tuesday, January 22, 2019
Perched Near Prior High After Finding Support at 10 WMA - Thursday, February 11, 2021
Alarm.com Holdings Inc (ALRM +$0.97 or +0.95% to $102.85) has been rebounding toward its prior high. Today's gain was backed by below average volume. Its color code was recently changed to yellow as it was noted that a valid secondary buy point exists up to 5% above the prior high since it found support at its 10 week moving average (WMA) line ($97.13). Below are weekly and daily graphs which illustrate how it stayed well above the 50-day moving average (DMA) line while it truly tested the 10 WMA line and found support.
It currently has a 91 Earnings Per Share Rating. Keep in mind the company is due to report Dec '20 quarterly results on 2/25/21. Volume and volatility often increase near earnings news. ALRM reported earnings +32% on +24% sales revenues for the Sep '20 quarter versus the year ago period, an improvement after +3% earnings in the Jun quarter. Prior quarterly comparisons were near or above the +25% minimum earnings guideline (C criteria). Annual earnings (A criteria) growth has been strong, a good match with the fact-based investment system.
ALRM has traded up as much as +51.2% since it was highlighted in yellow in the 11/06/20 mid-day report (read here). It was last shown in this FSU section on 1/20/21 with an annotated graph under the headline, "Encountered Distributional Pressure After Big Rally". The number of top-rated funds owning its shares rose from 262 in Mar '18 to 404 in Dec '20, a reassuring sign concerning the I criteria. Its current Up/Down Volume Ratio of 1.2 is an unbiased indication its shares have been under accumulation over the past 50 days. It has earned a Timeliness Rating of B and a Sponsorship Rating of C.
Charts courtesy of www.stockcharts.com
Encountered Distributional Pressure After Big Rally - Wednesday, January 20, 2021
Alarm.com Holdings Inc (ALRM -$1.14 or -1.16% to $96.80) suffered a loss today after trying to rebound toward its all-time high. It is very extended from any sound base and it has encountered distributional pressure after a big rally. Its 50-day moving average (DMA) line ($86.05) defines initial support to watch on pullbacks.
Recently ALRM reported earnings +32% on +24% sales revenues for the Sep '20 quarter versus the year ago period, an improvement after +3% earnings in the Jun quarter. Prior quarterly comparisons were near or above the +25% minimum earnings guideline (C criteria). Annual earnings (A criteria) growth has been strong, a good match with the fact-based investment system.
ALRM has traded up as much as +51.2% since it was highlighted in yellow in the 11/06/20 mid-day report (read here). It was last shown in this FSU section on 12/24/20 with an annotated graph under the headline, "Perched at High After Impressive Streak of Gains". . he number of top-rated funds owning its shares rose from 262 in Mar '18 to 401 in Dec '20, a reassuring sign concerning the I criteria. Its current Up/Down Volume Ratio of 1.4 is an unbiased indication its shares have been under accumulation over the past 50 days. It has earned a Timeliness Rating of B and a Sponsorship Rating of D.
Charts courtesy of www.stockcharts.com
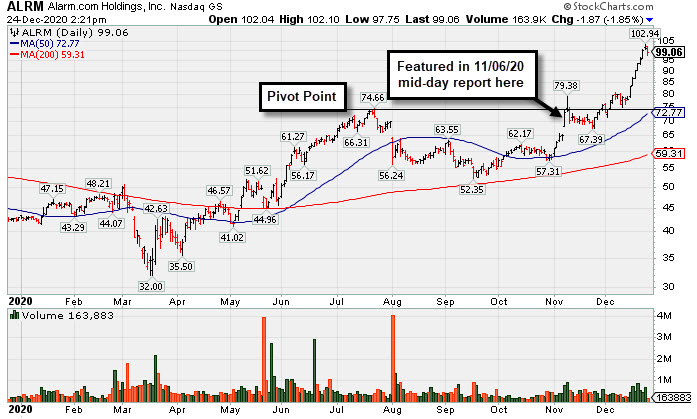
Perched at High After Impressive Streak of Gains - Thursday, December 24, 2020
Alarm.com Holdings Inc (ALRM -$2.05 or -2.03% to $98.88) pulled back from its all-time high with today's loss breaking a streak of 8 consecutive gains. It is very extended from any sound base. The prior high ($74.66 on 7/23/20) defines initial support to watch above its 50-day moving average (DMA) line ($72.77). Its gain on 11/30/20 was backed by +74% above average volume as it rallied and closed above the pivot point triggering a technical buy signal.
Recently ALRM reported earnings +32% on +24% sales revenues for the Sep '20 quarter versus the year ago period, an improvement after +3% earnings in the Jun quarter. Prior quarterly comparisons were near or above the +25% minimum earnings guideline (C criteria). Annual earnings (A criteria) growth has been strong, a good match with the fact-based investment system.
ALRM has traded up as much as +42% since it was highlighted in yellow in the 11/06/20 mid-day report (read here). It was last shown in this FSU section on 12/04/20 with an annotated graph under the headline, "Alarm Hits a New Record High".
he number of top-rated funds owning its shares rose from 262 in Mar '18 to 409 in Sep '20, a reassuring sign concerning the I criteria. Its current Up/Down Volume Ratio of 2.1 is an unbiased indication its shares have been under accumulation over the past 50 days. It has earned a Timeliness Rating of B and a Sponsorship Rating of D.
Charts courtesy of www.stockcharts.com
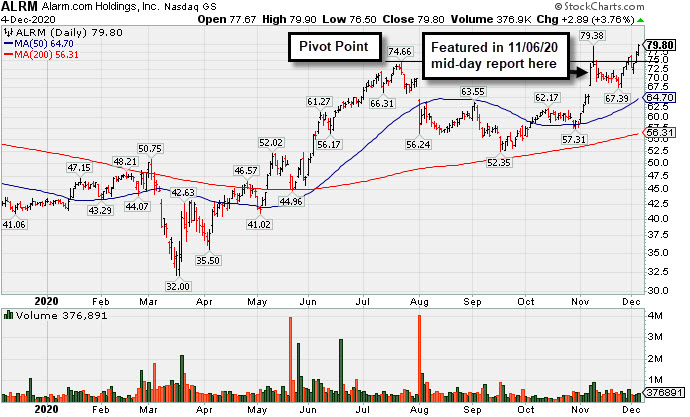
Alarm Hits a New Record High - Friday, December 4, 2020
Alarm.com Holdings Inc (ALRM +$2.89 or +3.76% to $79.80) posted a 3rd consecutive gain today with near averaage volume, rising back above its cited pivot point and hitting a new all-time high. Its gain on 11/30/20 was backed by +74% above average volume as it rallied and closed above the pivot point triggering a technical buy signal.
Recently ALRM reported earnings +32% on +24% sales revenues for the Sep '20 quarter versus the year ago period, an improvement after +3% earnings in the Jun quarter. Prior quarterly comparisons were near or above the +25% minimum earnings guideline (C criteria). Annual earnings (A criteria) growth has been strong, a good match with the fact-based investment system.
The number of top-rated funds owning its shares rose from 262 in Mar '18 to 412 in Sep '20, a reassuring sign concerning the I criteria. Its current Up/Down Volume Ratio of 1.5 is an unbiased indication its shares have been under accumulation over the past 50 days. It has earned a Timeliness Rating of A and a Sponsorship Rating of D.
Charts courtesy of www.stockcharts.com
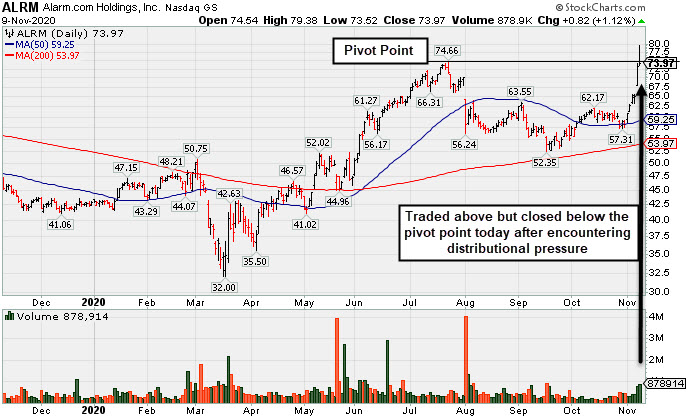
Encountered Distributional Pressure as it Hit a New High - Monday, November 9, 2020
Alarm.com Holdings Inc (ALRM +$0.82 or +1.12% to $73.97) finished the session well off of earlier highs after gapping up and rallying above the pivot point cited while hitting a new all-time high. The day's action was indicative of distributional pressure. Subsequent volume-driven gains and a close above the pivot point may help clinch a convincing technical buy signal.
Recently ALRM reported earnings +32% on +24% sales revenues for the Sep '20 quarter versus the year ago period, an improvement after +3% earnings in the Jun quarter. Prior quarterly comparisons were near or above the +25% minimum earnings guideline (C criteria). Annual earnings (A criteria) growth has been strong, a good match with the fact-based investment system.
It went through a deep and choppy consolidation since last shown in this FSU section on 5/13/19 with an annotated graph under the headline, "Technical and Fundamental Concerns Both Sound Alarms".
Annual earnings (A criteria) growth has been strong after a downturn in FY '15.
The number of top-rated funds owning its shares rose from 262 in Mar '18 to 402 in Sep '20, a reassuring sign concerning the I criteria. Its current Up/Down Volume Ratio of 1.2 is an unbiased indication its shares have been under accumulation over the past 50 days. It has earned a Timeliness Rating of B and a Sponsorship Rating of D.
Charts courtesy of www.stockcharts.com
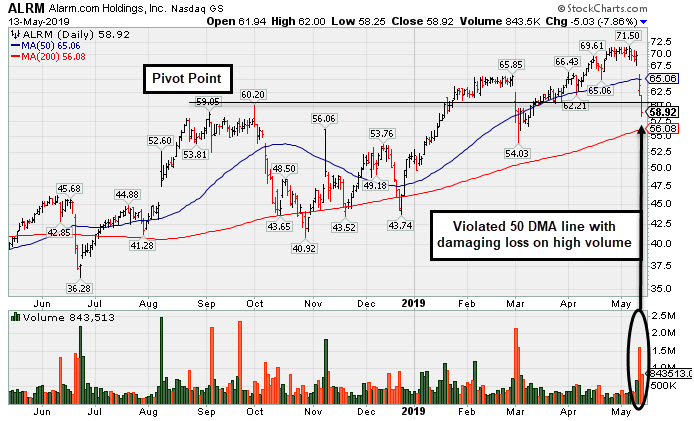
Technical and Fundamental Concerns Both Sound Alarms - Monday, May 13, 2019
Alarm.com Holdings Inc (ALRM -$5.03 or -7.86% to $58.92) gapped down today slumping further below its 50-day moving average (DMA) line ($65) with a 2nd consecutive damaging volume-driven loss. Weak action came after it reported earnings +0% on +21% sales revenues for the Mar '19 quarter, marking its 2nd consecutive quarterly comparison below the +25% minimum earnings guideline (C criteria). It will be dropped from the Featured Stocks list tonight.
It was last shown in this FSU section on 3/29/19 with an annotated graph under the headline, "Consolidating Near 50-Day Average Following Sub Par Report".
Through the Sep '18 quarter it had established a streak of 11 consecutive comparisons above the +25% minimum earnings guideline (C criteria).
ALRM was first highlighted in yellow with pivot point cited based on its 10/01/18 high plus 10 cents in the 1/22/19 mid-day report (read here). During a choppy 16-week consolidation its 200 DMA line acted as support. Annual earnings (A criteria) growth has been strong after a downturn in FY '15. It is up considerably from its $14 IPO on 6/26/15.
The number of top-rated funds owning its shares rose from 262 in Mar '18 to 355 in Mar '19, a reassuring sign concerning the I criteria. Its current Up/Down Volume Ratio of 1.2 is an unbiased indication its shares have been under accumulation over the past 50 days. It has earned a Timeliness Rating of A and a Sponsorship Rating of B.
Charts courtesy of www.stockcharts.com
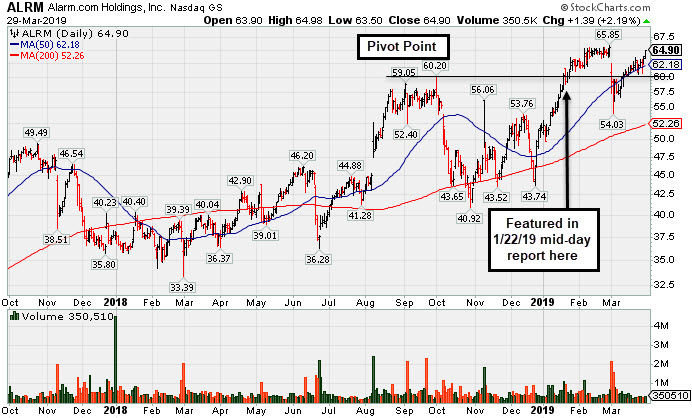
Consolidating Near 50-Day Average Following Sub Par Report - Friday, March 29, 2019
Alarm.com Holdings Inc (ALRM +$1.39 or +2.19% to $64.90) has found support near its 50-day moving average (DMA) line ($62.18). However, weak action came after it recently reported earnings +12% on +25% sales revenues for the Dec '18 quarter, below the +25% minimum earnings guideline (C criteria), raising fundamental concerns. That broke a streak of 11 consecutive comparisons above the +25% minimum earnings guideline (C criteria). Disciplined investors always avoid chasing stocks more than +5% above the prior high and always limit losses by selling any stock that falls more than -7% from their purchase price.
ALRM was first highlighted in yellow with pivot point cited based on its 10/01/18 high plus 10 cents in the 1/22/19 mid-day report (read here). During a choppy 16-week consolidation its 200 DMA line acted as support. Annual earnings (A criteria) growth has been strong after a downturn in FY '15. It is up considerably from its $14 IPO on 6/26/15.
The number of top-rated funds owning its shares rose from 262 in Mar '18 to 344 in Dec '18, a reassuring sign concerning the I criteria. Its current Up/Down Volume Ratio of 1.4 is an unbiased indication its shares have been under accumulation over the past 50 days. It has earned a Timeliness Rating of A and a Sponsorship Rating of B.
Charts courtesy of www.stockcharts.com
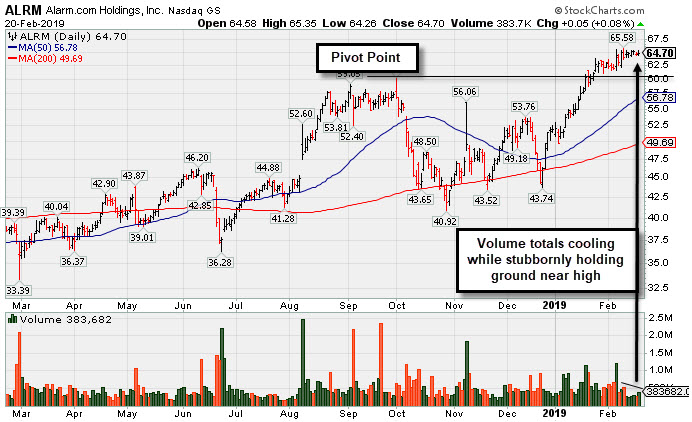
Volume Totals Cooling While Perched at All-Time High - Wednesday, February 20, 2019
Alarm.com Holdings Inc (ALRM +$0.05 or +0.08% to $64.70) has seen its volume totals cooling in recent weeks while stubbornly holding its ground perched near its all-time high. Disciplined investors always avoid chasing stocks more than +5% above the prior high and always limit losses by selling any stock that falls more than -7% from their purchase price. Prior highs in the $60 area define initial support above its 50-day moving average (DMA) line ($56.78).
ALRM was highlighted in yellow with pivot point cited based on its 10/01/18 high plus 10 cents in the 1/22/19 mid-day report (read here). During a choppy 16-week consolidation its 200 DMA line acted as support.
Recently it reported Sep '18 quarterly earnings +33% on +24% sales revenues, its 11th consecutive comparison above the +25% minimum earnings guideline (C criteria). Annual earnings (A criteria) growth has been strong after a downturn in FY '15. Up considerably from its $14 IPO on 6/26/15.
The number of top-rated funds owning its shares rose from 262 in Mar '18 to 342 in Dec '18, a reassuring sign concerning the I criteria. Its current Up/Down Volume Ratio of 1.6 is an unbiased indication its shares have been under accumulation over the past 50 days. It has earned a Timeliness Rating of A and a Sponsorship Rating of B. . During a choppy 16-week consolidation its 200 DMA line acted as support.
Charts courtesy of www.stockcharts.com
Pullback Broke Steak of Gains and Reversed From New High - Tuesday, January 22, 2019
Alarm.com Holdings Inc (ALRM -$0.98 or -1.62% to $59.40) pulled back today with volume +87% above average volume. It was highlighted in yellow with pivot point cited based on its 10/01/18 high plus 10 cents in the earlier mid-day report (read here). During a choppy 16-week consolidation its 200 DMA line acted as support. Friday's gain above the pivot point backed by +124% above average volume triggered a technical buy signal. Disciplined investors always avoid chasing stocks more than +5% above the prior high and always limit losses by selling any stock that falls more than -7% from their purchase price.
Recently it reported Sep '18 quarterly earnings +33% on +24% sales revenues, its 11th consecutive comparison above the +25% minimum earnings guideline (C criteria). Annual earnings (A criteria) growth has been strong after a downturn in FY '15. Up considerably from its $14 IPO on 6/26/15.
The number of top-rated funds owning its shares rose from 262 in Mar '18 to 332 in Dec '18. Its current Up/Down Volume Ratio of 1.9 is an unbiased sign concerning the I criteria. It has earned a Timeliness Rating of A and a Sponsorship Rating of B. . During a choppy 16-week consolidation its 200 DMA line acted as support.
Charts courtesy of www.stockcharts.com