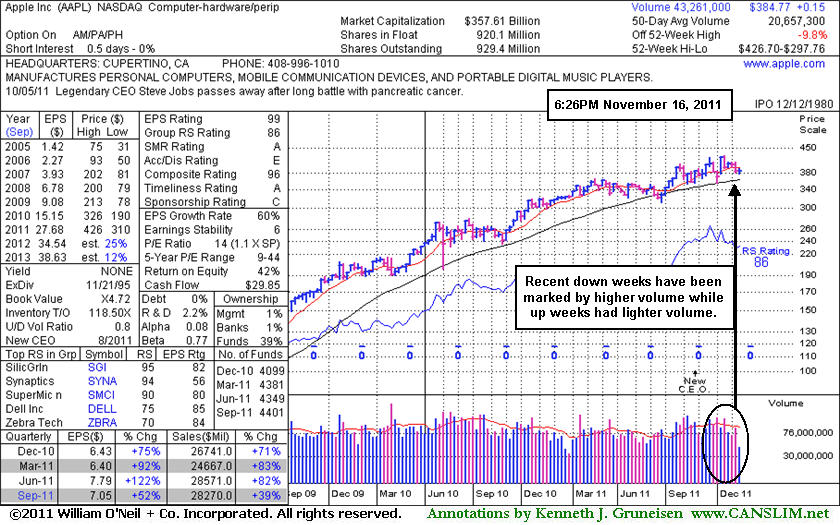
Not An Encouraging Volume Pattern On Weekly Graph - Wednesday, November 16, 2011
Prior reports have cautioned "With the largest market cap of all publicly traded firms, AAPL does not fit the mold of a small growth firm unknown by the institutional crowd which would be more typical of the winning models of the fact-based investment system."
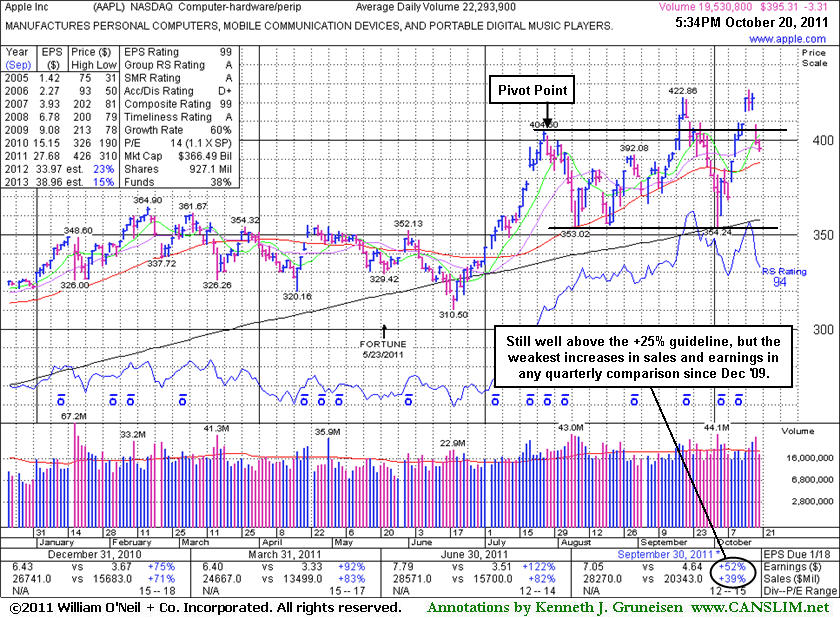
Trouble Attracting New Interest for Heavily Owned Tech Leader - Thursday, October 20, 2011
Via the Company Profile pages members can review any stock's extensive history of prior analysis and notes via a tab labeled "Featured Articles and Graphs". It is a good idea to review prior reports that have been published and do some of your own "homework" to be familiar with any companies you might maintain on an active watchlist of possible buy candidates. Ongoing coverage also acknowledges technical sell signals and flaws which might be of concern.
Apple Inc (AAPL -$3.31 or -0.83% to $395.31) fell today on lighter volume. On the prior session it gapped down after reporting earnings +52% on +39% sales revenues for the quarter ended September 30, 2011 versus the year ago period, marking the tech leader's weakest increases in sales and earnings in any quarter since the Dec '09. It has not formed a sound base pattern.
Co-founder Steve Jobs lit up headlines with news of his passing (age 56) at the time of its last appearance in this FSU section on 10/06/11 with an annotated daily graph under the the headline, "Fundamentally Strong Tech Leader Forming Possible 'Double Top'". It found support near its 200-day moving average (DMA) line and narrowly avoided undercutting the mid-point (low point) between the 2 prior chart highs, a violation which would have completed the noted double top pattern and triggered a technical sell signal. Half-hearted (volume-wise) gains actually helped it rally back again for yet another new all-time high in the interim, before its rare earnings disappointment. The miss is likely to be dismissed by many optimistic investors who are now hearing incessant media coverage of the latest iPhone release. However, disciplined investors probably did not do any recent accumulating, and they might sooner choose a fresh breakout which more closely matches the winning models of the fact-based investment system.
Prior reports have cautioned "With the largest market cap of all publicly traded firms, AAPL does not fit the mold of a small growth firm unknown by the institutional crowd which would be more typical of the winning models of the fact-based investment system." It was noted as heavily owned by the institutional crowd, with 4,374 top-rated funds reportedly owning its shares as of Jun '11. Despite such concerns, the 9/16/11 mid-day report (read here) included it highlighted in yellow with pivot point based on its 52-week high plus 10 cents, as it was cautiously noted - "A gain with at least +40% above average volume while rising above its pivot point may trigger a technical buy signal." However, powerful gains did not arrive to trigger a convincing buy signal. Also, the number of top-rated funds owning its shares has fallen to 4,331 as of Sep '11.
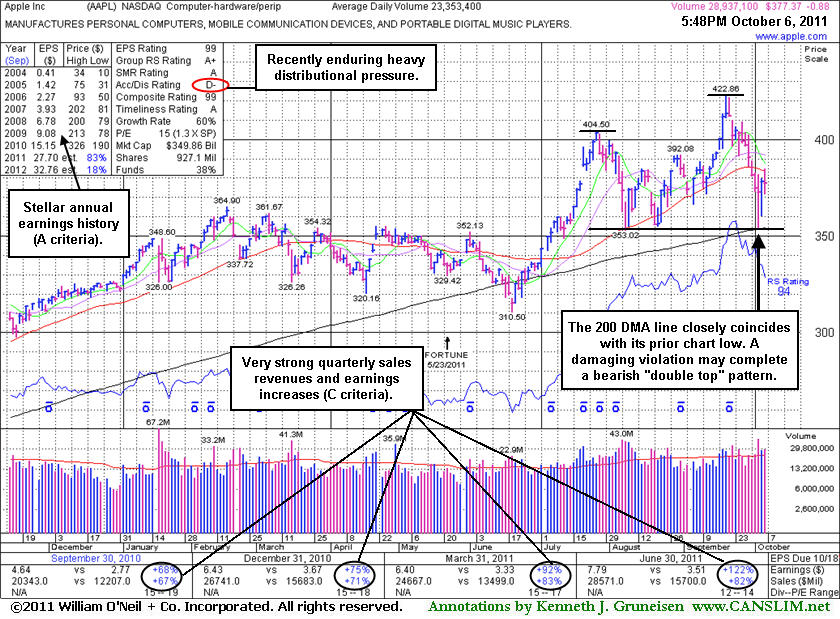
Fundamentally Strong Tech Leader Forming Possible "Double Top" - Thursday, October 06, 2011
Via the Company Profile pages members can review any stock's extensive history of prior analysis and notes via a tab labeled "Featured Articles and Graphs". It is a good idea to review prior reports that have been published and do some of your own "homework" to be familiar with any companies you might maintain on an active watchlist of possible buy candidates. Ongoing coverage also acknowledges technical sell signals and flaws which might be of concern. The annotated graph below shows a possible "double top" pattern which would be completed and trigger a technical sell signal by any violation of the mid-point (low point) between 2 prior chart highs, the second of which was higher after half-hearted (volume-wise) gains.
Apple Inc's (AAPL +$3.61 or +0.95% to $381.86) co-founder Steve Jobs lit up headlines with news of his passing at the age of 56. Shares of the well-known technology leader tried to rally but encountered resistance after rising near its 50-day moving average (DMA) line. Damaging losses triggered a technical sell signal and it tested support at its longer-term 200 DMA line this week. Prior reports cautioned "With the largest market cap of all publicly traded firms, AAPL does not fit the mold of a small growth firm unknown by the institutional crowd which would be more typical of the winning models of the fact-based investment system."
AAPL made its prior appearance in this FSU section on 9/19/11 with an annotated daily graph under the the headline, "Volume Requirement Not Met As Apple Hit New High", as it hit new 52-week and all-time highs with +35% above average volume behind a 6th consecutive gain. It had found support near its 50-day moving average (DMA) line and prior chart highs during its prior 8-week consolidation. The 9/16/11 mid-day report (read here) included it highlighted in yellow with pivot point based on its 52-week high plus 10 cents. The mid-day report earlier that day had cautiously noted - "A gain with at least +40% above average volume while rising above its pivot point may trigger a technical buy signal."
The 9/16/11 FSU analysis also told members - "Disciplined investors use a tactic called "pyramiding" to avoid chasing stocks more than +5% above prior highs. Today's gain today tested investors' discipline, and they should appreciate the volume shortfall's significance. It clearly hints that, at the late stage of the tech leader's ongoing advance, there may not be very many institutional investors willing to 'finally' turn bullish on it enough to decide to become buyers over other great growth candidates which might be more fleet footed."
AAPL recently rallied after reporting very strong earnings +122% on +82% sales revenues for the quarter ended June 30, 2011 versus the year ago period. Stellar earnings track record that solidly satisfies the C and A criteria. However, it is already heavily owned by the institutional crowd, with 4,374 top-rated funds reportedly owning its shares as of Jun '11.
It had been dropped from the Featured Stocks list on 8/20/10 after its last appearance in this FSU section (8/09/10) under the headline, "Quiet Consolidation Above 50 DMA Line". An annotated graph and detailed analysis in the 6/17/10 report under the headline "Saucy Details On Apple Worth Reviewing" summarized important details and some of the prior coverage published concerning of this long-time favorite. Members who have not followed the ongoing analysis provided should take time to review what has been written.
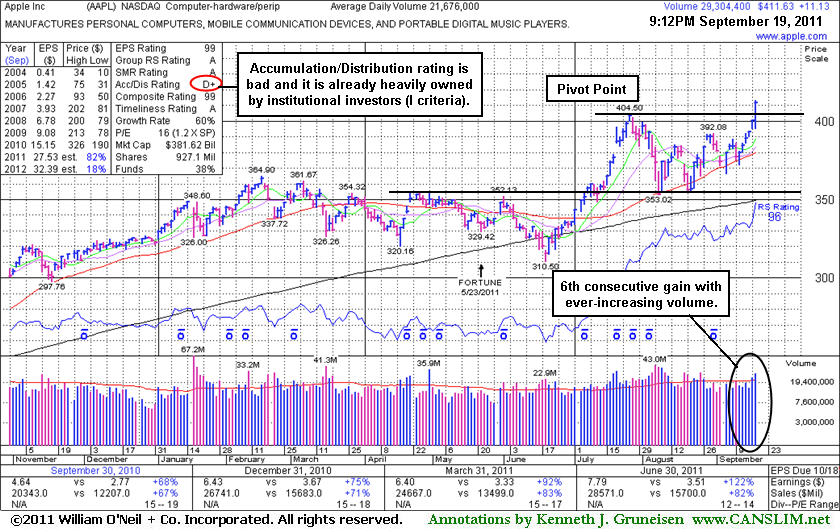
Volume Requirement Not Met As Apple Hit New High - Monday, September 19, 2011
Apple Inc (AAPL +$11.13 or +2.78% to $411.63) hit new 52-week and all-time highs with +35% above average volume behind today's 6th consecutive gain after finding support near its 50-day moving average (DMA) line and prior chart highs during its 8-week consolidation. The 9/16/11 mid-day report (read here) included it highlighted in yellow with pivot point based on its 52-week high plus 10 cents. In today's mid-day report it was again cautiously noted - "A gain with at least +40% above average volume while rising above its pivot point may trigger a technical buy signal." Disciplined investors use a tactic called "pyramiding" to avoid chasing stocks more than +5% above prior highs. Today's gain today tested investors' discipline, and they should appreciate the volume shortfall's significance. It clearly hints that, at the late stage of the tech leader's ongoing advance, there may not be very many institutional investors willing to "finally" turn bullish on it enough to decide to become buyers over other great growth candidates which might be more fleet footed.
AAPL recently rallied after reporting very strong earnings +122% on +82% sales revenues for the quarter ended June 30, 2011 versus the year ago period. Stellar earnings track record that solidly satisfies the C and A criteria. However, it is already heavily owned by the institutional crowd, and ownership by top-rated funds fell from 4,366 in Mar '11 to 4,343 in Jun '11.
It had been dropped from the Featured Stocks list on 8/20/10 after its last appearance in this FSU section (8/09/10) under the headline, "Quiet Consolidation Above 50 DMA Line". An annotated graph and detailed analysis in the 6/17/10 report under the headline "Saucy Details On Apple Worth Reviewing" summarized important details and some of the prior coverage published concerning of this long-time favorite. Members who have not followed the ongoing analysis provided should take time to review what has been written. With the largest market cap of all publicly traded firms, AAPL does not fit the mold of a small growth firm unknown by the institutional crowd which would be more typical of the winning models of the fact-based investment system.
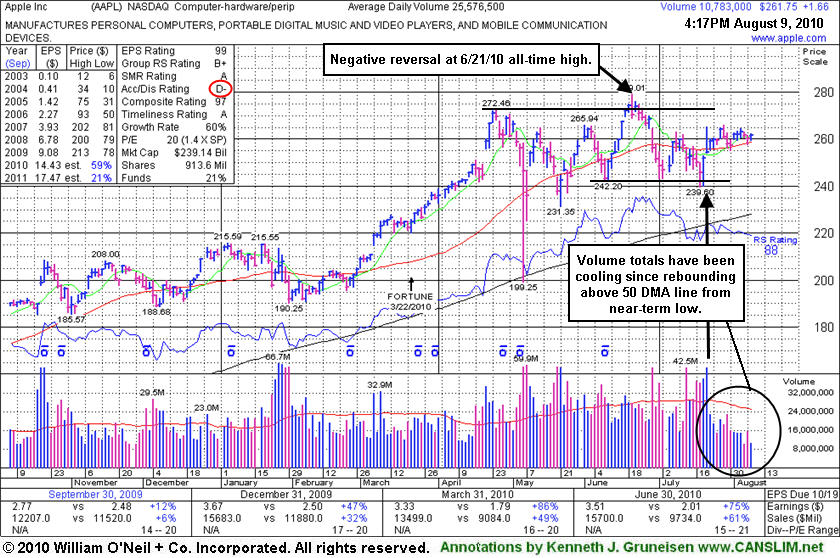
Quiet Consolidation Above 50 DMA Line - Monday, August 09, 2010
Apple Inc (AAPL +$1.66 or +0.64% to $261.75) is still quietly consolidating in a tight range just above its 50-day moving average (DMA) line. It has been 7 weeks since its negative reversal on 6/21/10 at its all-time high. Its recent chart low ($239) defines an important support level after it slightly undercut prior lows in the $242 area and then found support and rallied back above its 50 DMA line since its last appearance in this FSU section on 7/12/10 under the headline "Distributional Pressure After Failure To Trigger Buy Signal."
Recent gains lacked volume after it failed to trigger a proper technical buy signal and then encountered heavy distributional pressure following its appearance in the 6/17/10 mid-day report (read here). An annotated graph and more detailed analysis followed in that evening's report under the headline "Saucy Details On Apple Worth Reviewing". The article (linked to above) summarized important details and some of the prior coverage published concerning of this long-time favorite. Members who have not followed the ongoing analysis provided should take time to review what has been written.
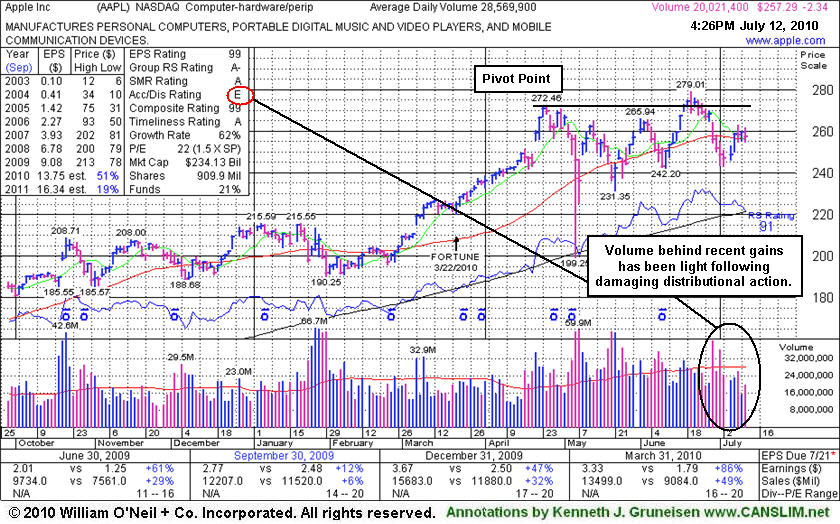
Distributional Pressure After Failure To Trigger Buy Signal - Monday, July 12, 2010
Apple Inc (AAPL -$2.34 or -0.90% to $257.29) is consolidating just above its 50-day moving average (DMA) line. Recent lows in the $242-243 area now define important chart support to watch, meanwhile it needs more time to possibly form a sound new base. Its Accumulation/Distribution rank remains at a lowest-possible E (see red circle) rating. Recent gains lacked volume after it failed to trigger a proper technical buy signal and then encountered heavy distributional pressure following its appearance in the 6/17/10 mid-day report (read here) with new pivot point cited based upon its all-time high plus ten cents. An annotated graph and more detailed analysis followed in that evening's report under the headline "Saucy Details On Apple Worth Reviewing". The article (linked to above) summarized important details and some of the prior coverage published concerning of this long-time favorite. Members who have not followed the ongoing analysis provided should take time to review what has been written.
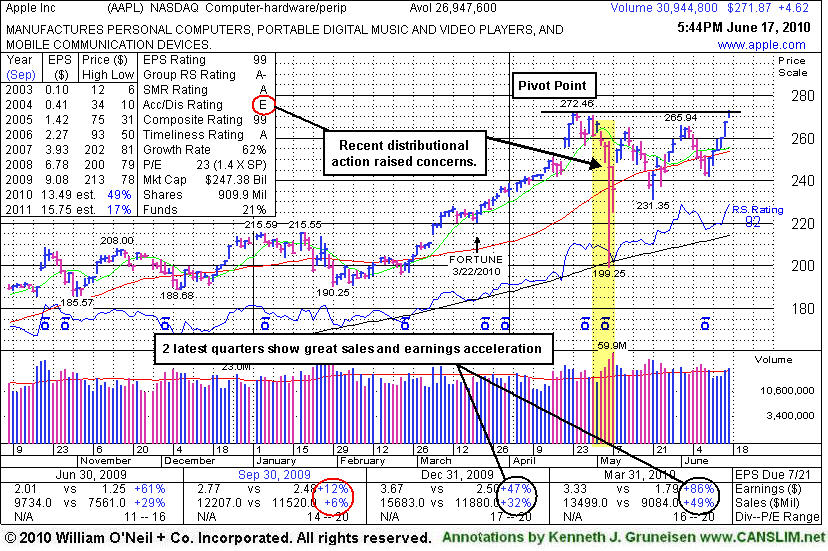
Saucy Details On Apple Worth Reviewing - Thursday, June 17, 2010
Apple Inc (AAPL +$4.62 or +1.73% to $271.87) gapped up today and touched a new all-time high with volume only +16% above average behind its 6th consecutive gain on the right side of a choppy 9-week consolidation marked by heavy distribution. It was featured earlier today in the mid-day report (read here) in yellow with new pivot point cited based upon its all-time high plus ten cents. Technically, any new breakout should be marked by heavy volume to be considered a tactically sound buy candidate under the guidelines of the fact-based system. Noted in prior mid-day reports - "It showed accelerating sales and earnings increases and rebounded impressively since 'Apple, Once Sweet, Now Rotten!' long ago headlined follow-up coverage of this previously featured favorite with a stellar annual earnings (A criteria) history."
Its 900 million shares outstanding is a huge supply (not most favorable regarding the S criteria), however that makes the fact that recent quarterly comparisons have shown impressive earnings and sales acceleration even more impressive! Quarterly growth has improved meaningfully, and it was repeatedly noted in recent mid-day reports while "again looking more like the big winning examples shown in the book 'How to Make Money in Stocks' with regard to the C criteria of the proven investment system." The latest action has been a direct result of great demand for its new iPad computer notebook-type product which is driving stronger sales and earnings growth again. A key to a company satisfying the N criteria is a hot new product or service, and a powerful breakout to new highs too! Another concern now is that the number of top-rated funds owning its shares fell from 896 in Dec '09 to 851 in Mar '10, which is not a favorable trend with respect to the I criteria. That trend is all the more reason to be watching for proof of fresh and significant institutional buying demand like the demand once shown for its shares - very important to be discussed further.
In this FSU section we have summarized prior coverage on AAPL throughout its past ups and downs. Sometimes it showed decelerating sales and earnings growth and poor technical action, with an annotated graph pointing out exactly where and why it was dropped from the Featured Stocks list on 6/27/08 - when it had closed at $170 per share. Under the headline "Can You Tell A Good Apple From A Bad Apple?" on 1/23/2009 an annotated graph accompanied the analysis after the company reported its results for the quarter ended December 31, 2008 showing only a +6% sales revenues increase and only a +1% earnings per share increase over the year earlier period - clear fundamental evidence of worrisome deterioration. We did some additional research and included an old graph of AAPL from 6/15/2004 (shown in the article linked to above) allowing everyone to take a look back in time to the days when AAPL was near the beginning of a 15-fold advance over 45 months! In March 2004, one full year after the Iraq war began and the major averages had signaled a confirmed rally with a follow-through day, institutional investors were accumulating AAPL shares. Volume did not just barely limp over the minimum +50% above average volume threshold when it broke out, but instead, volume spiked up more than +500% as the price blasted to new multi-year highs. Investors who looked at its P/E Ratio of 70 may have easily made the mistake of assuming it was dangerously "overvalued" at the time. Quarterly sales and earnings increases were showing a drastic upturn, helped by the company's hot new iPod product. Apple's current P/E Ratio of 23 is not as lofty as it was at the beginning of its great move in 2004, and also well below the P/E of other high-ranked leaders today including THOR 49, NFLX 53, BIDU 95, CRM 119, respectively.
Time will only tell if fact-based investors might be justifiably emboldened to go ahead and accumulate shares, and those with strict discipline may choose to take action when they see sound fundamental and technical reasons to do so. Institutional investors, due to the size of their positions, cannot easily or quickly move in or out of stocks without causing too much slippage. They accumulate shares of companies they like on an ongoing basis, building up to larger positions by adding to their holdings when the stock consolidates near a support level. While support promptly arrived near its long-term 200-day moving average (DMA) line during the "flash-crash" on May 6th, 2010, its fall from $272.46 to as low as $199.25 in the span of 9 trading sessions serves as a warning notice as to how quickly even a strong leader can fall in a bad market (M criteria) environment.
Here is a summary of its other Featured Stock Update section appearances in the past:
Apple's Loss Has Very Little To Do With Jobs' Health- 1/15/2009
Apple Fell -50% Since Removed From Featured Stocks List- 11/13/2008
Deep Cup Pattern Reminiscent of Some Past Tech Greats- 6/1/2008
Positive Reversal Near Important Chart Support- 1/30/2006
Market Leaders Tend to Keep on Leading- 10/20/2005
A Normal Pullback- 9/30/2005
Apple Tests Trendline- 9/28/2005
Classic Breakout Continues Higher- 9/19/2005
Can You Tell A Good Apple From A Bad Apple? - Friday, January 23, 2009
Apple Inc (AAPL $88.36) is not currently on the Featured Stocks list at CANSLIM.net, but quite a buzz was created by the story under the headline "Apple's Loss Has Very Little To Do With Jobs' Health" included on Thursday, January 15th, 2009 (read here). It summarized some of the prior coverage on AAPL and showed decelerating sales and earnings growth and poor technical action, with an annotated graph pointing out exactly where and why it was dropped from the Featured Stocks list on 6/27/08 - when it had closed at $170 per share. Now there is worse news, after this week the company reported its latest results for the quarter ended December 31, 2008 showing only a +6% sales revenues increase and only a +1% earnings per share increase over the year earlier period - clear fundamental evidence of more worrisome deterioration!
In response to a request we received this week from an institutional investor who reportedly holds an open (and profitable) short position in the stock today, we did some additional research. We found an old printout of AAPL from 6/15/2004 which is included below, allowing everyone to take a look back in time to the days when AAPL was near the beginning of a 15-fold advance over 45 months! In March 2004, one full year after the Iraq war began and the major averages had signaled a confirmed rally with a follow-through day, institutional investors were accumulating AAPL shares. Volume did not just barely limp over the minimum +50% above average volume threshold when it broke out, but instead, volume spiked up more than +500% as the price blasted to new multi-year highs. Investors who looked at its P/E Ratio of 70 may have easily made the mistake of assuming it was dangerously "overvalued" at the time. Quarterly sales and earnings increases were showing a drastic upturn, helped by the company's hot new iPod product.
Institutional investors, due to the size of their positions, cannot easily or quickly move in or out of stocks without causing too much slippage. They accumulate shares of companies they like on an ongoing basis, building up to larger positions by adding to their holdings when the stock consolidates near a support level. Of course, any astute investor with a profitable short position in a company like AAPL might be emboldened to go ahead and sell short some additional shares if or when they see sound fundamental and technical reasons to do so.
C A N S L I M | StockTalk | News | Chart | SEC | Zacks Reports | ![]()
![]()
![]()

View all notes | CANSLIM.net Company Profile
Apple's Loss Has Very Little To Do With Jobs' Health - Thursday, January 15, 2009
Apple Inc (AAPL -$1.95 or -2.29% to $83.38) gapped down today and fell on heavy volume while many pundits were focusing on the headlines surrounding CEO Steve Jobs' medical leave of absence. However, the action in AAPL has been notably unhealthy for many months while it has been trading under its 50 & 200-day moving average lines. Decelerating sales and earnings increases are a concern, however it has continued to put up better than +25% increases which still meet the minimum increase required in the investment system's guidelines. It closed the session -56.6% off its 52-week high, and it has struggled while trading as much as -17.93% lower since its last appearance in this section under the headline "Apple Fell -50% Since Removed From Featured Stocks List" (read here).
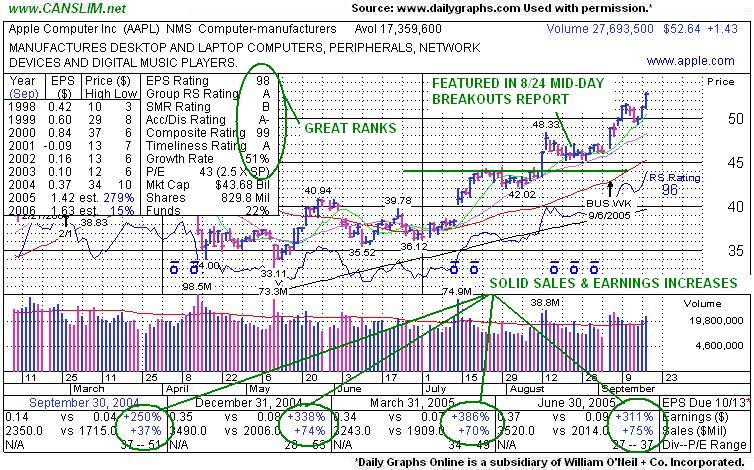
AAPL faces a tremendous amount of resistance due to overhead supply, which makes the stock unlikely to be a market leader in the near term. It failed to trigger a fresh technical buy signal and the major averages began a correction shortly after AAPL was featured in the June 2008 issue of CANSLIM.net News (read here). Based on weak technical action it was dropped from the Featured Stocks list on June 27, 2008 when it pulled back near its 200-day moving average line, as it was then observed - "It has been repeatedly noted that no volume conviction was behind its recent gains. Color code was changed to green after recent deterioration pressured it from its highs. Signs of weakness, especially due to poor market conditions, make it a less compelling buy candidate. Concerns were raised by recent distributional pressure and noted several times since it was featured" (read here). AAPL was first featured in yellow at $46.82 with an annotated graph on Wednesday, August 24, 2005 in the CANSLIM.net Mid Day Breakouts Report (read here).
C A N S L I M | StockTalk | News | Chart | SEC | Zacks Reports | ![]()
![]()
![]()
View all notes | Alert me of new notes | CANSLIM.net Company Profile
In recent weeks we have taken the opportunity to use this section to revisit some of the previously featured stocks that were dropped some time ago based on technical and fundamental weakness. Studying what happened afterwards should hopefully allow investors to get a better understanding of the importance of having a sell discipline. If you are a new investor, or simply forgot how ugly the last Bear Market was for most stocks; the current Bear Market is offering everyone another lesson on how it works. Those who might otherwise still be tempted to say, "But its a good company", and hold a losing stock after it falls more than 7-8% from their buy price have an opportunity to learn why limiting losses while they are small is so important. These well-known, high-profile companies serve now as perfect examples that will hopefully allow investors in the future to recognize the warning signs and technical sell signals so they will know when it is time to lock in profits or minimize losses per the investment system's sell rules.
Is there a previously featured stock you would like to see revisted in this section? Members are welcome and encouraged to write in and request that we take another detailed look at any of CANSLIM.net's previously featured stocks (click here).
Through the daily market commentaries provided at CANSLIM.net, we believe there has been a very clear message communicated to investors concerning the M criteria. Hopefully, you got it! If so, you reduced exposure and avoided being set back badly, saving yourself more than enough to justify the cost of your membership.
The good news for all of us is that another bull market will eventually begin, offering us the opportunity to do an even better job of following the investment system's guidelines and generate above average returns. During the first few months of a new bull market, members who continue reading the daily CANSLIM.net reports will notice the next crop of market leaders capable of producing the greatest gains. The most important thing to do, for the time being, is stay out of harm's way, preserving your capital and your confidence. We welcome your praise, criticism, suggestions, or feedback in general (simply click here) about the job we are doing.
Apple Fell -50% Since Removed From Featured Stocks List - Thursday, November 13, 2008
In recent weeks we have taken the opportunity to use this section to revisit some of the previously featured stocks that were dropped some time ago based on technical and fundamental weakness. Studying what happened afterwards should hopefully allow investors to get a better understanding of the importance of having a sell discipline. If you are a new investor, or simply forgot how ugly the last Bear Market was for most stocks; the current Bear Market is offering everyone another lesson on how it works. Those who might otherwise still be tempted to say, "But its a good company", and hold a losing stock after it falls more than 7-8% from their buy price have an opportunity to learn why limiting losses while they are small is so important. These well-known, high-profile companies serve now as perfect examples that will hopefully allow investors in the future to recognize the warning signs and technical sell signals so they will know when it is time to lock in profits or minimize losses per the investment system's sell rules.
Apple Inc. (AAPL +$6.32 or +7.01% to $96.44) bounced today, but it faces a tremendous amount of resistance due to overhead supply, which makes the stock unlikely to be a market leader in the near term. It failed to trigger a fresh technical buy signal and the major averages began a correction shortly it was featured in the June 2008 issue of CANSLIM.net News (read here). Based on weak technical action it was dropped from the Featured Stocks list on June 27, 2008 when it pulled back near its 200-day moving average line, as it was then observed - "It has been repeatedly noted that no volume conviction was behind its recent gains. Color code was changed to green after recent deterioration pressured it from its highs. Signs of weakness, especially due to poor market conditions, make it a less compelling buy candidate. Concerns were raised by recent distributional pressure and noted several times since it was featured" (read here).
AAPL went on to fall -50% in less than 4 months after it was dropped from the Featured Stocks list. AAPL was first featured in yellow at $46.82 with an annotated graph on Wednesday, August 24, 2005 in the CANSLIM.net Mid Day Breakouts Report (read here).
C A N S L I M | StockTalk | News | Chart | SEC | Zacks Reports | ![]()
![]()
![]()
Is there a previously featured stock you would like to see revisted in this section? Members are welcome and encouraged to write in and request that we take another detailed look at any of CANSLIM.net's previously featured stocks (click here).
Through the daily market commentaries provided at CANSLIM.net, we believe there has been a very clear message communicated to investors concerning the M criteria. Hopefully, you got it! If so, you reduced exposure and avoided being set back badly, saving yourself more than enough to justify the cost of your membership. The good news for all of us is that another bull market will eventually begin, offering us the opportunity to do an even better job of following the investment system's guidelines and generate above average returns. During the first few months of a new bull market, members who continue reading the daily CANSLIM.net reports will notice the next crop of market leaders capable of producing the greatest gains. The most important thing to do, for the time being, is stay out of harm's way, preserving your capital and your confidence. We welcome your praise, criticism, suggestions, or feedback in general (simply click here) about the job we are doing.
Deep Cup Pattern Reminiscent of Some Past Tech Greats - Sunday, June 01, 2008
|
Apple Inc. |
||
|
Ticker Symbol: AAPL (NASDAQ) |
Industry Group: Computer-Manufacturers |
Shares Outstanding: 881,600,000 |
|
Price: $188.75 5/30/08 close |
Day's Volume: 21,792,225 5/30/08 |
Shares in Float: 872,800,000 |
|
52 Week High: $202.96 12/27/07 |
50-Day Average Volume: 34,341,473 |
Up/Down Volume Ratio: 2.2 |
|
Pivot Point: $192.34 5/14/08 high plus .10 |
Pivot Point +5% = Max Buy Price: $201.96 |
Web Address: http://www.apple.com/ |
C A N S L I M | StockTalk | News | Chart | SEC | Zacks Reports | ![]()
![]()
![]()
View all notes | Alert me of new notes | CANSLIM.net Company Profile
CANSLIM.net Company Profile: Apple, Inc. designs, manufactures, and sells personal computers, portable digital music players, and mobile communication devices, as well as related software, services, peripherals, and networking solutions worldwide. The company's products include desktop and notebook computers, server and storage products, and related devices and peripherals; Mac OS X operating system; and iLife, a suite of software for creation and management of digital photography, music, movies, DVDs, and Web site. The company also provides Internet software and services comprising Safari, a web browser; QuickTime, a multimedia software; Mac, a suite of Internet services. In addition, it offers wireless connectivity and networking services. It was founded in 1976 and was formerly known as Apple Computer, Inc. before changing its name to Apple, Inc. in January 2007. The company is headquartered in Cupertino, California. As of March 29, 2008, the company had 208 retail stores. Apple sports a strong Earnings Per Share (EPS) rating of a 97 and a very healthy Relative Strength (RS) rating of 95. The company has a great annual earnings track record (good A criteria) and also has managed to increase its sales revenues and earnings per share by above the +25% guideline in each of the past three quarterly comparisons (solidly meeting the C criteria) versus the year earlier. AAPL resides in the Computer-Manufacturers group which is currently ranked 85th out of the 197 Industry Groups covered in the paper, placing it outside the top quartile. However, current leadership from other big-cap tech stocks is a helpful reassurance concerning the L criteria.
What to Look For and What to Look Out For: Look for AAPL to trigger a fresh technical buy signal, which could come if it rallies and closes above its pivot point with gains backed by volume of at least 52.5 million shares. Volume needs to be at least +50% above average when the stock manages to close above its pivot point in order to trigger a proper technical buy signal - the high volume behind a breakout's gains is a critical sign of institutional buying demand (the I criteria) . It would be very encouraging to see AAPL trigger a technical buy signal and continue rallying to fresh highs after a sound follow-through day is produced. However, if volume fails to meet the minimum guidelines then a proper technical buy signal would not be triggered. Avoid chasing this issue above its maximum buy price of $201.96, where it would be too extended from a sound price base. As always, it is of the utmost importance to sell a stock if it drops 7-8% below your purchase price.
Technical Analysis: Apple is currently building a very deep cup-with-handle formation that is 5 months long. There have been other cases where stocks fell by as much as 50% during their cup, especially in several tech stocks in the 1990's that traced out this type of pattern (including America Online, which was halved and quickly repaired the damage in the course of a few months during a better than 4-fold rise). The fact that the Nasdaq Composite briefly slid into bear market territory at the beginning of the year is a large part of the explanation why one could allow for such a deep cup to have formed during this period. The stock is currently building the handle portion of this pattern with a pivot point of $192.34. The stock has performed well over the past few months as the major averages, and other stocks in this group, have moved sideways. This is best illustrated by the stock's 95 Relative Strength rating. A look at its weekly chart shows limited downward action with volume in recent months, as it has not encountered distributional pressure.
Positive Reversal Near Important Chart Support - Monday, January 30, 2006
Recognizing reversal days is a great way to stay ahead of potential changes to a stock's recent trend. A positive reversal occurs when a stock opens the session heading lower, then reverses and ultimately closes the day higher. Positive reversals are often considered more significant if the stock's initial losses drive it to a new low, but it then reverses and closes the day higher on heavier than average volume and ends near the session's utmost highs. Reversals can occur on a daily, weekly or a monthly chart. In general, when a longer time frame is involved, greater implications may be given as to the severity or significance of the reversal. Volume is directly correlated with the severity of the action as well. Negative reversals are the exact opposite, and they can commonly be spotted on the chart as a stock is in the process of topping after a enjoying a considerable rise.
Apple Computer Inc. (AAPL 2.97 or 3.81% to $75.00) has spent the past two weeks pulling back, with a steady string of losses on above average volume definitely prompting some concern. It had a hard time making any further headway after printing a fresh all time high at $86.40 on January 12th, 2006. Of course, it bears mentioning that this issue had rallied an impressive +82% since appearing
on August 24th, 2005 in the CANSLIM.net's Mid-Day Breakouts Report (read here). After a rally of that magnitude a consolidation was in order. It spent the past two weeks pulling back, and it briefly violated its 50-day moving average (DMA) line. Today's positive reversal came just above an important chart support level ($70), and the gain on massive volume is a convincing indication that the bulls are regaining control. As long as volume continues to swell on up days then this issue is likely to continue advancing, however any subsequent losses on heavy volume leading to a close back under the recent chart lows and a violation of its 50 DMA would be considered worrisome technical sell signals.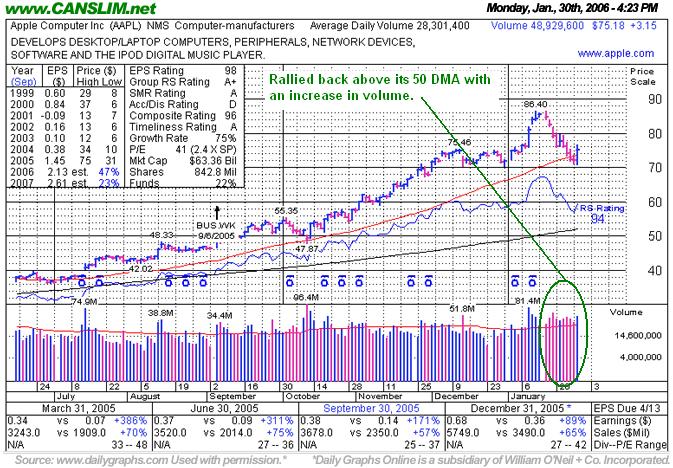
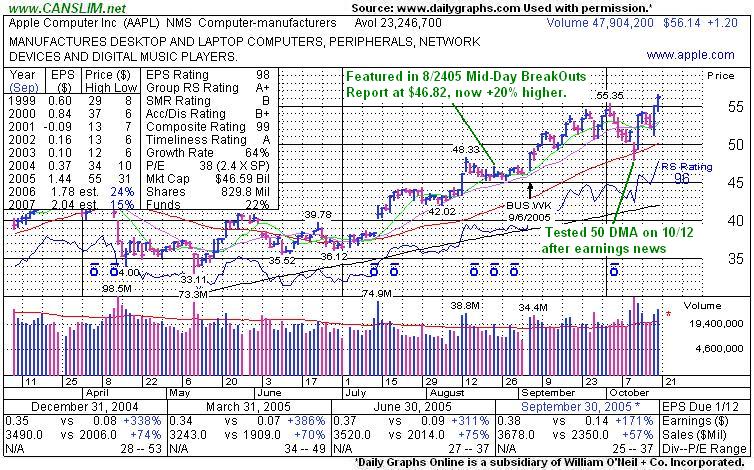
Market Leaders Tend to Keep on Leading - Thursday, October 20, 2005
Apple Computer Inc. (AAPL +$1.20 or +2.09% to $56.14) closed at a new all-time high on above average volume while the major indices closed decidedly lower. On October 12th Apple's shares pulled back in price, retesting its 50-day moving average (DMA) line after reporting its latest quarterly financial results. Despite solid earnings, sales failed to meet analysts expectations. On the very next day, however, the company reported the release of a new i-Pod that plays videos as well as music. The news of a new product created enthusiasm that helped send the stock higher.
This stock was most recently featured in yellow at $46.82 on 8/24/2005 in the CANSLIM.net Mid Day Breakouts Report and has rallied +20% since. Since retesting its 50 DMA the stock has been advancing with great volume conviction, and it broke out to a new 52-week high today. The Relative Strength line confirmed the recent move and broke out to new highs before the stock followed through to new highs on above average volume. It is encouraging to see a stock move to new highs on volume while the major indices face widespread distribution and close lower, as was the case today. Of course, leading stocks tend to keep on leading, and Apple has certainly been a market leader in the past couple of years.
C A N S L I M | StockTalk | News | Chart | SEC | Zacks Reports
A Normal Pullback - Friday, September 30, 2005
Apple Computer Inc. (AAPL +$1.27 or +2.43% to $53.61) rallied on above average volume to close in the upper half of its range and $0.04 off its session's high on Friday. Apple has been steadily rallying since it was recently featured on 8/24/2005 in the CANSLIM.net Mid Day Breakouts Report. In the Wednesday, September 28, 2005 edition of the CANSLIM.net's After Market Report (read here), Apple was pulling back towards its upward trendline. It was noted in that report that "Apple Computer gapped lower on Wednesday on above average volume to test support at its upward trendline. Leading stocks tend to pull back towards their upward trendlines to consolidate recent gains." This is exactly what transpired today. Apple's trendline (shown below) is currently acting as near term support and, thus far, this is a relatively normal pull back. However, should the selling continue and if this issue fails to find support at its upward trendline, then the next level of support is its 50 DMA. Any losses's beyond that point would constitute a technical failure and should not be tolerated."
It was encouraging to see Apple quickly repair Wednesday's gap down. It is important to note that orderly pull backs are healthy to preserve a stocks advance. A pull back helps the stock consolidate its recent gains and allows it to reassert itself for further gains.
Charts courtesy www.stockcharts.com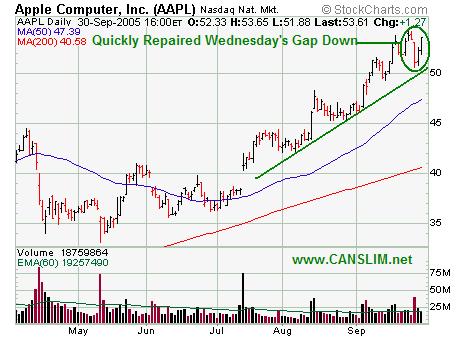
C A N S L I M | StockTalk | News | Chart | SEC | Zacks Reports
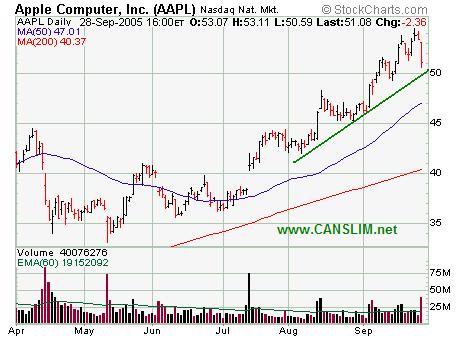
Apple Tests Trendline - Wednesday, September 28, 2005
Apple Computer Inc. (AAPL -2.36 or -4.62% to $51.08) gapped lower on Wednesday on above average volume to test support at its upward trendline. Leading stocks tend to pull back towards their upward trendlines to consolidate recent gains. This is exactly what transpired today. Apple's trendline (shown below) is currently acting as near term support and thus far this is a relatively normal pull back. However, should the selling continue and if this issue fails to find support at its upward trendline, then the next level of support is its 50 DMA. Any losses's beyond that point would constitute a technical failure and should not be tolerated.
This stock was recently featured on 8/24/2005 in the CANSLIM.net Mid Day Breakouts Report and has been rallying ever since. In the September 19, 2005 edition of CANSLIM.net's After Market Report (read here) it was noted that, "After rallying over +200% in 2004 this issue spent the first half of 2005 building a new base and consolidating. After tracing out 6-month base this issue was ready to continue marching higher. On August 12th, 2005 it blasted above its pivot point we gave of $45.54 on massive volume trigger a technical buy signal. From that point it was not a straight up run, as the stock retraced like the majority of healthy breakouts, finding good support above the prior resistance levels and continuing to trade above its pivot point.
Charts courtesy www.stockcharts.com
C A N S L I M | StockTalk | News | Chart | SEC | Zacks Reports
Classic Breakout Continues Higher - Monday, September 19, 2005