You are not logged in.
This means you
CAN ONLY VIEW reports that were published prior to Monday, April 14, 2025.
You
MUST UPGRADE YOUR MEMBERSHIP if you want to see any current reports.
AFTER MARKET UPDATE - TUESDAY, DECEMBER 29TH, 2009
Previous After Market Report Next After Market Report >>>
|
|
|
|
DOW |
-1.67 |
10,545.41 |
-0.02% |
|
Volume |
638,259,130 |
-10% |
|
Volume |
1,217,175,390 |
-4% |
|
NASDAQ |
-2.68 |
2,288.40 |
-0.12% |
|
Advancers |
1,478 |
47% |
|
Advancers |
1,342 |
47% |
|
S&P 500 |
-1.58 |
1,126.20 |
-0.14% |
|
Decliners |
1,532 |
49% |
|
Decliners |
1,359 |
47% |
|
Russell 2000 |
-0.57 |
633.18 |
-0.09% |
|
52 Wk Highs |
240 |
|
|
52 Wk Highs |
114 |
|
|
S&P 600 |
+0.03 |
337.12 |
+0.01% |
|
52 Wk Lows |
0 |
|
|
52 Wk Lows |
12 |
|
|
 |
Leadership Wanes As Indices Edge Lower On Lighter Volume
Adam Sarhan, Contributing Writer,
The major averages traded between positive and negative territory before ending the session only slightly lower while investors digested the latest round of mixed economic data. Volume, an important indicator of institutional sponsorship, was reported lower than Monday's totals which indicated large institutions were not aggressively dumping stocks. Advancers were evenly matched with a similar number of decliners on the NYSE and on the Nasdaq exchange. There were 27 high-ranked companies from the CANSLIM.net Leaders List that made a new 52-week high and appeared on the CANSLIM.net BreakOuts Page, lower than the total of 68 issues that appeared on the prior session. New 52-week highs solidly outnumbered new 52-week lows on the NYSE and on the Nasdaq exchange.
At 9:00AM EST, the S&P/Case-Shiller® home price index was released. The index is used as a proxy for the housing market and tracks monthly changes in the value of residential real estate in 20 metropolitan areas across the country. October's reading came in at 146.58 vs.September's 146.51, for a -7.3% year-on-year rate vs. a -9.4% decline in September. Housing stocks, sold off on the news which illustrates that the ailing housing market is still not out of the proverbial woods.
At 10:00AM EST, the Conference Board released an upbeat report on consumer sentiment. The Conference Board's consumer confidence index increased by 2.3 points to 52.9. The survey covers five thousand consumers across the country each month and is used as a proxy for consumer spending. Typically, stronger consumer confidence translates into stronger consumer spending but they are not directly correlated each month.
Looking at the market, the action remains constructive. The Dow Jones Industrial Average, small cap Russell 2000 Index, S&P 500 Index and Nasdaq Composite and NYSE Composite indices are all trading near fresh 2009 highs. The inverse relationship with the US dollar has eased in recent weeks as both stocks and the greenback have rallied in tandem. Ideally, one would like to see leadership and volume expand over the next few weeks as the major averages continue advancing.
Sign Up Now! A full overview of the market, the entire financial crisis, and leading/lagging stocks and sectors will be discussed in CANSLIM.net's Q4 Webcast tomorrow night! PICTURED: The benchmark S&P 500 Index closed lower on lighter volume than the prior session, quietly consolidating near 2009 highs after an impressive +69% rally up from its March lows.
|
|
|
 |
Commodity-Linked Areas Lagged On Mostly Negative Session
Kenneth J. Gruneisen - Passed the CAN SLIM® Master's Exam
Commodity-linked areas were laggards on Tuesday as the Gold & Silver Index ($XAU -1.06%), Oil Services Index ($OSX -0.87%), and Integrated Oil Index ($XOI -0.38%) drifted lower. The Healthcare Index ($HMO -0.57%) also ended with a modest loss. The Bank Index ($BKX -0.26%) and Broker/Dealer Index ($XBD -0.04%) edged lower, as did the Retail Index ($RLX -0.07%). Most tech areas also showed a slightly negative bias as the Semiconductor Index ($SOX -0.41%), Internet Index ($IIX -0.28%), and Biotechnology Index ($BTK -0.15%) posted small losses while the Networking Index ($NWX +0.09%) finished with a tiny gain.
Charts courtesy www.stockcharts.com
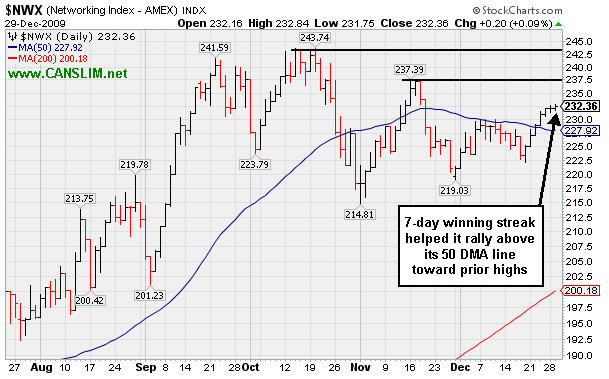
PICTURED: The Networking Index ($NWX +0.09%) has extended its winning streak to 7 sessions, and recently rallied above its 50-day moving average line toward prior chart highs.
| Oil Services |
$OSX |
196.50 |
-1.72 |
-0.87% |
+61.87% |
| Healthcare |
$HMO |
1,499.74 |
-8.53 |
-0.57% |
+56.19% |
| Integrated Oil |
$XOI |
1,076.25 |
-4.12 |
-0.38% |
+9.86% |
| Semiconductor |
$SOX |
356.18 |
-1.46 |
-0.41% |
+67.87% |
| Networking |
$NWX |
232.36 |
+0.20 |
+0.09% |
+61.48% |
| Internet |
$IIX |
235.84 |
-0.67 |
-0.28% |
+76.30% |
| Broker/Dealer |
$XBD |
115.28 |
-0.05 |
-0.04% |
+48.81% |
| Retail |
$RLX |
418.49 |
-0.27 |
-0.06% |
+49.86% |
| Gold & Silver |
$XAU |
169.47 |
-1.82 |
-1.06% |
+36.83% |
| Bank |
$BKX |
42.91 |
-0.11 |
-0.26% |
-3.18% |
| Biotech |
$BTK |
944.65 |
-1.46 |
-0.15% |
+45.97% |
|
|
|
 |
Recent Signs Of Accumulation, But No Sound Base
Kenneth J. Gruneisen - Passed the CAN SLIM® Master's Exam
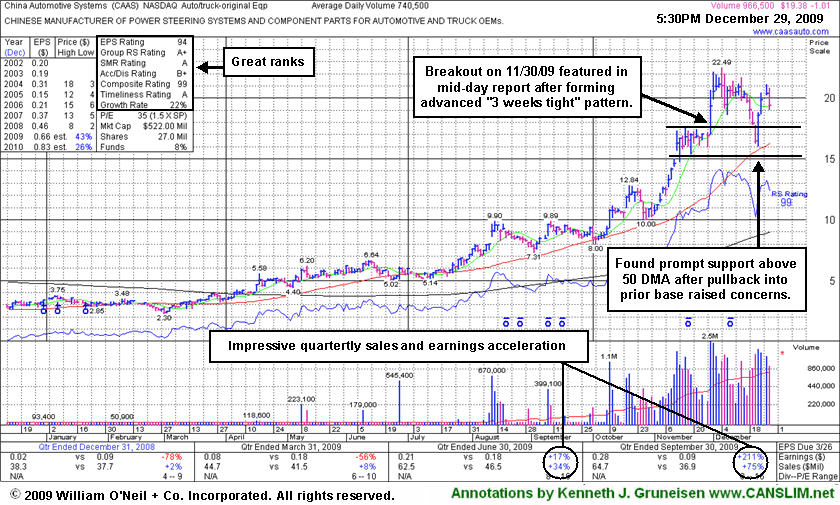
China Automotive Systems (CAAS -$1.01 or -4.95% to $19.38) fell today on lighter volume (but still above average) after 3 consecutive considerable gains backed by heavier above average volume indicated accumulation. The Chinese maker of power steering systems had briefly negated all of its bullish action since rising from an advanced "3-weeks tight" type of chart pattern. However, it found prompt support near its short-term average line and positively reversed on 12/23/09 after a gap down and pullback near support at its 50-day moving average (DMA) line. It is now extended from an ideal buy point CAAS was featured in yellow in the 11/30/09 mid-day report (read here) while it also cleared its 2004 all-time high and quickly traded more than +5% above its prior highs. The stock's prior appearance in this Featured Stock Update section on 12/11/09 under the headline "Volume Drying Up While Hovering Near All-Time Highs" warned that "it may be risky and unwise to be undisciplined about buying and chase it, yet the high-ranked leader may go on to produce more climactic gains. Caution and discipline are especially critical for investors since this stock is already up more than 8-fold from its March lows."
The daily chart below shows recent quarters with sales revenues accelerating greatly and earnings increases getting bigger, and it has a good annual earnings history (A criteria). Increasing ownership from a handful top-rated funds is encouraging news concerning the I criteria of the investment system, as the number of top-rated funds rose from 4 in Dec '09 to 9 in Sept '09. Meanwhile, the small supply of shares (S criteria) in its publicly traded float could contribute to great volatility in the event of more abrupt maneuvering by large and highly influential fund managers.
|
|
|
Color Codes Explained :
Y - Better candidates highlighted by our
staff of experts.
G - Previously featured
in past reports as yellow but may no longer be buyable under the
guidelines.
***Last / Change / Volume quote data in this table corresponds with the timestamp on the note***
Symbol/Exchange
Company Name
Industry Group |
Last |
Chg. |
Vol
% DAV |
Date Featured |
Price Featured |
Latest Pivot Point
Featured |
Status |
| Latest Max Buy Price |
ARST
-
|
$26.32
|
+0.42
|
264,729
53% DAV
496,900
|
9/1/2009
(Date
Featured) |
$19.91
(Price
Featured) |
PP = $27.20 |
Y |
| MB = $28.56 |
Most Recent Note - 12/29/2009 5:27:18 PM
Y - Still quietly hovering near all-time highs, it has been basing for 7 weeks. Color code was changed to yellow with new pivot point and max buy levels noted. ARST was first featured in yellow at $19.91 in the 9/01/09 mid-day report with an annotated daily graph (read here).
>>> The latest Featured Stock Update with an annotated graph appeared on 12/16/2009. click here.
|
|
C
A
S
I |
News |
Chart |
SEC
View all notes Alert
me of new notes
Company
Profile
|
ASIA
-
|
$30.32
|
-0.21
|
280,299
21% DAV
1,307,500
|
12/24/2009
(Date
Featured) |
$31.05
(Price
Featured) |
PP = $32.40 |
Y |
| MB = $34.02 |
Most Recent Note - 12/29/2009 5:29:05 PM
Y - Loss today on very light volume leaves it perched -6% below all-time highs. It has formed an advanced "3 weeks tight" type pattern, and color code was changed to yellow. A subsequent breakout with heavy volume is needed to confirm a new technical buy signal. Traded up as much as +68.13% since first featured in the August 2009 CANSLIM.net News (read here).
>>> The latest Featured Stock Update with an annotated graph appeared on 12/23/2009. click here.
|
|
C
A
S
I |
News |
Chart |
SEC
View all notes Alert
me of new notes
Company
Profile
|
BIDU
- NASDAQ
Baidu Inc Ads
INTERNET - Internet Information Providers
|
$419.63
|
-4.66
|
786,791
43% DAV
1,821,700
|
9/8/2009
(Date
Featured) |
$351.80
(Price
Featured) |
PP = $440.00 |
Y |
| MB = $462.00 |
Most Recent Note - 12/29/2009 5:30:33 PM
Y - Loss on light volume today, still closing above its 50 DMA line (now $418.17), helping its outlook to improve. Color code was changed to yellow. Technically, it has built a sloppy base over the past 9 weeks, and gains above its previously cited pivot point with at least +50% above average volume could trigger a new buy signal. BIDU traded up as much as +23% from its price when featured in yellow in the 9/08/09 Mid-Day BreakOuts Report (read here).
>>> The latest Featured Stock Update with an annotated graph appeared on 12/21/2009. click here.
|
|
C
A
S
I |
News |
Chart |
SEC
View all notes Alert
me of new notes
Company
Profile
|
CAAS
- NASDAQ
China Automotive Systems
AUTOMOTIVE - Auto Parts
|
$19.38
|
-1.01
|
979,861
132% DAV
740,500
|
11/30/2009
(Date
Featured) |
$18.84
(Price
Featured) |
PP = $17.62 |
G |
| MB = $18.50 |
Most Recent Note - 12/29/2009 5:32:53 PM
G - Fell today on lighter volume (but still above average) after 3 consecutive considerable gains backed by heavier above average volume indicated accumulation after finding prompt support near its short-term average line. It positively reversed after a gap down and pullback near support at its 50 DMA line. The Chinese maker of power steering systems had negated most of its bullish action since featured in the 11/30/09 mid-day report (read here).
>>> The latest Featured Stock Update with an annotated graph appeared on 12/29/2009. click here.
|
|
C
A
S
I |
News |
Chart |
SEC
View all notes Alert
me of new notes
Company
Profile
|
CACC
- NASDAQ
Credit Acceptance Corp
FINANCIAL SERVICES - Credit Services
|
$42.90
|
-0.79
|
27,833
70% DAV
39,600
|
9/29/2009
(Date
Featured) |
$33.48
(Price
Featured) |
PP = $37.10 |
G |
| MB = $38.96 |
Most Recent Note - 12/29/2009 5:42:21 PM
G - Pulled back from all-time highs today with a loss on lighter than average volume. It is extended from its prior base, and prior chart highs in the $35-37 area are an important support level to watch now. The Finance - Consumer/Commercial Loans firm has maintained a great track record of annual and quarterly sales revenues and earnings increases. It was featured on 9/29/09 in yellow in the mid-day report (read here).
>>> The latest Featured Stock Update with an annotated graph appeared on 12/22/2009. click here.
|
|
C
A
S
I |
News |
Chart |
SEC
View all notes Alert
me of new notes
Company
Profile
|
CRM
- NYSE
Salesforce.com Inc
INTERNET - Internet Software & Services
|
$74.64
|
+1.02
|
1,961,398
119% DAV
1,653,200
|
12/18/2009
(Date
Featured) |
$67.32
(Price
Featured) |
PP = $67.82 |
G |
| MB = $71.21 |
Most Recent Note - 12/29/2009 5:48:57 PM
G - Hit another new 2009 high today with its 7th consecutive gain, trading near its $75 all-time high from June 2008. It is now extended from its prior base after rising from a 5-week flat base above important support at its 50 DMA line. Its 12/18/09 gain with more than +50% above average volume triggered a technical buy signal.
>>> The latest Featured Stock Update with an annotated graph appeared on 12/18/2009. click here.
|
|
C
A
S
I |
News |
Chart |
SEC
View all notes Alert
me of new notes
Company
Profile
|
CTRP
- NASDAQ
Ctrip.com Intl Ltd Adr
LEISURE - Resorts & Casinos
|
$73.59
|
+0.22
|
538,731
48% DAV
1,112,700
|
12/1/2009
(Date
Featured) |
$75.38
(Price
Featured) |
PP = $73.91 |
G |
| MB = $77.61 |
Most Recent Note - 12/29/2009 5:49:50 PM
G - Posted a 4th consecutive gain today with below average volume. Last week's slump under its pivot point raised concerns while falling on higher volume toward its 50 DMA line - its next important chart support level. Featured on 12/01/09 in yellow in the mid-day report (read here). Fundamentally, its sales revenues and earnings increases have shown acceleration in the 3 most recent quarterly comparisons and rose above the +25% guideline. Based on weak technical action it was dropped from the Featured Stocks list on 6/10/08, when it closed at $49.84, yet it has rebounded very impressively from subsequent lows in the $16 area.
>>> The latest Featured Stock Update with an annotated graph appeared on 12/14/2009. click here.
|
|
C
A
S
I |
News |
Chart |
SEC
View all notes Alert
me of new notes
Company
Profile
|
GMCR
- NASDAQ
Green Mtn Coffee Roastrs
FOOD & BEVERAGE - Processed & Packaged Goods
|
$79.98
|
+2.32
|
1,979,316
129% DAV
1,535,800
|
12/28/2009
(Date
Featured) |
$77.49
(Price
Featured) |
PP = $76.50 |
Y |
| MB = $80.33 |
Most Recent Note - 12/29/2009 5:51:52 PM
Y - Gain with slightly above average volume for a new all-time high today. Considerable gain on 12/28/09 prompted its appearance in yellow in the mid-day report (read here) as it rose above the pivot point of a 10-week "double bottom" type base on +62% above average volume, confirming a new technical buy signal. Based on weak action it was dropped from the Featured Stocks list on 12/01/09. Its 12/18/09 gain on heavy volume repaired its prior 50 DMA line violation, helping its outlook improve.
>>> The latest Featured Stock Update with an annotated graph appeared on 12/28/2009. click here.
|
|
C
A
S
I |
News |
Chart |
SEC
View all notes Alert
me of new notes
Company
Profile
|
HEAT
-
|
$14.60
|
+0.24
|
369,788
38% DAV
962,900
|
11/17/2009
(Date
Featured) |
$12.00
(Price
Featured) |
PP = $12.61 |
G |
| MB = $13.24 |
Most Recent Note - 12/29/2009 5:53:11 PM
G - Gain today on very light volume while consolidating -15% off its 12/15/09 high. The investment system rules say a stock should be held a minimum of 8 weeks after rising more than +20% in the first 2-3 weeks from being bought. HEAT traded as much as +43.9% higher since first featured in yellow in the 11/17/09 mid-day report (read here) when technically rising from a "double bottom" base, reaching a new all-time high.
>>> The latest Featured Stock Update with an annotated graph appeared on 12/15/2009. click here.
|
|
C
A
S
I |
News |
Chart |
SEC
View all notes Alert
me of new notes
Company
Profile
|
LFT
-
|
$38.05
|
-0.19
|
112,510
27% DAV
415,600
|
11/17/2009
(Date
Featured) |
$31.77
(Price
Featured) |
PP = $33.04 |
G |
| MB = $34.69 |
Most Recent Note - 12/29/2009 5:54:03 PM
G - Small loss on very light volume today while hovering near all-time highs. Extended from a sound buy point now after recently rising from a choppy 14-week base. Its 50 DMA line coincides with prior chart highs in the $32 area are an initial support level to watch. A proposed offering of additional shares on 11/16/09 seems well received by the market. Its fundamentals remain strong.
>>> The latest Featured Stock Update with an annotated graph appeared on 12/17/2009. click here.
|
|
C
A
S
I |
News |
Chart |
SEC
View all notes Alert
me of new notes
Company
Profile
|
VIT
-
|
$19.86
|
+0.21
|
486,390
97% DAV
503,900
|
12/24/2009
(Date
Featured) |
$20.07
(Price
Featured) |
PP = $21.17 |
Y |
| MB = $22.23 |
Most Recent Note - 12/29/2009 5:55:34 PM
Y - Held its ground today, remaining perched near all-time highs since featured in yellow in the 12/24/09 mid-day report (read here) while approaching all-time highs on the right side of a choppy 10-week base. No overhead supply exists to act as resistance, however it did not yet rise above the pivot point cited with the volume needed to trigger a proper new technical buy signal, so patience and disciplined are needed. Following its steep ascent from its March low ($4.31), an additional public offering of shares on 7/10/09 coincided with a successful earlier test of 50 DMA support. Fundamentally, this high-ranked Computer - Tech Services firm's earnings and sales revenues increases have been above or at the +25% minimum guideline.
>>> The latest Featured Stock Update with an annotated graph appeared on 12/24/2009. click here.
|
|
C
A
S
I |
News |
Chart |
SEC
View all notes Alert
me of new notes
Company
Profile
|
|
|
|
THESE ARE NOT BUY RECOMMENDATIONS!
Comments contained in the body of this report are technical
opinions only. The material herein has been obtained
from sources believed to be reliable and accurate, however,
its accuracy and completeness cannot be guaranteed.
This site is not an investment advisor, hence it does
not endorse or recommend any securities or other investments.
Any recommendation contained in this report may not
be suitable for all investors and it is not to be deemed
an offer or solicitation on our part with respect to
the purchase or sale of any securities. All trademarks,
service marks and trade names appearing in this report
are the property of their respective owners, and are
likewise used for identification purposes only.
This report is a service available
only to active Paid Premium Members.
You may opt-out of receiving report notifications
at any time. Questions or comments may be submitted
by writing to Premium Membership Services 665 S.E. 10 Street, Suite 201 Deerfield Beach, FL 33441-5634 or by calling 1-800-965-8307
or 954-785-1121.
|
|
|


