You are not logged in.
This means you
CAN ONLY VIEW reports that were published prior to Tuesday, April 15, 2025.
You
MUST UPGRADE YOUR MEMBERSHIP if you want to see any current reports.
AFTER MARKET UPDATE - MONDAY, DECEMBER 28TH, 2009
Previous After Market Report Next After Market Report >>>
|
|
|
|
DOW |
+26.98 |
10,547.08 |
+0.26% |
|
Volume |
705,312,330 |
+121% |
|
Volume |
1,264,778,220 |
+100% |
|
NASDAQ |
+5.39 |
2,291.08 |
+0.24% |
|
Advancers |
1,555 |
49% |
|
Advancers |
1,241 |
43% |
|
S&P 500 |
+1.30 |
1,127.78 |
+0.12% |
|
Decliners |
1,481 |
47% |
|
Decliners |
1,492 |
52% |
|
Russell 2000 |
-0.32 |
633.75 |
-0.05% |
|
52 Wk Highs |
401 |
|
|
52 Wk Highs |
202 |
|
|
S&P 600 |
-0.32 |
337.09 |
-0.09% |
|
52 Wk Lows |
3 |
|
|
52 Wk Lows |
13 |
|
|
 |
Indices Post Small Gains As Investors Return From Holiday
Adam Sarhan, Contributing Writer,
Stocks rallied around the world as the US dollar fell and stronger than expected economic data was released from China and Japan. As expected, volume, an important indicator of institutional sponsorship, was higher than Thursday's shortened pre-holiday session. Advancers narrowly led decliners on the NYSE but trailed decliners by a 5-to-4 ratio on the Nasdaq exchange. There were 68 high-ranked companies from the CANSLIM.net Leaders List that made a new 52-week high and appeared on the CANSLIM.net BreakOuts Page, higher than the total of 62 issues that appeared on the prior session. New 52-week highs solidly outnumbered new 52-week lows on the NYSE and on the Nasdaq exchange.
Overnight, a stronger-than-expected report was released from China which showed that fourth quarter GDP would top 10% and its full year economic growth would reach +8.3%, which also topped views. China, one of the fastest growing economies in the world, has enjoyed robust growth for much of this decade thanks to a favorable labor market, a pegged currency, and its strong competitive advantages. The China Construction Bank (CCB) released the report and cited rising exports and increased domestic consumption as the two primary sources for the stronger than expected forecast. The Japanese government released a stronger-than-expected economic report which showed that industrial output rose +2.6% last month. November's reading was the the ninth consecutive monthly gain and beat the Street's estimate for a +2.4% increase.
Elsewhere, the Bank of Israel raised its benchmark interest rate for a third time since the global economy began to recover earlier this year. The Israeli central bank said that economic growth has accelerated sharply in recent quarters which, in turn, has caused inflation to exceed the government’s target range. In case you did not know, currently, the Israeli central bank is one of the most hawkish central banks in the world as they continue to raise rates even in the face of a potential double dip recession.
Preliminary results show that US retail sales rose +3.6% this holiday season when compared to the 2008 holiday shopping season. One extra shopping day coupled with a last minute surge in purchases the week before Christmas helped produce the stronger than expected results. MasterCard Advisors’ SpendingPulse released the findings and are usually considered a good proxy of consumer spending. It is important to note that according to the National Retail Federation, the 2008 season was the worst in four decades. Many economists believe that the US economy, the world's largest, will grow by +3.5% in 2010 thanks to a weak dollar and a rebounding jobs market. If that were to occur, that would be the best performance since 2004 as spending increases and companies increase investments.
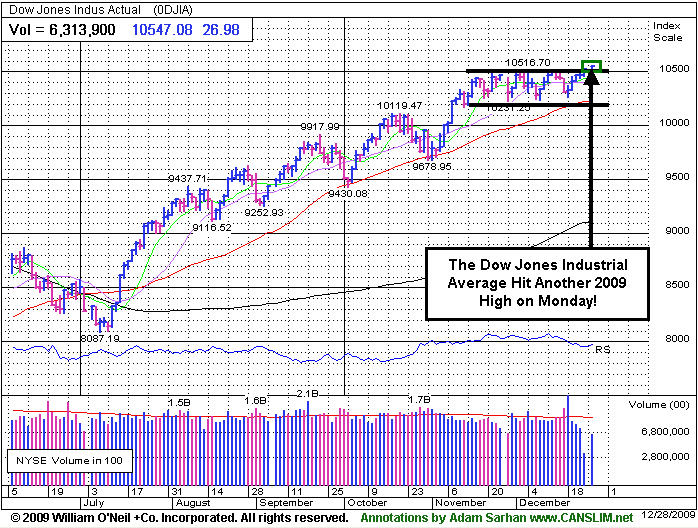
Looking at the market, the action remains healthy. The Dow Jones Industrial Average, small cap Russell 2000 index, S&P 500 and Nasdaq composite are all trading near fresh 2009 highs. Leaving the NYSE composite just below its 2009 high. The fact that the market managed to rally last week and hit new highs in the face of disconcerting economic data and a stronger dollar is a very healthy sign. Ideally, one would like to see leadership and volume expand over the next few weeks as the major averages continue advancing.
PICTURED: The Dow Jones Industrial Average hit another 2009 high on Monday.
|
|
|
 |
Retail Index Among Strong Performing Groups at 2009 Highs
Kenneth J. Gruneisen - Passed the CAN SLIM® Master's Exam
Financial shares were laggards on Monday as the Broker/Dealer Index ($XBD -0.87%) and Bank Index ($BKX -0.74%) fell. Modest losses in the Healthcare Index ($HMO -0.52%) and Gold & Silver Index ($XAU -0.42%) also limited the major averages' ability to make much headway. The Semiconductor Index ($SOX -0.95%) suffered a loss while the Networking Index ($NWX +0.01%) held its ground and the Internet Index ($IIX +0.22%) and Biotechnology Index ($BTK +0.40%) posted small gains. Gains in energy-related shares helped the Integrated Oil Index ($XOI +0.29%) and Oil Services Index ($OSX +0.49%) edge higher, and the Retail Index ($RLX +0.29%) also tallied a small gain.
Charts courtesy www.stockcharts.com
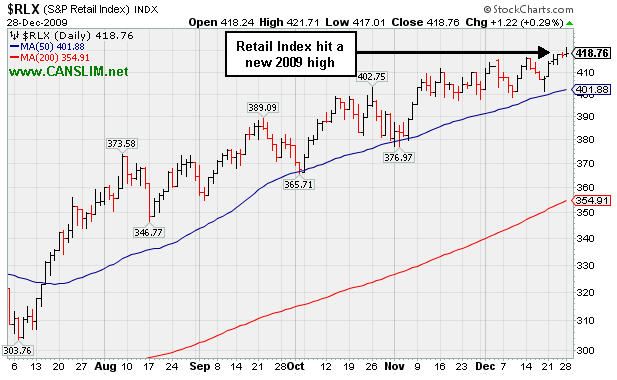
PICTURED: The Retail Index ($RLX +0.29%) hit a new 2009 high today, continuing to show strength. Meanwhile, its 50-day moving average line has acted as a support level in recent months.
| Oil Services |
$OSX |
198.22 |
+0.97 |
+0.49% |
+63.29% |
| Healthcare |
$HMO |
1,508.27 |
-7.91 |
-0.52% |
+57.08% |
| Integrated Oil |
$XOI |
1,080.37 |
+3.17 |
+0.29% |
+10.28% |
| Semiconductor |
$SOX |
357.64 |
-3.42 |
-0.95% |
+68.56% |
| Networking |
$NWX |
232.16 |
+0.03 |
+0.01% |
+61.35% |
| Internet |
$IIX |
236.51 |
+0.53 |
+0.22% |
+76.80% |
| Broker/Dealer |
$XBD |
115.33 |
-1.01 |
-0.87% |
+48.87% |
| Retail |
$RLX |
418.76 |
+1.22 |
+0.29% |
+49.95% |
| Gold & Silver |
$XAU |
171.29 |
-0.72 |
-0.42% |
+38.30% |
| Bank |
$BKX |
43.02 |
-0.32 |
-0.74% |
-2.93% |
| Biotech |
$BTK |
946.11 |
+3.77 |
+0.40% |
+46.19% |
|
|
|
 |
New High Close As Buying Demand Warms Up Again
Kenneth J. Gruneisen - Passed the CAN SLIM® Master's Exam
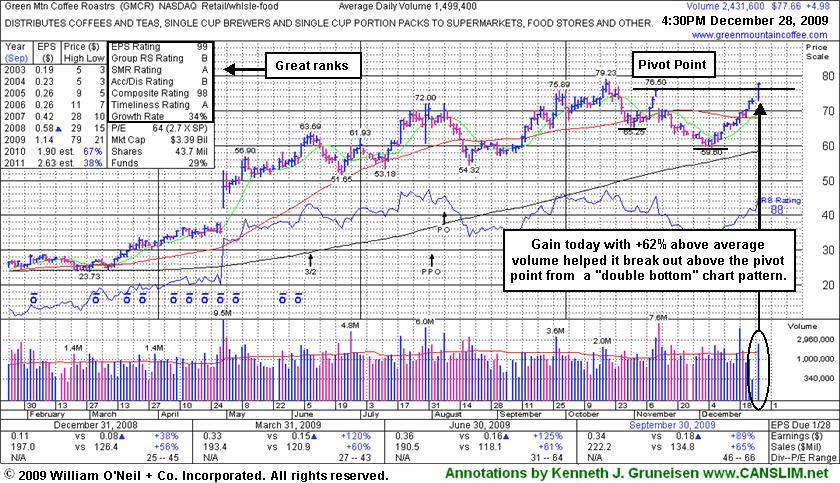
Green Mountain Coffee Roasters (GMCR +$4.98 or +6.58% to $77.86) posted a considerable gain today as it rose above the pivot point of a 10-week "double bottom" type base. It ended near the session high at its highest close ever with a considerable gain on +62% above average volume, confirming a new technical buy signal. Early strength prompted its appearance in yellow in the mid-day report (read here), returning the previously featured favorite to the Featured Stocks page at CANSLIM.net. It is clear of resistance due to overhead supply, a factor making it more likely to sprint higher, unhindered by resistance. Additional gains to new all-time high ground would be a solid reassurance of institutional buying demand, but disciplined investors would avoid chasing it more than +5% above its latest pivot point which would mean paying more than the $80.33 "max buy" price in this case. Meanwhile, losses should always be kept small by strictly selling any time any stock falls more than -7% from your buy price.
Weak action had led it to be dropped from the Featured Stocks list on 12/01/09. It rebounded impressively in recent weeks, and its 12/18/09 gain on heavy volume repaired its prior 50-day moving average (DMA) line violation, helping its outlook improve.
Do not be confused by the 3-for-2 split that occurred in the interim, as GMCR has traded up as much as +204% since appearing with an annotated graph under the headline "It May Soon Be Time To Go Green" when featured in the January 2009 CANSLIM.net News (read here).
|
|
|
Color Codes Explained :
Y - Better candidates highlighted by our
staff of experts.
G - Previously featured
in past reports as yellow but may no longer be buyable under the
guidelines.
***Last / Change / Volume quote data in this table corresponds with the timestamp on the note***
Symbol/Exchange
Company Name
Industry Group |
Last |
Chg. |
Vol
% DAV |
Date Featured |
Price Featured |
Latest Pivot Point
Featured |
Status |
| Latest Max Buy Price |
ARST
-
|
$25.90
|
-0.47
|
177,786
35% DAV
510,000
|
9/1/2009
(Date
Featured) |
$19.91
(Price
Featured) |
PP = $27.20 |
Y |
| MB = $28.56 |
Most Recent Note - 12/28/2009 4:14:40 PM
Y - Quietly hovering near all-time highs, it has been basing for 6 weeks. Color code was changed to yellow with new pivot point and max buy levels noted. ARST was first featured in yellow at $19.91 in the 9/01/09 mid-day report with an annotated daily graph (read here).
>>> The latest Featured Stock Update with an annotated graph appeared on 12/16/2009. click here.
|
|
C
A
S
I |
News |
Chart |
SEC
View all notes Alert
me of new notes
Company
Profile
|
ASIA
-
|
$30.53
|
-0.52
|
1,407,672
108% DAV
1,306,300
|
12/24/2009
(Date
Featured) |
$31.05
(Price
Featured) |
PP = $32.40 |
G |
| MB = $34.02 |
Most Recent Note - 12/28/2009 4:17:20 PM
Y - Loss today on average volume leaves it still perched near all-time highs. It has formed an advanced "3 weeks tight" type pattern, and color code is changed to yellow. A subsequent breakout with heavy volume is needed to confirm a new technical buy signal. Traded up as much as +68.13% since first featured in the August 2009 CANSLIM.net News (read here).
>>> The latest Featured Stock Update with an annotated graph appeared on 12/23/2009. click here.
|
|
C
A
S
I |
News |
Chart |
SEC
View all notes Alert
me of new notes
Company
Profile
|
BIDU
- NASDAQ
Baidu Inc Ads
INTERNET - Internet Information Providers
|
$424.29
|
+8.30
|
1,104,139
60% DAV
1,845,000
|
9/8/2009
(Date
Featured) |
$351.80
(Price
Featured) |
PP = $440.00 |
Y |
| MB = $462.00 |
Most Recent Note - 12/28/2009 4:22:54 PM
Y - Gain on light volume today helped it close above its 50 DMA line (now $418.15), helping its outlook to improve. Color code is changed to yellow. Technically, it has built a sloppy base over the past 9 weeks, and gains above its previously cited pivot point with at least +50% above average volume could trigger a new buy signal. BIDU traded up as much as +23% from its price when featured in yellow in the 9/08/09 Mid-Day BreakOuts Report (read here).
>>> The latest Featured Stock Update with an annotated graph appeared on 12/21/2009. click here.
|
|
C
A
S
I |
News |
Chart |
SEC
View all notes Alert
me of new notes
Company
Profile
|
CAAS
- NASDAQ
China Automotive Systems
AUTOMOTIVE - Auto Parts
|
$20.39
|
+0.53
|
1,400,712
196% DAV
714,000
|
11/30/2009
(Date
Featured) |
$18.84
(Price
Featured) |
PP = $17.62 |
G |
| MB = $18.50 |
Most Recent Note - 12/28/2009 4:24:34 PM
G - Gapped up today for a 3rd consecutive gain backed by above average volume. Considerable gains on 12/23 & 12/24 with above average volume indicated accumulation after finding prompt support near its short-term average line. It positively reversed after a gap down and pullback near support at its 50 DMA line. The Chinese maker of power steering systems had negated most of its bullish action since featured in the 11/30/09 mid-day report (read here).
>>> The latest Featured Stock Update with an annotated graph appeared on 12/11/2009. click here.
|
|
C
A
S
I |
News |
Chart |
SEC
View all notes Alert
me of new notes
Company
Profile
|
CACC
- NASDAQ
Credit Acceptance Corp
FINANCIAL SERVICES - Credit Services
|
$43.69
|
+0.58
|
53,828
138% DAV
39,000
|
9/29/2009
(Date
Featured) |
$33.48
(Price
Featured) |
PP = $37.10 |
G |
| MB = $38.96 |
Most Recent Note - 12/28/2009 4:25:27 PM
G - Gapped up and hit another new all-time high today with a gain on above average volume. It is extended from its prior base, and prior chart highs in the $35-37 area are an important support level to watch now. The Finance - Consumer/Commercial Loans firm has maintained a great track record of annual and quarterly sales revenues and earnings increases. It was featured on 9/29/09 in yellow in the mid-day report (read here).
>>> The latest Featured Stock Update with an annotated graph appeared on 12/22/2009. click here.
|
|
C
A
S
I |
News |
Chart |
SEC
View all notes Alert
me of new notes
Company
Profile
|
CRM
- NYSE
Salesforce.com Inc
INTERNET - Internet Software & Services
|
$73.62
|
+0.96
|
1,661,944
101% DAV
1,642,400
|
12/18/2009
(Date
Featured) |
$67.32
(Price
Featured) |
PP = $67.82 |
G |
| MB = $71.21 |
Most Recent Note - 12/28/2009 4:26:37 PM
G - Perched at 2009 highs after 6 consecutive gains, it is now extended from its prior base after rising from a 5-week flat base above important support at its 50 DMA line. Its 12/18/09 gain with more than +50% above average volume triggered a technical buy signal.
>>> The latest Featured Stock Update with an annotated graph appeared on 12/18/2009. click here.
|
|
C
A
S
I |
News |
Chart |
SEC
View all notes Alert
me of new notes
Company
Profile
|
CTRP
- NASDAQ
Ctrip.com Intl Ltd Adr
LEISURE - Resorts & Casinos
|
$73.37
|
+0.19
|
328,189
29% DAV
1,115,500
|
12/1/2009
(Date
Featured) |
$75.38
(Price
Featured) |
PP = $73.91 |
G |
| MB = $77.61 |
Most Recent Note - 12/28/2009 4:29:15 PM
G - Posted another quiet gain today. Last week's slump under its pivot point raised concerns while falling on higher volume toward its 50 DMA line - its next important chart support level. Featured on 12/01/09 in yellow in the mid-day report (read here). Fundamentally, its sales revenues and earnings increases have shown acceleration in the 3 most recent quarterly comparisons and rose above the +25% guideline. Based on weak technical action it was dropped from the Featured Stocks list on 6/10/08, when it closed at $49.84, yet it has rebounded very impressively from subsequent lows in the $16 area.
>>> The latest Featured Stock Update with an annotated graph appeared on 12/14/2009. click here.
|
|
C
A
S
I |
News |
Chart |
SEC
View all notes Alert
me of new notes
Company
Profile
|
GMCR
- NASDAQ
Green Mtn Coffee Roastrs
FOOD & BEVERAGE - Processed & Packaged Goods
|
$77.66
|
+4.98
|
2,431,623
162% DAV
1,499,400
|
12/28/2009
(Date
Featured) |
$77.49
(Price
Featured) |
PP = $76.50 |
Y |
| MB = $80.33 |
Most Recent Note - 12/28/2009 4:40:29 PM
Y - Considerable gain today prompted its appearance in yellow in the mid-day report (read here) as it rose above the pivot point of a 10-week "double bottom" type base. It closed near the session high with a considerable gain on +62% above average volume, confirming a new technical buy signal. Based on weak action it was dropped from the Featured Stocks list on 12/01/09. Its 12/18/09 gain on heavy volume repaired its prior 50 DMA line violation, helping its outlook improve.
>>> The latest Featured Stock Update with an annotated graph appeared on 12/28/2009. click here.
|
|
C
A
S
I |
News |
Chart |
SEC
View all notes Alert
me of new notes
Company
Profile
|
HEAT
-
|
$14.36
|
-0.46
|
866,068
90% DAV
962,500
|
11/17/2009
(Date
Featured) |
$12.00
(Price
Featured) |
PP = $12.61 |
G |
| MB = $13.24 |
Most Recent Note - 12/28/2009 5:16:37 PM
G - Loss on near average volume today while consolidating more than -16% off its 12/15/09 high. The investment system rules say a stock should be held a minimum of 8 weeks after rising more than +20% in the first 2-3 weeks from being bought. HEAT traded as much as +43.9% higher since first featured in yellow in the 11/17/09 mid-day report (read here) when technically rising from a "double bottom" base, reaching a new all-time high.
>>> The latest Featured Stock Update with an annotated graph appeared on 12/15/2009. click here.
|
|
C
A
S
I |
News |
Chart |
SEC
View all notes Alert
me of new notes
Company
Profile
|
LFT
-
|
$38.24
|
+0.94
|
145,755
35% DAV
420,900
|
11/17/2009
(Date
Featured) |
$31.77
(Price
Featured) |
PP = $33.04 |
G |
| MB = $34.69 |
Most Recent Note - 12/28/2009 5:18:18 PM
G - Quiet gain today for its second highest close ever while hovering near all-time highs. Extended from a sound buy point now after recently rising from a choppy 14-week base. Its 50 DMA line coincides with prior chart highs in the $32 area are an initial support level to watch. A proposed offering of additional shares on 11/16/09 seems well received by the market. Its fundamentals remain strong.
>>> The latest Featured Stock Update with an annotated graph appeared on 12/17/2009. click here.
|
|
C
A
S
I |
News |
Chart |
SEC
View all notes Alert
me of new notes
Company
Profile
|
VIT
-
|
$19.65
|
-0.29
|
700,304
141% DAV
497,900
|
12/24/2009
(Date
Featured) |
$20.07
(Price
Featured) |
PP = $21.17 |
Y |
| MB = $22.23 |
Most Recent Note - 12/28/2009 5:21:21 PM
Y - Down today for a small loss on above average volume. Featured in yellow in the 12/24/09 mid-day report (read here) while approaching all-time highs on the right side of a choppy 10-week base. No overhead supply exists to act as resistance, however it did not yet rise above the pivot point cited with the volume needed to trigger a proper new technical buy signal, so patience and disciplined are needed. Following its steep ascent from its March low ($4.31), an additional public offering of shares on 7/10/09 coincided with a successful earlier test of 50 DMA support. Fundamentally, this high-ranked Computer - Tech Services firm's earnings and sales revenues increases have been above or at the +25% minimum guideline.
>>> The latest Featured Stock Update with an annotated graph appeared on 12/24/2009. click here.
|
|
C
A
S
I |
News |
Chart |
SEC
View all notes Alert
me of new notes
Company
Profile
|
|
|
|
THESE ARE NOT BUY RECOMMENDATIONS!
Comments contained in the body of this report are technical
opinions only. The material herein has been obtained
from sources believed to be reliable and accurate, however,
its accuracy and completeness cannot be guaranteed.
This site is not an investment advisor, hence it does
not endorse or recommend any securities or other investments.
Any recommendation contained in this report may not
be suitable for all investors and it is not to be deemed
an offer or solicitation on our part with respect to
the purchase or sale of any securities. All trademarks,
service marks and trade names appearing in this report
are the property of their respective owners, and are
likewise used for identification purposes only.
This report is a service available
only to active Paid Premium Members.
You may opt-out of receiving report notifications
at any time. Questions or comments may be submitted
by writing to Premium Membership Services 665 S.E. 10 Street, Suite 201 Deerfield Beach, FL 33441-5634 or by calling 1-800-965-8307
or 954-785-1121.
|
|
|


