You are not logged in.
This means you
CAN ONLY VIEW reports that were published prior to Monday, April 14, 2025.
You
MUST UPGRADE YOUR MEMBERSHIP if you want to see any current reports.
AFTER MARKET UPDATE - WEDNESDAY, DECEMBER 21ST, 2011
Previous After Market Report Next After Market Report >>>
|
|
|
|
DOW |
+4.16 |
12,107.74 |
+0.03% |
|
Volume |
824,230,020 |
-13% |
|
Volume |
1,814,554,340 |
+4% |
|
NASDAQ |
-25.76 |
2,577.97 |
-0.99% |
|
Advancers |
1,832 |
59% |
|
Advancers |
1,250 |
46% |
|
S&P 500 |
+2.41 |
1,243.71 |
+0.19% |
|
Decliners |
1,191 |
38% |
|
Decliners |
1,304 |
48% |
|
Russell 2000 |
+2.23 |
740.45 |
+0.30% |
|
52 Wk Highs |
143 |
|
|
52 Wk Highs |
51 |
|
|
S&P 600 |
+2.01 |
415.58 |
+0.49% |
|
52 Wk Lows |
30 |
|
|
52 Wk Lows |
65 |
|
|
 |
Major Averages Pause Following Prior Session of Big Gains
Kenneth J. Gruneisen - Passed the CAN SLIM® Master's Exam
The major US averages paused after impressive gains on Tuesday finishing mixed and little changed on Wednesday. The volume totals were also reported mixed, lighter on the NYSE, yet higher on the Nasdaq exchange. Advancers outnumbered declining issues 3-2 on the NYSE, however decliners narrowly outnumbered advancing issues on the Nasdaq exchange. New 52-week highs outnumbered new 52-week lows on the NYSE while new lows again outnumbered new highs on the Nasdaq exchange. There were 44 high-ranked companies from the CANSLIM.net Leaders List that made new 52-week highs and appeared on the CANSLIM.net BreakOuts Page, up from the prior session total of 41 stocks. There were gains for 7 of the 18 high-ranked companies currently included on the Featured Stocks Page.
Stocks ended well off of early morning trading levels. Heavy demand by Eurozone banks for the European Central Bank's three-year loan auction stoked investor concerns over the bloc's short-term funding needs. European markets finished their session in the red. The FTSE in London closed -0.6% lower, the DAX in Germany lost -1%, and the CAC in France fell -0.8%.
Tech stocks led Wednesday's declines following a significantly disappointing earning tally from Oracle Corp (ORCL -11.66%). International Business Machines Corp (IBM -3.08%) and VMware Inc (VMW -9.93%). Shares of Walgreen Co (WAG -0.39%) inched lower after the company posted earnings below analyst estimates. Athletic Apparel maker Nike Inc (NKE +2.91%) rallied after their earnings topped expectations.
Benchmark revisions by the National Association of Realtors showed that existing home sales in 2010 were -14% lower than previously calculated. US Treasuries gave up ground with the 10-year note down 14/32 to yield 1.97%. Crude oil on the Nymex rallied $1.62 to $98.86 per barrel after the Energy Information Administration reported a 10.6 million barrel decline in petroleum inventories last week. Gold took the day off, down a modest -$3.70 to $1,611.90 an ounce.
Our monthly newsletter CANSLIM.net News will be published soon with an informative review of current market conditions, leading groups, and best buy candidates. Via the Premium Member Homepage links to all prior reports and webcasts are always available.
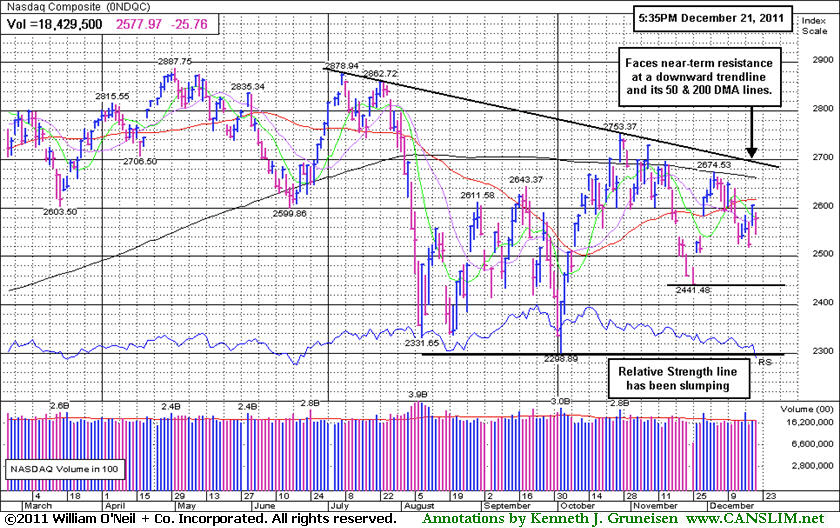
PICTURED: The Nasdaq Composite Index faces near-term resistance at a downward trendline and its 50-day and 200-day moving average (DMA) lines. Its Relative Strength line has been slumping.
|
 Kenneth J. Gruneisen started out as a licensed stockbroker in August 1987, a couple of months prior to the historic stock market crash that took the Dow Jones Industrial Average down -22.6% in a single day. He has published daily fact-based fundamental and technical analysis on high-ranked stocks online for two decades. Through FACTBASEDINVESTING.COM, Kenneth provides educational articles, news, market commentary, and other information regarding proven investment systems that work in good times and bad.
Comments contained in the body of this report are technical opinions only and are not necessarily those of Gruneisen Growth Corp. The material herein has been obtained from sources believed to be reliable and accurate, however, its accuracy and completeness cannot be guaranteed. Our firm, employees, and customers may effect transactions, including transactions contrary to any recommendation herein, or have positions in the securities mentioned herein or options with respect thereto. Any recommendation contained in this report may not be suitable for all investors and it is not to be deemed an offer or solicitation on our part with respect to the purchase or sale of any securities. |
|
 |
Mixed Group Action With Lack of Decisiveness
Kenneth J. Gruneisen - Passed the CAN SLIM® Master's Exam
The Bank Index ($BKX +1.02%) posted a gain while weakness from the Broker/Dealer Index ($XBD -0.27%) and Retail Index ($RLX -0.60%) created a drag on the major averages. Gains in energy-related shares gave the Oil Services Index ($OSX +0.43%) and Integrated Oil Index ($XOI +1.05%) a boost. Meanwhile, the Networking Index ($NWX -1.59%), Internet Index ($IIX -1.30%), and Semiconductor Index ($SOX -1.19%) fell, dragging the tech-heavy Nasdaq Composite Index into the red. The Biotechnology Index ($BTK +0.39%) and Healthcare Index ($HMO +0.12%) inched higher and the Gold & Silver Index ($XAU -0.02%) finished flat.
Charts courtesy www.stockcharts.com
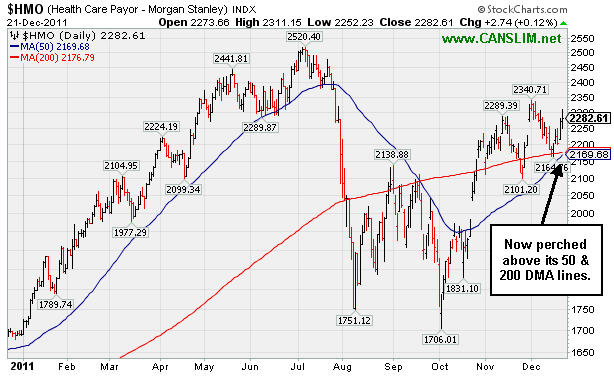
PICTURED: The Healthcare Index ($HMO +0.12%) is now perched above its 50-day and 200-day moving average lines.
| Oil Services |
$OSX |
217.06 |
+0.93 |
+0.43% |
-11.45% |
| Healthcare |
$HMO |
2,282.61 |
+2.74 |
+0.12% |
+34.91% |
| Integrated Oil |
$XOI |
1,207.74 |
+12.51 |
+1.05% |
-0.45% |
| Semiconductor |
$SOX |
354.45 |
-4.28 |
-1.19% |
-13.93% |
| Networking |
$NWX |
211.54 |
-3.42 |
-1.59% |
-24.60% |
| Internet |
$IIX |
275.71 |
-3.64 |
-1.30% |
-10.41% |
| Broker/Dealer |
$XBD |
83.25 |
-0.22 |
-0.27% |
-31.49% |
| Retail |
$RLX |
525.59 |
-3.17 |
-0.60% |
+3.39% |
| Gold & Silver |
$XAU |
185.36 |
-0.04 |
-0.02% |
-18.19% |
| Bank |
$BKX |
38.59 |
+0.39 |
+1.02% |
-26.09% |
| Biotech |
$BTK |
1,053.74 |
+4.14 |
+0.39% |
-18.79% |
|
|
|
 |
Firm Perched Near High Has No Overhead Supply to Act as Resistance
Kenneth J. Gruneisen - Passed the CAN SLIM® Master's Exam
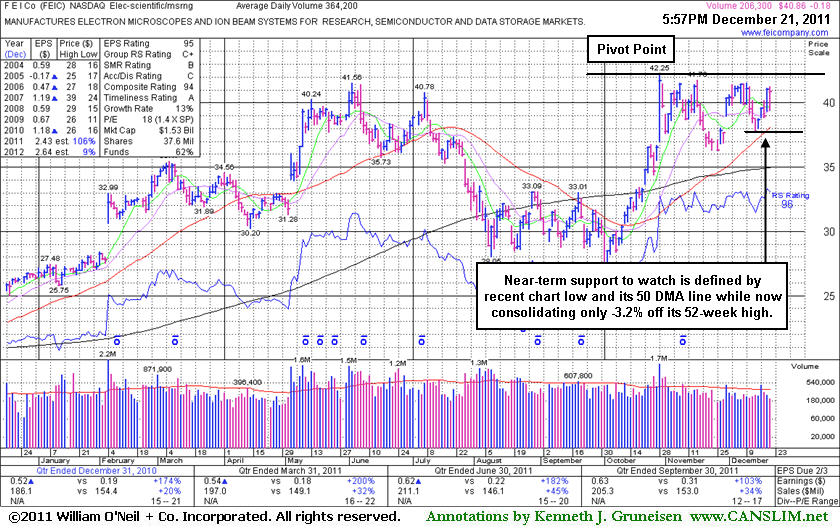
F E I Co (FEIC -$0.18 or -0.44% to $40.86) is still perched within close striking distance of its all-time high while consolidating above its 50-day moving average (DMA) line and recent lows defining near-term chart support. Disciplined investors would watch for a volume-driven gain above the pivot point to trigger a proper technical buy signal. Its last appearance in this FSU section was on 11/25/11 with an annotated daily graph under the headline, "Stalled After Rallying to a New High." Disciplined investors limit losses if a stock falls more than -7% from their purchase, so any who may have accumulated shares in recent weeks have likely been prompted to sell by its subsequent weakness.
Recently, strong action came after reporting earnings +103% on +34% sales revenues for the quarter ended September 30, 2011 versus the year ago period. Sales revenues and earnings increases (C criteria) have been strong in recent quarterly comparisons. Concern was previously noted because its annual earnings (A criteria) history was up and down, yet recent fundamental and technical action has been a better match for winning models of the fact-based investment system.
The number of top-rated funds owning its shares rose from 283 in Dec '10 to 346 in Sep '11, a reassuring sign concerning the I criteria. Its Group RS Rating is only a mediocre 47 now, however leadership provided by other companies in the Electronics - Scientific Measuring industry group has been a reassuring sign concerning the L criteria. Its small supply of only 37.6 million shares outstanding is a favorable characteristic concerning the S criteria. Disciplined investors avoid chasing stocks more than +5% above a prior chart high, and they always limit losses at -7% by selling if a stock falls that much from their purchase price.
|
|
|
Color Codes Explained :
Y - Better candidates highlighted by our
staff of experts.
G - Previously featured
in past reports as yellow but may no longer be buyable under the
guidelines.
***Last / Change / Volume data in this table is the closing quote data***
Symbol/Exchange
Company Name
Industry Group |
PRICE |
CHANGE
(%Change) |
Day High |
Volume
(% DAV)
(% 50 day avg vol) |
52 Wk Hi
% From Hi |
Featured
Date |
Price
Featured |
Pivot Featured |
|
Max Buy |
ADS
-
NYSE
Alliance Data Sys Corp
COMPUTER SOFTWARE and SERVICES - Information and Delivery Service
|
$105.72
|
+0.69
0.66% |
$105.82
|
330,784
37.55% of 50 DAV
50 DAV is 880,900
|
$107.33
-1.50%
|
10/21/2011
|
$97.94
|
PP = $101.15
|
|
MB = $106.21
|
Most Recent Note - 12/20/2011 2:32:27 PM
Y - Up today without great volume conviction while perched within striking distance of a best-ever close. Just above its 50 DMA line it found support last week, meanwhile any subsequent violation of that important short-term average would raise concerns.
>>> The latest Featured Stock Update with an annotated graph appeared on 12/14/2011. Click here.
View all notes |
Alert me of new notes |
CANSLIM.net Company Profile |
SEC |
Zacks Reports |
StockTalk |
News |
Chart |
Request a new note
C
A N
S L
I M


|
ALXN
-
NASDAQ
Alexion Pharmaceuticals
DRUGS - Drug Manufacturers - Other
|
$67.54
|
-1.45
-2.10% |
$69.95
|
1,322,822
108.88% of 50 DAV
50 DAV is 1,214,900
|
$70.42
-4.09%
|
11/30/2011
|
$68.66
|
PP = $70.52
|
|
MB = $74.05
|
 Most Recent Note - 12/21/2011 1:11:26 PM
Y - Reversed into the red after a small gap up today and 4 prior gains had it trading within close striking distance its all-time high. Recent lows near $62 define important near-term support to watch.
>>> The latest Featured Stock Update with an annotated graph appeared on 12/12/2011. Click here.
View all notes |
Alert me of new notes |
CANSLIM.net Company Profile |
SEC |
Zacks Reports |
StockTalk |
News |
Chart |
Request a new note
C
A N
S L
I M
|
CELG
-
NASDAQ
Celgene Corp
DRUGS - Drug Manufacturers - Major
|
$66.55
|
+0.12
0.18% |
$67.53
|
3,209,887
92.77% of 50 DAV
50 DAV is 3,459,900
|
$68.25
-2.49%
|
12/20/2011
|
$66.68
|
PP = $68.35
|
|
MB = $71.77
|
Most Recent Note - 12/20/2011 2:11:03 PM
Y - Gapped up today after a rebound above its 50 DMA line on the prior session helped its outlook improve. Color code is changed to yellow with a new pivot point cited based on its 52-week high plus 10 cents. Now only -2.2% off its 52-week high, subsequent volume-driven gains above the pivot point may trigger a new (or add-on) technical buy signal.
>>> The latest Featured Stock Update with an annotated graph appeared on 12/1/2011. Click here.
View all notes |
Alert me of new notes |
CANSLIM.net Company Profile |
SEC |
Zacks Reports |
StockTalk |
News |
Chart |
Request a new note
C
A N
S L
I M
|
FEIC
-
NASDAQ
F E I Co
ELECTRONICS - Diversified Electronics
|
$40.86
|
-0.18
-0.44% |
$41.26
|
209,177
57.29% of 50 DAV
50 DAV is 365,100
|
$42.25
-3.29%
|
12/7/2011
|
$41.41
|
PP = $42.35
|
|
MB = $44.47
|
Most Recent Note - 12/21/2011 1:14:08 PM
Y - Perched within close striking distance of its all-time high while consolidating above its 50 DMA line and prior lows in the $36 area defining chart support. Disciplined investors would watch for a volume-driven gain above the pivot point to trigger a proper technical buy signal.
>>> The latest Featured Stock Update with an annotated graph appeared on 12/21/2011. Click here.
View all notes |
Alert me of new notes |
CANSLIM.net Company Profile |
SEC |
Zacks Reports |
StockTalk |
News |
Chart |
Request a new note
C
A N
S L
I M
|
GNC
-
NYSE
G N C Holdings Inc
RETAIL - Drug Stores
|
$28.92
|
+0.26
0.91% |
$28.99
|
571,449
34.12% of 50 DAV
50 DAV is 1,674,900
|
$28.97
-0.17%
|
10/26/2011
|
$24.60
|
PP = $24.80
|
|
MB = $26.04
|
Most Recent Note - 12/20/2011 2:25:07 PM
G - Touched a new all-time high today with a 3rd consecutive small gain on below average volume. It is extended from its prior base pattern. Prior chart highs and its 50 DMA line coincide in the $25-26 area defining important support to watch on pullbacks.
>>> The latest Featured Stock Update with an annotated graph appeared on 12/16/2011. Click here.
View all notes |
Alert me of new notes |
CANSLIM.net Company Profile |
SEC |
Zacks Reports |
StockTalk |
News |
Chart |
Request a new note
C
A N
S L
I M
|
Symbol/Exchange
Company Name
Industry Group |
PRICE |
CHANGE
(%Change) |
Day High |
Volume
(% DAV)
(% 50 day avg vol) |
52 Wk Hi
% From Hi |
Featured
Date |
Price
Featured |
Pivot Featured |
|
Max Buy |
HMSY
-
NASDAQ
H M S Holdings Corp
COMPUTER SOFTWARE and SERVICES - Healthcare Information Service
|
$31.37
|
-0.22
-0.70% |
$31.65
|
550,746
52.10% of 50 DAV
50 DAV is 1,057,100
|
$32.16
-2.46%
|
10/27/2011
|
$26.44
|
PP = $28.37
|
|
MB = $29.79
|
Most Recent Note - 12/20/2011 2:14:48 PM
G - Gapped up today and it is challenging its all-time high with no resistance remaining. It is extended from its prior base. Prior highs in the $27-28 area acted as support during the recent pullback.
>>> The latest Featured Stock Update with an annotated graph appeared on 11/30/2011. Click here.
View all notes |
Alert me of new notes |
CANSLIM.net Company Profile |
SEC |
Zacks Reports |
StockTalk |
News |
Chart |
Request a new note
C
A N
S L
I M
|
ISRG
-
NASDAQ
Intuitive Surgical Inc
HEALTH SERVICES - Medical Appliances and Equipment
|
$440.73
|
-2.85
-0.64% |
$445.25
|
248,226
71.12% of 50 DAV
50 DAV is 349,000
|
$449.06
-1.85%
|
12/20/2011
|
$442.43
|
PP = $449.16
|
|
MB = $471.62
|
Most Recent Note - 12/20/2011 2:21:35 PM
Y - Posting a 4th consecutive gain today and rising within striking distance of new high territory. Color code is changed to yellow with new pivot point cited based on its 52-week high plus 10 cents. Volume driven gains above its pivot point may trigger a new (or add-on) technical buy signal. Important support is defined by its 50 DMA line.
>>> The latest Featured Stock Update with an annotated graph appeared on 12/13/2011. Click here.
View all notes |
Alert me of new notes |
CANSLIM.net Company Profile |
SEC |
Zacks Reports |
StockTalk |
News |
Chart |
Request a new note
C
A N
S L
I M
|
MELI
-
NASDAQ
Mercadolibre Inc
INTERNET - Internet Software and; Services
|
$81.77
|
-4.22
-4.91% |
$86.35
|
582,884
81.98% of 50 DAV
50 DAV is 711,000
|
$95.48
-14.36%
|
12/5/2011
|
$91.08
|
PP = $92.83
|
|
MB = $97.47
|
Most Recent Note - 12/21/2011 11:23:23 AM
G - Slumping near its 50 DMA line and prior lows defining chart support near the $80 area. It stalled after volume-driven gains to new all-time highs in early-December, yet it has not encountered heavy distributional pressure.
>>> The latest Featured Stock Update with an annotated graph appeared on 12/5/2011. Click here.
View all notes |
Alert me of new notes |
CANSLIM.net Company Profile |
SEC |
Zacks Reports |
StockTalk |
News |
Chart |
Request a new note
C
A N
S L
I M
|
MG
-
NYSE
Mistras Group Inc
DIVERSIFIED SERVICES - Bulding and Faci;ity Management Services
|
$24.29
|
+1.07
4.61% |
$24.36
|
146,352
87.17% of 50 DAV
50 DAV is 167,900
|
$25.28
-3.92%
|
10/28/2011
|
$22.49
|
PP = $23.61
|
|
MB = $24.79
|
Most Recent Note - 12/21/2011 1:19:01 PM
Y - Trading back above its previously cited pivot point today. Prior highs in the $23 area define chart support along with its 50 DMA line.
>>> The latest Featured Stock Update with an annotated graph appeared on 12/8/2011. Click here.
View all notes |
Alert me of new notes |
CANSLIM.net Company Profile |
SEC |
Zacks Reports |
StockTalk |
News |
Chart |
Request a new note
C
A N
S L
I M
|
MKTX
-
NASDAQ
Marketaxess Holdings Inc
FINANCIAL SERVICES - Investment Brokerage - Nationa
|
$29.25
|
-1.91
-6.13% |
$30.21
|
512,314
272.36% of 50 DAV
50 DAV is 188,100
|
$31.59
-7.41%
|
10/28/2011
|
$29.79
|
PP = $31.05
|
|
MB = $32.60
|
Most Recent Note - 12/21/2011 11:09:42 AM
Y - Gapped down today, abruptly reversing back into the prior base while promptly encountering distributional pressure similar to its abrupt reversal on 11/04/11. See the latest FSU analysis for more details and an annotated graph.
>>> The latest Featured Stock Update with an annotated graph appeared on 12/20/2011. Click here.
View all notes |
Alert me of new notes |
CANSLIM.net Company Profile |
SEC |
Zacks Reports |
StockTalk |
News |
Chart |
Request a new note
C
A N
S L
I M
|
Symbol/Exchange
Company Name
Industry Group |
PRICE |
CHANGE
(%Change) |
Day High |
Volume
(% DAV)
(% 50 day avg vol) |
52 Wk Hi
% From Hi |
Featured
Date |
Price
Featured |
Pivot Featured |
|
Max Buy |
OSIS
-
NASDAQ
O S I Systems Inc
ELECTRONICS - Semiconductor Equipment and Mate
|
$48.41
|
+0.11
0.23% |
$48.60
|
91,989
75.77% of 50 DAV
50 DAV is 121,400
|
$49.04
-1.28%
|
11/1/2011
|
$42.07
|
PP = $45.57
|
|
MB = $47.85
|
Most Recent Note - 12/20/2011 2:00:44 PM
Y - Considerable gain today has it rallying within striking distance of a best-ever close. It found support above its 50 DMA line but made no progress since its gap gain with +44% above average volume on 11/30/11 triggered a technical buy signal.
>>> The latest Featured Stock Update with an annotated graph appeared on 11/28/2011. Click here.
View all notes |
Alert me of new notes |
CANSLIM.net Company Profile |
SEC |
Zacks Reports |
StockTalk |
News |
Chart |
Request a new note
C
A N
S L
I M
|
PRGO
-
NASDAQ
Perrigo Co
DRUGS - Drug Related Products
|
$102.47
|
+1.67
1.66% |
$102.65
|
1,361,959
106.85% of 50 DAV
50 DAV is 1,274,600
|
$101.94
0.52%
|
12/9/2011
|
$99.54
|
PP = $101.56
|
|
MB = $106.64
|
Most Recent Note - 12/20/2011 2:02:31 PM
Y - Gapped up today and it is rallying within striking distance of a best-ever close. Found impressive support while consolidating above its 50 DMA line recently. Insider buying was recently reported while perched near all-time highs, which is a reassuring sign. It has formed a late-stage base, however disciplined investors would watch for confirming gains to trigger a proper new technical buy signal. Chart readers may note that its Relative Strength line peaked in September and did not recently lead the way confirming new highs.
>>> The latest Featured Stock Update with an annotated graph appeared on 12/9/2011. Click here.
View all notes |
Alert me of new notes |
CANSLIM.net Company Profile |
SEC |
Zacks Reports |
StockTalk |
News |
Chart |
Request a new note
C
A N
S L
I M
|
RAX
-
NYSE
Rackspace Hosting Inc
INTERNET - Internet Software and; Services
|
$44.05
|
-1.11
-2.46% |
$44.99
|
2,743,885
175.70% of 50 DAV
50 DAV is 1,561,700
|
$46.50
-5.26%
|
11/8/2011
|
$44.28
|
PP = $46.27
|
|
MB = $48.58
|
Most Recent Note - 12/21/2011 12:39:22 PM
Y - Down considerably today, erasing the prior streak of 4 consecutive small gains, yet still perched within striking distance of its 52-week and all-time high. Its 50 DMA line defines near-term support to watch. That short-term moving average has risen since its positive crossover with the 200 DMA line shown on the graph in the latest FSU analysis dated 12/07/11.
>>> The latest Featured Stock Update with an annotated graph appeared on 12/7/2011. Click here.
View all notes |
Alert me of new notes |
CANSLIM.net Company Profile |
SEC |
Zacks Reports |
StockTalk |
News |
Chart |
Request a new note
C
A N
S L
I M
|
SWI
-
NYSE
Solarwinds Inc
COMPUTER SOFTWARE and SERVICES - Application Software
|
$29.00
|
-1.58
-5.17% |
$30.42
|
1,918,787
154.22% of 50 DAV
50 DAV is 1,244,200
|
$33.68
-13.90%
|
10/27/2011
|
$27.78
|
PP = $25.62
|
|
MB = $26.90
|
Most Recent Note - 12/21/2011 11:17:57 AM
G - Considerable loss today has it trading below its 50 DMA line (now $29.04) raising some concerns. Subsequent deterioration below its 12/14/11 low ($28.50) may trigger a more worrisome technical sell signal leading to a deeper consolidation including a possible revisit to prior chart highs in the $25-26 area or its 200 DMA line.
>>> The latest Featured Stock Update with an annotated graph appeared on 12/19/2011. Click here.
View all notes |
Alert me of new notes |
CANSLIM.net Company Profile |
SEC |
Zacks Reports |
StockTalk |
News |
Chart |
Request a new note
C
A N
S L
I M
|
TDG
-
NYSE
Transdigm Group Inc
AEROSPACE/DEFENSE - Aerospace/Defense Products and; Services
|
$97.14
|
+0.22
0.23% |
$97.14
|
278,493
75.97% of 50 DAV
50 DAV is 366,600
|
$102.73
-5.44%
|
11/9/2011
|
$98.45
|
PP = $95.14
|
|
MB = $99.90
|
Most Recent Note - 12/20/2011 2:26:25 PM
Y - Small gap up gain today on lighter volume while perched within striking distance of a best-ever close. Its 50 DMA line defines near-term support above recent lows where subsequent violations would trigger technical sell signals.
>>> The latest Featured Stock Update with an annotated graph appeared on 12/6/2011. Click here.
View all notes |
Alert me of new notes |
CANSLIM.net Company Profile |
SEC |
Zacks Reports |
StockTalk |
News |
Chart |
Request a new note
C
A N
S L
I M
|
Symbol/Exchange
Company Name
Industry Group |
PRICE |
CHANGE
(%Change) |
Day High |
Volume
(% DAV)
(% 50 day avg vol) |
52 Wk Hi
% From Hi |
Featured
Date |
Price
Featured |
Pivot Featured |
|
Max Buy |
UA
-
NYSE
Under Armour Inc Cl A
CONSUMER NON-DURABLES - Textile - Apparel Clothing
|
$71.12
|
-1.22
-1.69% |
$72.74
|
1,235,008
107.15% of 50 DAV
50 DAV is 1,152,600
|
$87.40
-18.63%
|
10/25/2011
|
$82.43
|
PP = $80.80
|
|
MB = $84.84
|
Most Recent Note - 12/19/2011 5:39:09 PM
G - Loss today on light volume has it slumping further below the previously noted low ($73.55 on 11/21/11) and testing important chart support at its 200 DMA line. More damaging losses would raise serious concerns.
>>> The latest Featured Stock Update with an annotated graph appeared on 11/29/2011. Click here.
View all notes |
Alert me of new notes |
CANSLIM.net Company Profile |
SEC |
Zacks Reports |
StockTalk |
News |
Chart |
Request a new note
C
A N
S L
I M
|
ULTA
-
NASDAQ
Ulta Salon Cosm & Frag
SPECIALTY RETAIL - Specialty Retail, Other
|
$65.87
|
-1.10
-1.64% |
$67.64
|
412,081
42.90% of 50 DAV
50 DAV is 960,600
|
$75.70
-12.99%
|
12/2/2011
|
$72.88
|
PP = $75.79
|
|
MB = $79.58
|
Most Recent Note - 12/20/2011 2:27:46 PM
G - Up today on below average volume after testing prior lows near $64 previously noted as an important chart support level above its 200 DMA line. A rebound above its 50 DMA line is needed for its outlook to improve.
>>> The latest Featured Stock Update with an annotated graph appeared on 12/2/2011. Click here.
View all notes |
Alert me of new notes |
CANSLIM.net Company Profile |
SEC |
Zacks Reports |
StockTalk |
News |
Chart |
Request a new note
C
A N
S L
I M
|
V
-
NYSE
Visa Inc Cl A
DIVERSIFIED SERVICES - Business/Management Services
|
$100.72
|
-0.63
-0.62% |
$101.26
|
3,810,981
89.73% of 50 DAV
50 DAV is 4,247,000
|
$101.50
-0.77%
|
10/24/2011
|
$94.21
|
PP = $94.85
|
|
MB = $99.59
|
Most Recent Note - 12/20/2011 1:48:22 PM
G - Inching higher today into new all-time high territory. Color code is changed to green as it is getting extended from its prior base and trading above its "max buy" level. Prior highs in the $95 area and its 50 DMA line define chart support to watch on pullbacks.
>>> The latest Featured Stock Update with an annotated graph appeared on 12/15/2011. Click here.
View all notes |
Alert me of new notes |
CANSLIM.net Company Profile |
SEC |
Zacks Reports |
StockTalk |
News |
Chart |
Request a new note
C
A N
S L
I M
|
|
|
|
THESE ARE NOT BUY RECOMMENDATIONS!
Comments contained in the body of this report are technical
opinions only. The material herein has been obtained
from sources believed to be reliable and accurate, however,
its accuracy and completeness cannot be guaranteed.
This site is not an investment advisor, hence it does
not endorse or recommend any securities or other investments.
Any recommendation contained in this report may not
be suitable for all investors and it is not to be deemed
an offer or solicitation on our part with respect to
the purchase or sale of any securities. All trademarks,
service marks and trade names appearing in this report
are the property of their respective owners, and are
likewise used for identification purposes only.
This report is a service available
only to active Paid Premium Members.
You may opt-out of receiving report notifications
at any time. Questions or comments may be submitted
by writing to Premium Membership Services 665 S.E. 10 Street, Suite 201 Deerfield Beach, FL 33441-5634 or by calling 1-800-965-8307
or 954-785-1121.
|
|
|

