***Last / Change / Volume data in this table is the closing quote data***
Symbol/Exchange
Company Name
Industry Group |
PRICE |
CHANGE
(%Change) |
Day High |
Volume
(% DAV)
(% 50 day avg vol) |
52 Wk Hi
% From Hi |
Featured
Date |
Price
Featured |
Pivot Featured |
|
Max Buy |
ADS
-
NYSE
Alliance Data Sys Corp
COMPUTER SOFTWARE and SERVICES - Information and Delivery Service
|
$105.74
|
+0.02
0.02% |
$106.50
|
320,729
36.43% of 50 DAV
50 DAV is 880,300
|
$107.33
-1.48%
|
10/21/2011
|
$97.94
|
PP = $101.15
|
|
MB = $106.21
|
Most Recent Note - 12/20/2011 2:32:27 PM
Y - Up today without great volume conviction while perched within striking distance of a best-ever close. Just above its 50 DMA line it found support last week, meanwhile any subsequent violation of that important short-term average would raise concerns.
>>> The latest Featured Stock Update with an annotated graph appeared on 12/14/2011. Click here.
View all notes |
Alert me of new notes |
CANSLIM.net Company Profile |
SEC |
Zacks Reports |
StockTalk |
News |
Chart |
Request a new note
C
A N
S L
I M


|
ALXN
-
NASDAQ
Alexion Pharmaceuticals
DRUGS - Drug Manufacturers - Other
|
$67.36
|
-0.18
-0.27% |
$68.13
|
707,179
58.02% of 50 DAV
50 DAV is 1,218,900
|
$70.42
-4.35%
|
11/30/2011
|
$68.66
|
PP = $70.52
|
|
MB = $74.05
|
Most Recent Note - 12/21/2011 1:11:26 PM
Y - Reversed into the red after a small gap up today and 4 prior gains had it trading within close striking distance its all-time high. Recent lows near $62 define important near-term support to watch.
>>> The latest Featured Stock Update with an annotated graph appeared on 12/12/2011. Click here.
View all notes |
Alert me of new notes |
CANSLIM.net Company Profile |
SEC |
Zacks Reports |
StockTalk |
News |
Chart |
Request a new note
C
A N
S L
I M
|
CELG
-
NASDAQ
Celgene Corp
DRUGS - Drug Manufacturers - Major
|
$67.09
|
+0.54
0.81% |
$67.10
|
1,869,111
53.92% of 50 DAV
50 DAV is 3,466,700
|
$68.25
-1.70%
|
12/20/2011
|
$66.68
|
PP = $68.35
|
|
MB = $71.77
|
Most Recent Note - 12/20/2011 2:11:03 PM
Y - Gapped up today after a rebound above its 50 DMA line on the prior session helped its outlook improve. Color code is changed to yellow with a new pivot point cited based on its 52-week high plus 10 cents. Now only -2.2% off its 52-week high, subsequent volume-driven gains above the pivot point may trigger a new (or add-on) technical buy signal.
>>> The latest Featured Stock Update with an annotated graph appeared on 12/1/2011. Click here.
View all notes |
Alert me of new notes |
CANSLIM.net Company Profile |
SEC |
Zacks Reports |
StockTalk |
News |
Chart |
Request a new note
C
A N
S L
I M
|
FEIC
-
NASDAQ
F E I Co
ELECTRONICS - Diversified Electronics
|
$41.87
|
+1.01
2.47% |
$42.00
|
203,728
55.94% of 50 DAV
50 DAV is 364,200
|
$42.25
-0.90%
|
12/7/2011
|
$41.41
|
PP = $42.35
|
|
MB = $44.47
|
 Most Recent Note - 12/22/2011 5:45:15 PM
Y - Gapped up today and rallied for a best-ever close near its all-time high, but volume was below average behind its gain. Its 50 DMA line and prior lows in the $36 area define chart support. Disciplined investors would watch for a volume-driven gain above the pivot point to trigger a proper technical buy signal.
>>> The latest Featured Stock Update with an annotated graph appeared on 12/21/2011. Click here.
View all notes |
Alert me of new notes |
CANSLIM.net Company Profile |
SEC |
Zacks Reports |
StockTalk |
News |
Chart |
Request a new note
C
A N
S L
I M
|
GNC
-
NYSE
G N C Holdings Inc
RETAIL - Drug Stores
|
$28.36
|
-0.56
-1.94% |
$29.50
|
653,127
38.62% of 50 DAV
50 DAV is 1,691,100
|
$28.99
-2.17%
|
10/26/2011
|
$24.60
|
PP = $24.80
|
|
MB = $26.04
|
Most Recent Note - 12/22/2011 5:43:15 PM
G - After touching another new all-time high today it reversed into the red for a small loss on below average volume. It is extended from its prior base pattern. Prior chart highs and its 50 DMA line coincide in the $25-26 area defining important support to watch on pullbacks.
>>> The latest Featured Stock Update with an annotated graph appeared on 12/16/2011. Click here.
View all notes |
Alert me of new notes |
CANSLIM.net Company Profile |
SEC |
Zacks Reports |
StockTalk |
News |
Chart |
Request a new note
C
A N
S L
I M
|
Symbol/Exchange
Company Name
Industry Group |
PRICE |
CHANGE
(%Change) |
Day High |
Volume
(% DAV)
(% 50 day avg vol) |
52 Wk Hi
% From Hi |
Featured
Date |
Price
Featured |
Pivot Featured |
|
Max Buy |
HMSY
-
NASDAQ
H M S Holdings Corp
COMPUTER SOFTWARE and SERVICES - Healthcare Information Service
|
$31.41
|
+0.04
0.13% |
$31.90
|
349,205
32.80% of 50 DAV
50 DAV is 1,064,600
|
$32.16
-2.33%
|
10/27/2011
|
$26.44
|
PP = $28.37
|
|
MB = $29.79
|
Most Recent Note - 12/20/2011 2:14:48 PM
G - Gapped up today and it is challenging its all-time high with no resistance remaining. It is extended from its prior base. Prior highs in the $27-28 area acted as support during the recent pullback.
>>> The latest Featured Stock Update with an annotated graph appeared on 11/30/2011. Click here.
View all notes |
Alert me of new notes |
CANSLIM.net Company Profile |
SEC |
Zacks Reports |
StockTalk |
News |
Chart |
Request a new note
C
A N
S L
I M
|
ISRG
-
NASDAQ
Intuitive Surgical Inc
HEALTH SERVICES - Medical Appliances and Equipment
|
$447.86
|
+7.13
1.62% |
$450.00
|
258,018
73.85% of 50 DAV
50 DAV is 349,400
|
$449.06
-0.27%
|
12/20/2011
|
$442.43
|
PP = $449.16
|
|
MB = $471.62
|
Most Recent Note - 12/22/2011 5:47:09 PM
Y - Gain today on below average volume, finishing within close striking distance of new high territory. Color code was changed to yellow with new pivot point cited based on its 52-week high plus 10 cents. Volume driven gains above its pivot point may trigger a new (or add-on) technical buy signal. Important support is defined by its 50 DMA line.
>>> The latest Featured Stock Update with an annotated graph appeared on 12/13/2011. Click here.
View all notes |
Alert me of new notes |
CANSLIM.net Company Profile |
SEC |
Zacks Reports |
StockTalk |
News |
Chart |
Request a new note
C
A N
S L
I M
|
MELI
-
NASDAQ
Mercadolibre Inc
INTERNET - Internet Software and; Services
|
$83.58
|
+1.81
2.21% |
$83.87
|
521,882
73.66% of 50 DAV
50 DAV is 708,500
|
$95.48
-12.46%
|
12/5/2011
|
$91.08
|
PP = $92.83
|
|
MB = $97.47
|
Most Recent Note - 12/22/2011 5:48:06 PM
G - Up today with below average volume after slumping near its 50 DMA line and prior lows defining chart support near the $80 area. It stalled after volume-driven gains to new all-time highs in early-December, yet it has not encountered heavy distributional pressure.
>>> The latest Featured Stock Update with an annotated graph appeared on 12/5/2011. Click here.
View all notes |
Alert me of new notes |
CANSLIM.net Company Profile |
SEC |
Zacks Reports |
StockTalk |
News |
Chart |
Request a new note
C
A N
S L
I M
|
MG
-
NYSE
Mistras Group Inc
DIVERSIFIED SERVICES - Bulding and Faci;ity Management Services
|
$24.38
|
+0.09
0.37% |
$24.72
|
85,635
52.34% of 50 DAV
50 DAV is 163,600
|
$25.28
-3.56%
|
10/28/2011
|
$22.49
|
PP = $23.61
|
|
MB = $24.79
|
Most Recent Note - 12/21/2011 1:19:01 PM
Y - Trading back above its previously cited pivot point today. Prior highs in the $23 area define chart support along with its 50 DMA line.
>>> The latest Featured Stock Update with an annotated graph appeared on 12/8/2011. Click here.
View all notes |
Alert me of new notes |
CANSLIM.net Company Profile |
SEC |
Zacks Reports |
StockTalk |
News |
Chart |
Request a new note
C
A N
S L
I M
|
MKTX
-
NASDAQ
Marketaxess Holdings Inc
FINANCIAL SERVICES - Investment Brokerage - Nationa
|
$29.51
|
+0.26
0.89% |
$30.05
|
144,193
76.01% of 50 DAV
50 DAV is 189,700
|
$31.59
-6.58%
|
10/28/2011
|
$29.79
|
PP = $31.05
|
|
MB = $32.60
|
Most Recent Note - 12/21/2011 11:09:42 AM
Y - Gapped down today, abruptly reversing back into the prior base while promptly encountering distributional pressure similar to its abrupt reversal on 11/04/11. See the latest FSU analysis for more details and an annotated graph.
>>> The latest Featured Stock Update with an annotated graph appeared on 12/20/2011. Click here.
View all notes |
Alert me of new notes |
CANSLIM.net Company Profile |
SEC |
Zacks Reports |
StockTalk |
News |
Chart |
Request a new note
C
A N
S L
I M
|
Symbol/Exchange
Company Name
Industry Group |
PRICE |
CHANGE
(%Change) |
Day High |
Volume
(% DAV)
(% 50 day avg vol) |
52 Wk Hi
% From Hi |
Featured
Date |
Price
Featured |
Pivot Featured |
|
Max Buy |
OSIS
-
NASDAQ
O S I Systems Inc
ELECTRONICS - Semiconductor Equipment and Mate
|
$48.15
|
-0.26
-0.54% |
$48.99
|
84,114
70.27% of 50 DAV
50 DAV is 119,700
|
$49.04
-1.81%
|
11/1/2011
|
$42.07
|
PP = $45.57
|
|
MB = $47.85
|
Most Recent Note - 12/20/2011 2:00:44 PM
Y - Considerable gain today has it rallying within striking distance of a best-ever close. It found support above its 50 DMA line but made no progress since its gap gain with +44% above average volume on 11/30/11 triggered a technical buy signal.
>>> The latest Featured Stock Update with an annotated graph appeared on 11/28/2011. Click here.
View all notes |
Alert me of new notes |
CANSLIM.net Company Profile |
SEC |
Zacks Reports |
StockTalk |
News |
Chart |
Request a new note
C
A N
S L
I M
|
PRGO
-
NASDAQ
Perrigo Co
DRUGS - Drug Related Products
|
$100.78
|
-1.69
-1.65% |
$104.70
|
1,666,974
129.28% of 50 DAV
50 DAV is 1,289,400
|
$102.65
-1.82%
|
12/9/2011
|
$99.54
|
PP = $101.56
|
|
MB = $106.64
|
Most Recent Note - 12/20/2011 2:02:31 PM
Y - Gapped up today and it is rallying within striking distance of a best-ever close. Found impressive support while consolidating above its 50 DMA line recently. Insider buying was recently reported while perched near all-time highs, which is a reassuring sign. It has formed a late-stage base, however disciplined investors would watch for confirming gains to trigger a proper new technical buy signal. Chart readers may note that its Relative Strength line peaked in September and did not recently lead the way confirming new highs.
>>> The latest Featured Stock Update with an annotated graph appeared on 12/9/2011. Click here.
View all notes |
Alert me of new notes |
CANSLIM.net Company Profile |
SEC |
Zacks Reports |
StockTalk |
News |
Chart |
Request a new note
C
A N
S L
I M
|
RAX
-
NYSE
Rackspace Hosting Inc
INTERNET - Internet Software and; Services
|
$43.19
|
-0.86
-1.95% |
$44.54
|
1,336,659
85.18% of 50 DAV
50 DAV is 1,569,200
|
$46.50
-7.11%
|
11/8/2011
|
$44.28
|
PP = $46.27
|
|
MB = $48.58
|
Most Recent Note - 12/21/2011 12:39:22 PM
Y - Down considerably today, erasing the prior streak of 4 consecutive small gains, yet still perched within striking distance of its 52-week and all-time high. Its 50 DMA line defines near-term support to watch. That short-term moving average has risen since its positive crossover with the 200 DMA line shown on the graph in the latest FSU analysis dated 12/07/11.
>>> The latest Featured Stock Update with an annotated graph appeared on 12/7/2011. Click here.
View all notes |
Alert me of new notes |
CANSLIM.net Company Profile |
SEC |
Zacks Reports |
StockTalk |
News |
Chart |
Request a new note
C
A N
S L
I M
|
SWI
-
NYSE
Solarwinds Inc
COMPUTER SOFTWARE and SERVICES - Application Software
|
$28.92
|
-0.08
-0.28% |
$29.48
|
748,774
59.86% of 50 DAV
50 DAV is 1,250,900
|
$33.68
-14.13%
|
10/27/2011
|
$27.78
|
PP = $25.62
|
|
MB = $26.90
|
Most Recent Note - 12/21/2011 11:17:57 AM
G - Considerable loss today has it trading below its 50 DMA line (now $29.04) raising some concerns. Subsequent deterioration below its 12/14/11 low ($28.50) may trigger a more worrisome technical sell signal leading to a deeper consolidation including a possible revisit to prior chart highs in the $25-26 area or its 200 DMA line.
>>> The latest Featured Stock Update with an annotated graph appeared on 12/19/2011. Click here.
View all notes |
Alert me of new notes |
CANSLIM.net Company Profile |
SEC |
Zacks Reports |
StockTalk |
News |
Chart |
Request a new note
C
A N
S L
I M
|
TDG
-
NYSE
Transdigm Group Inc
AEROSPACE/DEFENSE - Aerospace/Defense Products and; Services
|
$97.25
|
+0.11
0.11% |
$97.92
|
154,249
42.11% of 50 DAV
50 DAV is 366,300
|
$102.73
-5.33%
|
11/9/2011
|
$98.45
|
PP = $95.14
|
|
MB = $99.90
|
Most Recent Note - 12/20/2011 2:26:25 PM
Y - Small gap up gain today on lighter volume while perched within striking distance of a best-ever close. Its 50 DMA line defines near-term support above recent lows where subsequent violations would trigger technical sell signals.
>>> The latest Featured Stock Update with an annotated graph appeared on 12/6/2011. Click here.
View all notes |
Alert me of new notes |
CANSLIM.net Company Profile |
SEC |
Zacks Reports |
StockTalk |
News |
Chart |
Request a new note
C
A N
S L
I M
|
Symbol/Exchange
Company Name
Industry Group |
PRICE |
CHANGE
(%Change) |
Day High |
Volume
(% DAV)
(% 50 day avg vol) |
52 Wk Hi
% From Hi |
Featured
Date |
Price
Featured |
Pivot Featured |
|
Max Buy |
UA
-
NYSE
Under Armour Inc Cl A
CONSUMER NON-DURABLES - Textile - Apparel Clothing
|
$70.59
|
-0.53
-0.75% |
$71.88
|
880,739
76.20% of 50 DAV
50 DAV is 1,155,900
|
$87.40
-19.23%
|
10/25/2011
|
$82.43
|
PP = $80.80
|
|
MB = $84.84
|
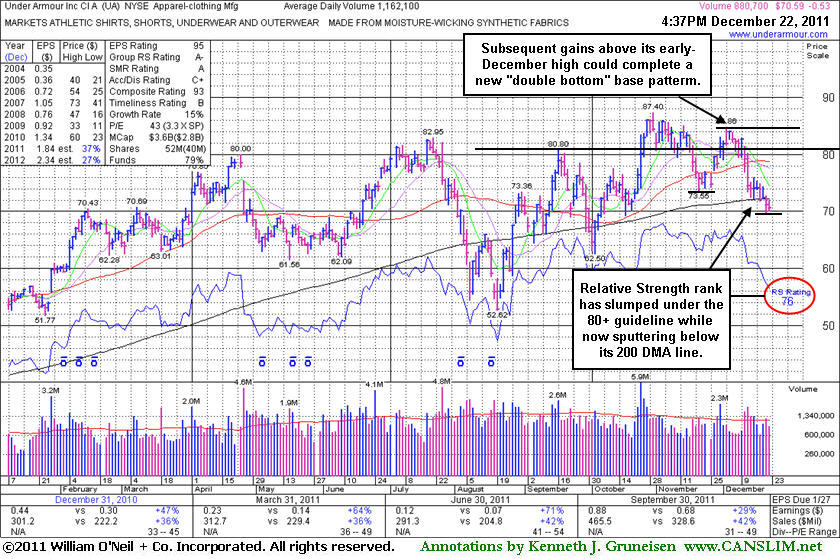
Most Recent Note - 12/22/2011 5:39:58 PM
Slumping further below its prior low and just under its 200 DMA line while its Relative Strength rank has fallen below the 80+ guideline to a 76. Based on weak action it will be dropped from the Featured Stocks list tonight. See the latest FSU analysis for more details and a new annotated graph.
>>> The latest Featured Stock Update with an annotated graph appeared on 12/22/2011. Click here.
View all notes |
Alert me of new notes |
CANSLIM.net Company Profile |
SEC |
Zacks Reports |
StockTalk |
News |
Chart |
Request a new note
C
A N
S L
I M
|
ULTA
-
NASDAQ
Ulta Salon Cosm & Frag
SPECIALTY RETAIL - Specialty Retail, Other
|
$64.16
|
-1.71
-2.60% |
$66.39
|
918,555
96.06% of 50 DAV
50 DAV is 956,200
|
$75.70
-15.24%
|
12/2/2011
|
$72.88
|
PP = $75.79
|
|
MB = $79.58
|
Most Recent Note - 12/22/2011 5:41:52 PM
Down today on average volume and testing prior lows near $64 previously noted as an important chart support level above its 200 DMA line. A rebound above its 50 DMA line is needed for its outlook to improve. It will be dropped from the Featured Stocks list tonight.
>>> The latest Featured Stock Update with an annotated graph appeared on 12/2/2011. Click here.
View all notes |
Alert me of new notes |
CANSLIM.net Company Profile |
SEC |
Zacks Reports |
StockTalk |
News |
Chart |
Request a new note
C
A N
S L
I M
|
V
-
NYSE
Visa Inc Cl A
DIVERSIFIED SERVICES - Business/Management Services
|
$100.54
|
-0.18
-0.18% |
$101.97
|
3,314,979
76.78% of 50 DAV
50 DAV is 4,317,700
|
$101.50
-0.95%
|
10/24/2011
|
$94.21
|
PP = $94.85
|
|
MB = $99.59
|
Most Recent Note - 12/20/2011 1:48:22 PM
G - Inching higher today into new all-time high territory. Color code is changed to green as it is getting extended from its prior base and trading above its "max buy" level. Prior highs in the $95 area and its 50 DMA line define chart support to watch on pullbacks.
>>> The latest Featured Stock Update with an annotated graph appeared on 12/15/2011. Click here.
View all notes |
Alert me of new notes |
CANSLIM.net Company Profile |
SEC |
Zacks Reports |
StockTalk |
News |
Chart |
Request a new note
C
A N
S L
I M
|