You are not logged in.
This means you
CAN ONLY VIEW reports that were published prior to Tuesday, April 15, 2025.
You
MUST UPGRADE YOUR MEMBERSHIP if you want to see any current reports.
AFTER MARKET UPDATE - TUESDAY, DECEMBER 20TH, 2011
Previous After Market Report Next After Market Report >>>
|
|
|
|
DOW |
+337.32 |
12,103.58 |
+2.87% |
|
Volume |
947,037,290 |
+22% |
|
Volume |
1,742,154,690 |
+14% |
|
NASDAQ |
+80.59 |
2,603.73 |
+3.19% |
|
Advancers |
2,678 |
86% |
|
Advancers |
2,192 |
80% |
|
S&P 500 |
+35.95 |
1,241.30 |
+2.98% |
|
Decliners |
382 |
12% |
|
Decliners |
470 |
17% |
|
Russell 2000 |
+29.66 |
738.22 |
+4.19% |
|
52 Wk Highs |
123 |
|
|
52 Wk Highs |
50 |
|
|
S&P 600 |
+16.40 |
413.57 |
+4.13% |
|
52 Wk Lows |
23 |
|
|
52 Wk Lows |
84 |
|
|
 |
Major Averages Rally With Better Volume and Positive Breadth
Kenneth J. Gruneisen - Passed the CAN SLIM® Master's Exam
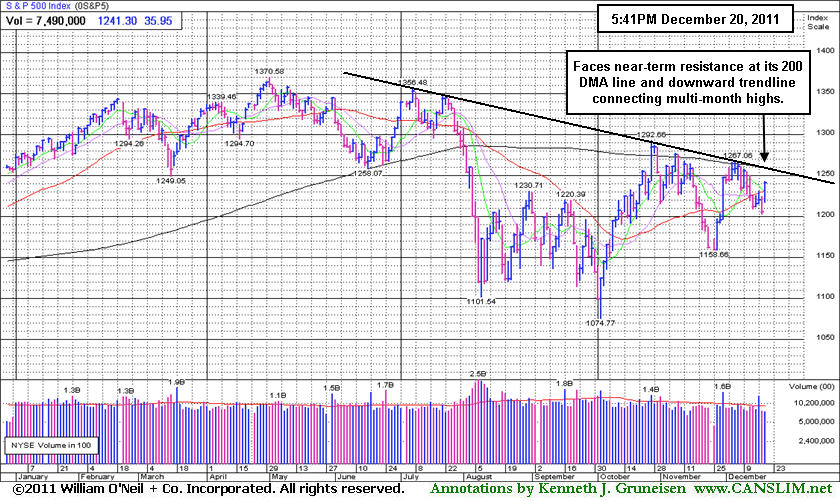
All major US averages posted impressive gains on Tuesday and the Dow Jones Industrial Average rallied above the psychologically important 12,000 level. The volume totals reported on the NYSE and on the Nasdaq exchange rose but remained near average, whereas gains underpinned by robust above average buying demand from the institutional crowd would be viewed as a more reassuring sign of a potentially sustainable rally. Breadth was clearly positive as advancers outnumbered declining issues 7-1 on the NYSE and by almost 5-1 on the Nasdaq exchange. New 52-week highs outnumbered new 52-week lows on the NYSE while new lows still outnumbered new highs on the Nasdaq exchange. There were 37 high-ranked companies from the CANSLIM.net Leaders List that made new 52-week highs and appeared on the CANSLIM.net BreakOuts Page, up from the prior session total of 23 stocks. There were gains for all of the 18 high-ranked companies currently included on the Featured Stocks Page.
Bulls took charge from the opening bell, prompting December wishes of a 'Santa Claus' rally. Stocks gained ground throughout the day following a sharp rise in November housing starts and building permits. The positive data boosted home builder stocks, and KBH Homes (KBH +10.10%) and Lennar Corp (LEN +6.32%) rallied while a journalist with Bloomberg said that homebuilders - "shot through the roof."
Financial stocks also rallied on the positive economic readings with Bank of America Corp (BAC +3.71%) and Citigroup Inc (C +4.55%) posting solid gains. On the earnings front, investment bank Jefferies Group Inc (JEF +22.88%) spiking higher after reporting earnings well above estimates and declaring a dividend. Software Company Red Hat Inc (RHT -8.90%) fell on disappointing earnings, while BlackBerry maker Research In Motion Ltd (RIMM -2.87%) slumped after showing a fifth straight quarter of declining sales.
Treasuries fell on a flight to risk with 10-year note finishing down 31/32 to yield 1.92%. Commodities finished higher with West Texas crude gaining $3.34 to $97.22 per barrel and Comex gold adding $21.20 to $1,615.60 an ounce.
Our monthly newsletter CANSLIM.net News will be published soon with an informative review of current market conditions, leading groups, and best buy candidates. Via the Premium Member Homepage links to all prior reports and webcasts are always available.
PICTURED: The benchmark S&P 500 Index faces near-term resistance at its 200-day moving average (DMA) line and a downward trendline connecting multi-month highs.
|
 Kenneth J. Gruneisen started out as a licensed stockbroker in August 1987, a couple of months prior to the historic stock market crash that took the Dow Jones Industrial Average down -22.6% in a single day. He has published daily fact-based fundamental and technical analysis on high-ranked stocks online for two decades. Through FACTBASEDINVESTING.COM, Kenneth provides educational articles, news, market commentary, and other information regarding proven investment systems that work in good times and bad.
Comments contained in the body of this report are technical opinions only and are not necessarily those of Gruneisen Growth Corp. The material herein has been obtained from sources believed to be reliable and accurate, however, its accuracy and completeness cannot be guaranteed. Our firm, employees, and customers may effect transactions, including transactions contrary to any recommendation herein, or have positions in the securities mentioned herein or options with respect thereto. Any recommendation contained in this report may not be suitable for all investors and it is not to be deemed an offer or solicitation on our part with respect to the purchase or sale of any securities. |
|
 |
Financial, Tech, Energy, and Defensive Groups Enjoy Rally
Kenneth J. Gruneisen - Passed the CAN SLIM® Master's Exam
Solid gains from financial stocks were a big influence on the major averages as the Broker/Dealer Index ($XBD +5.95%) and Bank Index ($BKX +4.12%) tallied large gains. The Retail Index ($RLX +2.85%) rose and the tech sector heated up as the Networking Index ($NWX +5.89%), Semiconductor Index ($SOX +4.48%), Biotechnology Index ($BTK +3.16%), and Internet Index ($IIX +3.32%) clicked up considerable gains. Energy-related shares surged as the Oil Services Index ($OSX +5.39%) and Integrated Oil Index ($XOI +3.78%) charged higher. Defensive groups also posted big gains as the Healthcare Index ($HMO +3.38%) and Gold & Silver Index ($XAU +3.55%) rounded out a solidly positive session.
Charts courtesy www.stockcharts.com
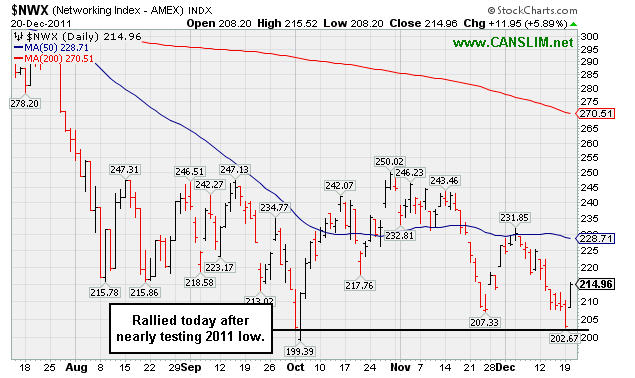
PICTURED: The Networking Index ($NWX +5.89%) rallied today after nearly testing its 2011 low.
| Oil Services |
$OSX |
216.13 |
+11.05 |
+5.39% |
-11.83% |
| Healthcare |
$HMO |
2,279.86 |
+74.53 |
+3.38% |
+34.74% |
| Integrated Oil |
$XOI |
1,195.23 |
+43.54 |
+3.78% |
-1.48% |
| Semiconductor |
$SOX |
358.73 |
+15.37 |
+4.48% |
-12.89% |
| Networking |
$NWX |
214.96 |
+11.95 |
+5.89% |
-23.38% |
| Internet |
$IIX |
279.35 |
+8.97 |
+3.32% |
-9.22% |
| Broker/Dealer |
$XBD |
83.47 |
+4.68 |
+5.95% |
-31.31% |
| Retail |
$RLX |
528.76 |
+14.65 |
+2.85% |
+4.01% |
| Gold & Silver |
$XAU |
185.40 |
+6.36 |
+3.55% |
-18.17% |
| Bank |
$BKX |
38.20 |
+1.51 |
+4.12% |
-26.83% |
| Biotech |
$BTK |
1,049.60 |
+32.15 |
+3.16% |
-19.11% |
|
|
|
 |
Volume Backed Gains Lift Stock Above Pivot Point Previously Cited
Kenneth J. Gruneisen - Passed the CAN SLIM® Master's Exam
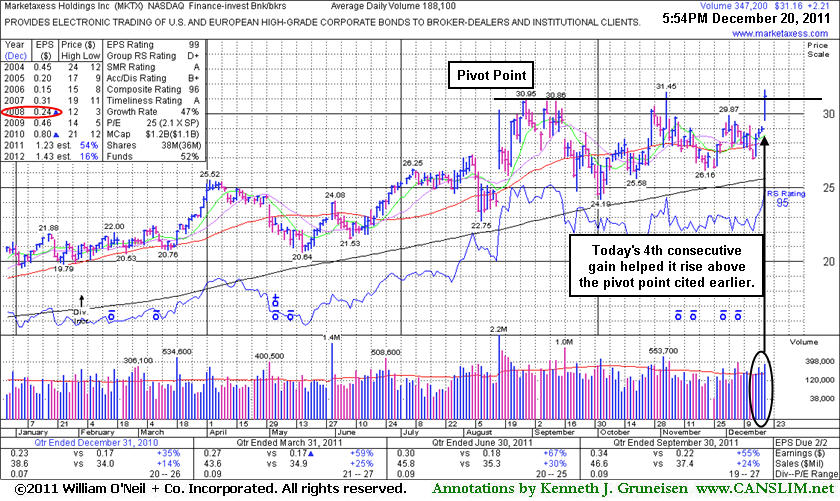
Marketaxess Holdings Inc (MKTX +$2.21 or +7.63% to $31.16 ) posted a solid gain today with +88% above average volume, its 4th consecutive gain, finishing at a best-ever close. It is clear of all resistance due to overhead supply and its big gain arguably triggered a technical buy signal. If a new pivot point was now cited based upon its 11/03/11 high ($31.45) the close today would technically have fallen short of triggering a proper buy signal. Additional confirming gains would be a welcome reassurance. Prior lows and its 200 DMA line in the $24-25 area define the next important support area to watch. Disciplined investors always limit losses if a stock falls more than -7% from their purchase price. It had been featured in yellow in the 10/28/11 mid-day report (read here) with a pivot point cited was based on its 8/30/11 high plus 10 cents. Its last appearance in this FSU section was on 11/23/11 with an annotated graph under the headline, "Deterioration Following Failed Breakout Attempt ." It sputtered for weeks without meaningful progress while weaving above and below its 50-day moving average (DMA) line.
On November 3rd it nearly met the guidelines as a buy candidate, however it was noted that evening - "Hit a new 52-week high and traded above its pivot point today, however it closed below the mark and volume was just +21% above average behind the considerable gain. The minimum guideline requires at least +40% above average volume behind a gain above a stock's pivot point to trigger a proper new (or add-on) technical buy signal. Disciplined investors may use a tactic called pyramiding to accumulate shares without chasing the stock outside of the ideal buy range." Subsequent weakness raised concerns and its color code was changed to green as it sank below its 50 DMA line. Any investors who may have made initial purchases using the "pyramiding" approach would not have accumulated a full position before the subsequent weakness prompted defensive action and the sale of the partial position if it fell -7% from the buy price. This loss-limiting example demonstrates the value of carefully following the fact-based system as investors are trained in the Certification.
Its fundamentals remain strong and it just reported earnings +55% on +24% sales revenues for the quarter ended September 30, 2011 versus the year ago period. MKTX has earned high ranks and reasonably satisfies the guidelines concerning quarterly and annual earnings (C and A criteria), however a downturn in FY '08 (see red oval) was previously noted as a flaw. Additionally, the Finance - Investment Bankers industry group currently has a Group Relative Strength rating of D+ which indicates the group has been a poor performer rather than a strong leader (L criteria). The number of top-rated funds owning its shares rose from 168 in Dec '10 to 238 in Sep '11, a reassuring sign concerning the I criteria.
All prior notes can be reviewed on the Company Profile page under the "View All Notes" tab. The "Featured Articles and Daily Graphs" tab on the Company Profile page allows members to view all of the previous detailed analysis and annotated graphs published on any stocks we have covered.
|
|
|
Color Codes Explained :
Y - Better candidates highlighted by our
staff of experts.
G - Previously featured
in past reports as yellow but may no longer be buyable under the
guidelines.
***Last / Change / Volume data in this table is the closing quote data***
Symbol/Exchange
Company Name
Industry Group |
PRICE |
CHANGE
(%Change) |
Day High |
Volume
(% DAV)
(% 50 day avg vol) |
52 Wk Hi
% From Hi |
Featured
Date |
Price
Featured |
Pivot Featured |
|
Max Buy |
ADS
-
NYSE
Alliance Data Sys Corp
COMPUTER SOFTWARE and SERVICES - Information and Delivery Service
|
$105.03
|
+2.23
2.17% |
$105.42
|
453,016
51.43% of 50 DAV
50 DAV is 880,900
|
$107.33
-2.14%
|
10/21/2011
|
$97.94
|
PP = $101.15
|
|
MB = $106.21
|
 Most Recent Note - 12/20/2011 2:32:27 PM
Y - Up today without great volume conviction while perched within striking distance of a best-ever close. Just above its 50 DMA line it found support last week, meanwhile any subsequent violation of that important short-term average would raise concerns.
>>> The latest Featured Stock Update with an annotated graph appeared on 12/14/2011. Click here.
View all notes |
Alert me of new notes |
CANSLIM.net Company Profile |
SEC |
Zacks Reports |
StockTalk |
News |
Chart |
Request a new note
C
A N
S L
I M


|
ALXN
-
NASDAQ
Alexion Pharmaceuticals
DRUGS - Drug Manufacturers - Other
|
$68.99
|
+1.75
2.60% |
$69.13
|
1,164,231
95.83% of 50 DAV
50 DAV is 1,214,900
|
$70.42
-2.03%
|
11/30/2011
|
$68.66
|
PP = $70.52
|
|
MB = $74.05
|
Most Recent Note - 12/20/2011 2:17:19 PM
Y - Small gap up today has it on track for a 4th consecutive gain and perched within striking distance of a best-ever close. Recent lows near $62 define important near-term support to watch.
>>> The latest Featured Stock Update with an annotated graph appeared on 12/12/2011. Click here.
View all notes |
Alert me of new notes |
CANSLIM.net Company Profile |
SEC |
Zacks Reports |
StockTalk |
News |
Chart |
Request a new note
C
A N
S L
I M
|
CELG
-
NASDAQ
Celgene Corp
DRUGS - Drug Manufacturers - Major
|
$66.43
|
+1.85
2.86% |
$66.88
|
5,353,791
154.74% of 50 DAV
50 DAV is 3,459,900
|
$68.25
-2.67%
|
12/20/2011
|
$66.68
|
PP = $68.35
|
|
MB = $71.77
|
Most Recent Note - 12/20/2011 2:11:03 PM
Y - Gapped up today after a rebound above its 50 DMA line on the prior session helped its outlook improve. Color code is changed to yellow with a new pivot point cited based on its 52-week high plus 10 cents. Now only -2.2% off its 52-week high, subsequent volume-driven gains above the pivot point may trigger a new (or add-on) technical buy signal.
>>> The latest Featured Stock Update with an annotated graph appeared on 12/1/2011. Click here.
View all notes |
Alert me of new notes |
CANSLIM.net Company Profile |
SEC |
Zacks Reports |
StockTalk |
News |
Chart |
Request a new note
C
A N
S L
I M
|
FEIC
-
NASDAQ
F E I Co
ELECTRONICS - Diversified Electronics
|
$41.04
|
+2.12
5.45% |
$41.16
|
256,421
70.23% of 50 DAV
50 DAV is 365,100
|
$42.25
-2.86%
|
12/7/2011
|
$41.41
|
PP = $42.35
|
|
MB = $44.47
|
Most Recent Note - 12/20/2011 2:12:49 PM
Y - Gapped up today, rising within striking distance of a best-ever close. Its 50 DMA line defines important near-term chart support along with prior lows in the $36 area. Disciplined investors would watch for a volume-driven gain above the pivot point to trigger a proper technical buy signal.
>>> The latest Featured Stock Update with an annotated graph appeared on 11/25/2011. Click here.
View all notes |
Alert me of new notes |
CANSLIM.net Company Profile |
SEC |
Zacks Reports |
StockTalk |
News |
Chart |
Request a new note
C
A N
S L
I M
|
GNC
-
NYSE
G N C Holdings Inc
RETAIL - Drug Stores
|
$28.66
|
+0.69
2.47% |
$28.97
|
1,163,856
69.49% of 50 DAV
50 DAV is 1,674,900
|
$28.91
-0.86%
|
10/26/2011
|
$24.60
|
PP = $24.80
|
|
MB = $26.04
|
Most Recent Note - 12/20/2011 2:25:07 PM
G - Touched a new all-time high today with a 3rd consecutive small gain on below average volume. It is extended from its prior base pattern. Prior chart highs and its 50 DMA line coincide in the $25-26 area defining important support to watch on pullbacks.
>>> The latest Featured Stock Update with an annotated graph appeared on 12/16/2011. Click here.
View all notes |
Alert me of new notes |
CANSLIM.net Company Profile |
SEC |
Zacks Reports |
StockTalk |
News |
Chart |
Request a new note
C
A N
S L
I M
|
Symbol/Exchange
Company Name
Industry Group |
PRICE |
CHANGE
(%Change) |
Day High |
Volume
(% DAV)
(% 50 day avg vol) |
52 Wk Hi
% From Hi |
Featured
Date |
Price
Featured |
Pivot Featured |
|
Max Buy |
HMSY
-
NASDAQ
H M S Holdings Corp
COMPUTER SOFTWARE and SERVICES - Healthcare Information Service
|
$31.59
|
+1.09
3.57% |
$32.01
|
748,817
70.84% of 50 DAV
50 DAV is 1,057,100
|
$32.16
-1.77%
|
10/27/2011
|
$26.44
|
PP = $28.37
|
|
MB = $29.79
|
Most Recent Note - 12/20/2011 2:14:48 PM
G - Gapped up today and it is challenging its all-time high with no resistance remaining. It is extended from its prior base. Prior highs in the $27-28 area acted as support during the recent pullback.
>>> The latest Featured Stock Update with an annotated graph appeared on 11/30/2011. Click here.
View all notes |
Alert me of new notes |
CANSLIM.net Company Profile |
SEC |
Zacks Reports |
StockTalk |
News |
Chart |
Request a new note
C
A N
S L
I M
|
ISRG
-
NASDAQ
Intuitive Surgical Inc
HEALTH SERVICES - Medical Appliances and Equipment
|
$443.58
|
+11.39
2.64% |
$445.38
|
323,850
92.79% of 50 DAV
50 DAV is 349,000
|
$449.06
-1.22%
|
12/20/2011
|
$442.43
|
PP = $449.16
|
|
MB = $471.62
|
Most Recent Note - 12/20/2011 2:21:35 PM
Y - Posting a 4th consecutive gain today and rising within striking distance of new high territory. Color code is changed to yellow with new pivot point cited based on its 52-week high plus 10 cents. Volume driven gains above its pivot point may trigger a new (or add-on) technical buy signal. Important support is defined by its 50 DMA line.
>>> The latest Featured Stock Update with an annotated graph appeared on 12/13/2011. Click here.
View all notes |
Alert me of new notes |
CANSLIM.net Company Profile |
SEC |
Zacks Reports |
StockTalk |
News |
Chart |
Request a new note
C
A N
S L
I M
|
MELI
-
NASDAQ
Mercadolibre Inc
INTERNET - Internet Software and; Services
|
$85.99
|
+2.77
3.33% |
$86.41
|
277,491
39.03% of 50 DAV
50 DAV is 711,000
|
$95.48
-9.94%
|
12/5/2011
|
$91.08
|
PP = $92.83
|
|
MB = $97.47
|
Most Recent Note - 12/20/2011 2:23:12 PM
G - Small gap up gain today halted a streak of 6 consecutive losses on near average or lighter volume. Now -10.4% off its all-time high, its color code was changed to green based on its deterioration below the pivot point cited. Disciplined investors limit losses if ever a stock falls -7% from their purchase price.
>>> The latest Featured Stock Update with an annotated graph appeared on 12/5/2011. Click here.
View all notes |
Alert me of new notes |
CANSLIM.net Company Profile |
SEC |
Zacks Reports |
StockTalk |
News |
Chart |
Request a new note
C
A N
S L
I M
|
MG
-
NYSE
Mistras Group Inc
DIVERSIFIED SERVICES - Bulding and Faci;ity Management Services
|
$23.22
|
+0.43
1.89% |
$23.68
|
231,050
137.61% of 50 DAV
50 DAV is 167,900
|
$25.28
-8.15%
|
10/28/2011
|
$22.49
|
PP = $23.61
|
|
MB = $24.79
|
Most Recent Note - 12/20/2011 2:34:31 PM
Y - Small gap up today halted a streak of 3 consecutive losses. It is perched near its pivot point, and prior highs in the $23 area define chart support along with its 50 DMA line.
>>> The latest Featured Stock Update with an annotated graph appeared on 12/8/2011. Click here.
View all notes |
Alert me of new notes |
CANSLIM.net Company Profile |
SEC |
Zacks Reports |
StockTalk |
News |
Chart |
Request a new note
C
A N
S L
I M
|
MKTX
-
NASDAQ
Marketaxess Holdings Inc
FINANCIAL SERVICES - Investment Brokerage - Nationa
|
$31.16
|
+2.21
7.63% |
$31.59
|
355,215
188.84% of 50 DAV
50 DAV is 188,100
|
$31.45
-0.92%
|
10/28/2011
|
$29.79
|
PP = $31.05
|
|
MB = $32.60
|
Most Recent Note - 12/20/2011 1:59:00 PM
Y - A volume-driven gain for a new high may confirm a technical buy signal. Gapped up for a considerable gain today, on track for a 4th consecutive gain and perched within close striking distance of a best-ever close.
>>> The latest Featured Stock Update with an annotated graph appeared on 12/20/2011. Click here.
View all notes |
Alert me of new notes |
CANSLIM.net Company Profile |
SEC |
Zacks Reports |
StockTalk |
News |
Chart |
Request a new note
C
A N
S L
I M
|
Symbol/Exchange
Company Name
Industry Group |
PRICE |
CHANGE
(%Change) |
Day High |
Volume
(% DAV)
(% 50 day avg vol) |
52 Wk Hi
% From Hi |
Featured
Date |
Price
Featured |
Pivot Featured |
|
Max Buy |
OSIS
-
NASDAQ
O S I Systems Inc
ELECTRONICS - Semiconductor Equipment and Mate
|
$48.30
|
+2.97
6.55% |
$48.41
|
115,531
95.17% of 50 DAV
50 DAV is 121,400
|
$49.04
-1.51%
|
11/1/2011
|
$42.07
|
PP = $45.57
|
|
MB = $47.85
|
Most Recent Note - 12/20/2011 2:00:44 PM
Y - Considerable gain today has it rallying within striking distance of a best-ever close. It found support above its 50 DMA line but made no progress since its gap gain with +44% above average volume on 11/30/11 triggered a technical buy signal.
>>> The latest Featured Stock Update with an annotated graph appeared on 11/28/2011. Click here.
View all notes |
Alert me of new notes |
CANSLIM.net Company Profile |
SEC |
Zacks Reports |
StockTalk |
News |
Chart |
Request a new note
C
A N
S L
I M
|
PRGO
-
NASDAQ
Perrigo Co
DRUGS - Drug Related Products
|
$100.80
|
+2.77
2.83% |
$101.64
|
1,307,927
102.61% of 50 DAV
50 DAV is 1,274,600
|
$101.94
-1.12%
|
12/9/2011
|
$99.54
|
PP = $101.56
|
|
MB = $106.64
|
Most Recent Note - 12/20/2011 2:02:31 PM
Y - Gapped up today and it is rallying within striking distance of a best-ever close. Found impressive support while consolidating above its 50 DMA line recently. Insider buying was recently reported while perched near all-time highs, which is a reassuring sign. It has formed a late-stage base, however disciplined investors would watch for confirming gains to trigger a proper new technical buy signal. Chart readers may note that its Relative Strength line peaked in September and did not recently lead the way confirming new highs.
>>> The latest Featured Stock Update with an annotated graph appeared on 12/9/2011. Click here.
View all notes |
Alert me of new notes |
CANSLIM.net Company Profile |
SEC |
Zacks Reports |
StockTalk |
News |
Chart |
Request a new note
C
A N
S L
I M
|
RAX
-
NYSE
Rackspace Hosting Inc
INTERNET - Internet Software and; Services
|
$45.16
|
+0.95
2.15% |
$45.45
|
1,684,316
107.85% of 50 DAV
50 DAV is 1,561,700
|
$46.50
-2.87%
|
11/8/2011
|
$44.28
|
PP = $46.27
|
|
MB = $48.58
|
Most Recent Note - 12/20/2011 2:04:10 PM
Y - Up today on light volume for a 4th consecutive small gain. Held its ground near its 52-week and all-time high, making limited price progress in recent weeks. Its Relative Strength line has led the way into new high territory recently, which is recognized as a positive characteristic in buy candidates. Support to watch is at its closely coinciding 50 and 200 DMA lines. Subsequent violations would trigger damaging technical sell signals.
>>> The latest Featured Stock Update with an annotated graph appeared on 12/7/2011. Click here.
View all notes |
Alert me of new notes |
CANSLIM.net Company Profile |
SEC |
Zacks Reports |
StockTalk |
News |
Chart |
Request a new note
C
A N
S L
I M
|
SWI
-
NYSE
Solarwinds Inc
COMPUTER SOFTWARE and SERVICES - Application Software
|
$30.58
|
+1.32
4.51% |
$30.66
|
863,000
69.36% of 50 DAV
50 DAV is 1,244,200
|
$33.68
-9.20%
|
10/27/2011
|
$27.78
|
PP = $25.62
|
|
MB = $26.90
|
Most Recent Note - 12/20/2011 2:05:19 PM
G - Gapped up today for a gain on light volume. Halted its slide after slumping near its 50 DMA line, and that important short-term average was noted as initial support to watch above prior chart highs.
>>> The latest Featured Stock Update with an annotated graph appeared on 12/19/2011. Click here.
View all notes |
Alert me of new notes |
CANSLIM.net Company Profile |
SEC |
Zacks Reports |
StockTalk |
News |
Chart |
Request a new note
C
A N
S L
I M
|
TDG
-
NYSE
Transdigm Group Inc
AEROSPACE/DEFENSE - Aerospace/Defense Products and; Services
|
$96.92
|
+1.36
1.42% |
$97.64
|
187,161
51.05% of 50 DAV
50 DAV is 366,600
|
$102.73
-5.66%
|
11/9/2011
|
$98.45
|
PP = $95.14
|
|
MB = $99.90
|
Most Recent Note - 12/20/2011 2:26:25 PM
Y - Small gap up gain today on lighter volume while perched within striking distance of a best-ever close. Its 50 DMA line defines near-term support above recent lows where subsequent violations would trigger technical sell signals.
>>> The latest Featured Stock Update with an annotated graph appeared on 12/6/2011. Click here.
View all notes |
Alert me of new notes |
CANSLIM.net Company Profile |
SEC |
Zacks Reports |
StockTalk |
News |
Chart |
Request a new note
C
A N
S L
I M
|
Symbol/Exchange
Company Name
Industry Group |
PRICE |
CHANGE
(%Change) |
Day High |
Volume
(% DAV)
(% 50 day avg vol) |
52 Wk Hi
% From Hi |
Featured
Date |
Price
Featured |
Pivot Featured |
|
Max Buy |
UA
-
NYSE
Under Armour Inc Cl A
CONSUMER NON-DURABLES - Textile - Apparel Clothing
|
$72.34
|
+0.31
0.43% |
$74.38
|
969,261
84.09% of 50 DAV
50 DAV is 1,152,600
|
$87.40
-17.23%
|
10/25/2011
|
$82.43
|
PP = $80.80
|
|
MB = $84.84
|
Most Recent Note - 12/19/2011 5:39:09 PM
G - Loss today on light volume has it slumping further below the previously noted low ($73.55 on 11/21/11) and testing important chart support at its 200 DMA line. More damaging losses would raise serious concerns.
>>> The latest Featured Stock Update with an annotated graph appeared on 11/29/2011. Click here.
View all notes |
Alert me of new notes |
CANSLIM.net Company Profile |
SEC |
Zacks Reports |
StockTalk |
News |
Chart |
Request a new note
C
A N
S L
I M
|
ULTA
-
NASDAQ
Ulta Salon Cosm & Frag
SPECIALTY RETAIL - Specialty Retail, Other
|
$66.97
|
+2.06
3.17% |
$67.47
|
653,432
68.02% of 50 DAV
50 DAV is 960,600
|
$75.70
-11.53%
|
12/2/2011
|
$72.88
|
PP = $75.79
|
|
MB = $79.58
|
Most Recent Note - 12/20/2011 2:27:46 PM
G - Up today on below average volume after testing prior lows near $64 previously noted as an important chart support level above its 200 DMA line. A rebound above its 50 DMA line is needed for its outlook to improve.
>>> The latest Featured Stock Update with an annotated graph appeared on 12/2/2011. Click here.
View all notes |
Alert me of new notes |
CANSLIM.net Company Profile |
SEC |
Zacks Reports |
StockTalk |
News |
Chart |
Request a new note
C
A N
S L
I M
|
V
-
NYSE
Visa Inc Cl A
DIVERSIFIED SERVICES - Business/Management Services
|
$101.35
|
+2.77
2.81% |
$101.50
|
6,863,655
161.61% of 50 DAV
50 DAV is 4,247,000
|
$99.37
1.99%
|
10/24/2011
|
$94.21
|
PP = $94.85
|
|
MB = $99.59
|
Most Recent Note - 12/20/2011 1:48:22 PM
G - Inching higher today into new all-time high territory. Color code is changed to green as it is getting extended from its prior base and trading above its "max buy" level. Prior highs in the $95 area and its 50 DMA line define chart support to watch on pullbacks.
>>> The latest Featured Stock Update with an annotated graph appeared on 12/15/2011. Click here.
View all notes |
Alert me of new notes |
CANSLIM.net Company Profile |
SEC |
Zacks Reports |
StockTalk |
News |
Chart |
Request a new note
C
A N
S L
I M
|
|
|
|
THESE ARE NOT BUY RECOMMENDATIONS!
Comments contained in the body of this report are technical
opinions only. The material herein has been obtained
from sources believed to be reliable and accurate, however,
its accuracy and completeness cannot be guaranteed.
This site is not an investment advisor, hence it does
not endorse or recommend any securities or other investments.
Any recommendation contained in this report may not
be suitable for all investors and it is not to be deemed
an offer or solicitation on our part with respect to
the purchase or sale of any securities. All trademarks,
service marks and trade names appearing in this report
are the property of their respective owners, and are
likewise used for identification purposes only.
This report is a service available
only to active Paid Premium Members.
You may opt-out of receiving report notifications
at any time. Questions or comments may be submitted
by writing to Premium Membership Services 665 S.E. 10 Street, Suite 201 Deerfield Beach, FL 33441-5634 or by calling 1-800-965-8307
or 954-785-1121.
|
|
|

