You are not logged in.
This means you
CAN ONLY VIEW reports that were published prior to Monday, April 14, 2025.
You
MUST UPGRADE YOUR MEMBERSHIP if you want to see any current reports.
AFTER MARKET UPDATE - THURSDAY, DECEMBER 20TH, 2012
Previous After Market Report Next After Market Report >>>
|
|
|
|
DOW |
+59.75 |
13,311.72 |
+0.45% |
|
Volume |
682,598,370 |
-9% |
|
Volume |
1,647,109,440 |
-12% |
|
NASDAQ |
+6.03 |
3,050.39 |
+0.20% |
|
Advancers |
2,066 |
65% |
|
Advancers |
1,502 |
58% |
|
S&P 500 |
+7.88 |
1,443.69 |
+0.55% |
|
Decliners |
962 |
30% |
|
Decliners |
961 |
37% |
|
Russell 2000 |
+4.60 |
852.49 |
+0.54% |
|
52 Wk Highs |
150 |
|
|
52 Wk Highs |
89 |
|
|
S&P 600 |
+2.67 |
477.70 |
+0.56% |
|
52 Wk Lows |
12 |
|
|
52 Wk Lows |
18 |
|
|
 |
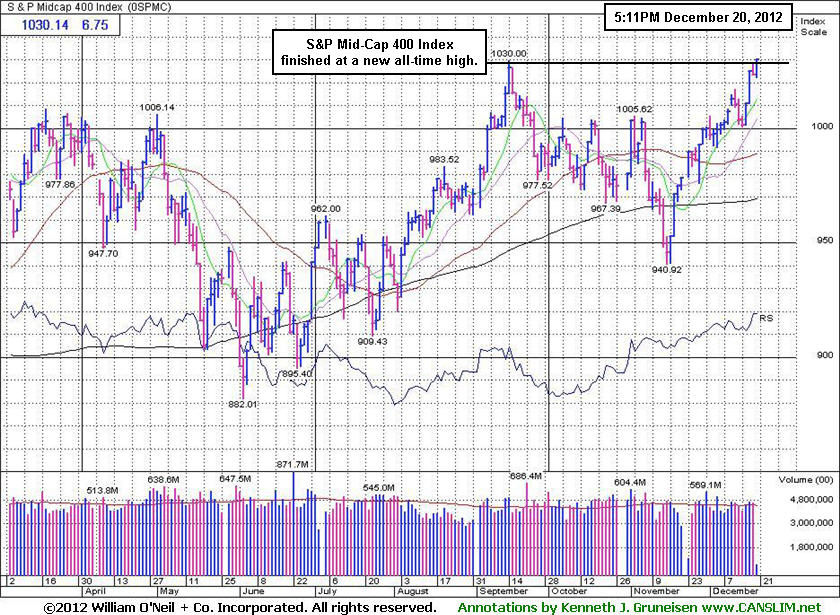
Mid-Cap 400 Index Has Rallied to a New All-Time High
Kenneth J. Gruneisen - Passed the CAN SLIM® Master's Exam
On Thursday the major averages posted small gains while the volume totals were reported lighter than the prior session totals on both the NYSE and the Nasdaq exchange. Advancers led decliners by a 2-1 margin on the NYSE and by a 3-2 margin on the Nasdaq exchange. The total number of stocks hitting new 52-week highs solidly outnumbered new 52-week lows on the NYSE and on the Nasdaq exchange. There were 67 high-ranked companies from the CANSLIM.net Leaders List making new 52-week highs and appearing on the CANSLIM.net BreakOuts Page, down from the prior session total of 67 stocks. Any sustainable rally requires a healthy crop of companies hitting new 52-week highs, so it has been an encouraging sign to see a meaningful expansion in leadership this week. There were gains for 7 of the 12 high-ranked companies currently included on the Featured Stocks Page.
On the economic front, third quarter GDP was revised up to 3.1% from 2.7%. Weekly initial jobless claims rose 17,000 to 361,000, roughly in line with consensus estimates. In Asian trading overnight, the Nikkei fell -1.0% in Tokyo after the Bank of Japan announced an increase to its asset purchase program. Existing home sales rose 5.9% in November and Mid-Atlantic manufacturing activity unexpectedly expanded in December.
Financials were the best performing sector. NYSE Euronext Inc (NYX +34.10%) rallied after agreeing to be acquired by rival Intercontinental Exchange Inc (ICE +1.40%) for $8.2 billion. CarMax Inc (KMX +8.98%) rose following its better-than-expected quarterly results. Retailer Bed, Bath & Beyond Inc (BBBY -6.50%) was down after lowering its earnings forecast. ConAgra Foods Inc (CAG +0.67%) inched higher following its better-than-expected quarterly results. Shares of Accenture Plc (ACN -1.96%) fell after reporting a decline in first-quarter revenues in its consulting business.
Technically, the market direction (M criteria) remains in a confirmed uptrend. The Nasdaq Composite Index, benchmark S&P 500 Index, and the Dow Jones Industrial Average are again collectively rallying above their respective 50-day moving average (DMA) lines. New buying efforts may be justified only in worthy high-ranked leaders. See the noteworthy companies included on the Featured Stocks Page.
Watch for an announcement via email concerning the next WEBCAST. The webcast will also be available via an updated link highlighted at the top of the Premium Member Homepage.
PICTURED: The S&P Mid-Cap 400 Index finished at a new all-time high.
|
 Kenneth J. Gruneisen started out as a licensed stockbroker in August 1987, a couple of months prior to the historic stock market crash that took the Dow Jones Industrial Average down -22.6% in a single day. He has published daily fact-based fundamental and technical analysis on high-ranked stocks online for two decades. Through FACTBASEDINVESTING.COM, Kenneth provides educational articles, news, market commentary, and other information regarding proven investment systems that work in good times and bad.
Comments contained in the body of this report are technical opinions only and are not necessarily those of Gruneisen Growth Corp. The material herein has been obtained from sources believed to be reliable and accurate, however, its accuracy and completeness cannot be guaranteed. Our firm, employees, and customers may effect transactions, including transactions contrary to any recommendation herein, or have positions in the securities mentioned herein or options with respect thereto. Any recommendation contained in this report may not be suitable for all investors and it is not to be deemed an offer or solicitation on our part with respect to the purchase or sale of any securities. |
|
 |
Financial, Medical, and Energy-Related Groups Led Gains
Kenneth J. Gruneisen - Passed the CAN SLIM® Master's Exam
Gains from the Bank Index ($BKX +1.33%) and the Broker/Dealer Index ($XBD +0.97%) underpinned the major averages' rally on Thursday. Energy-related shares posted gains as the Oil Services Index ($OSX +0.61%) and the Integrated Oil Index ($XOI +0.72%) rose. Medical-related shares also rose as the Biotechnology Index ($BTK +0.78%) and the Healthcare Index ($HMO +1.01%) tallied gains. Modest gains for the Networking Index ($NWX +0.43%) and the Internet Index ($IIX +0.56%) led the tech sector while the Semiconductor Index ($SOX +0.01%) finished flat. The Retail Index ($RLX -0.12%) inched lower and the Gold & Silver Index ($XAU -0.52%) lagged as it finished with a small loss.
Charts courtesy www.stockcharts.com
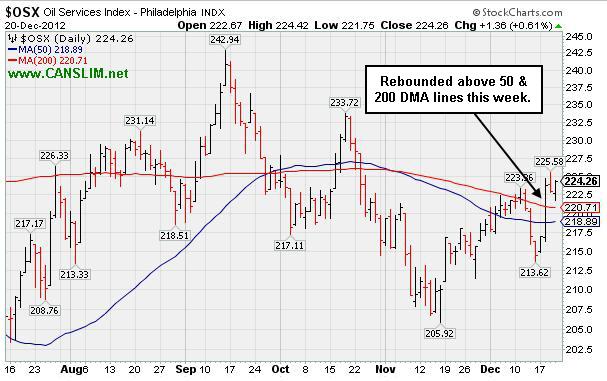
PICTURED: The Oil Services Index ($OSX +0.61%) rebounded above its 50-day and 200-day moving average (DMA) linesd this week.
| Oil Services |
$OSX |
224.26 |
+1.36 |
+0.61% |
+3.69% |
| Healthcare |
$HMO |
2,546.49 |
+25.51 |
+1.01% |
+11.61% |
| Integrated Oil |
$XOI |
1,263.82 |
+9.00 |
+0.72% |
+2.82% |
| Semiconductor |
$SOX |
389.49 |
+0.02 |
+0.01% |
+6.87% |
| Networking |
$NWX |
231.14 |
+1.00 |
+0.43% |
+7.43% |
| Internet |
$IIX |
335.47 |
+1.85 |
+0.56% |
+19.07% |
| Broker/Dealer |
$XBD |
93.65 |
+0.90 |
+0.97% |
+12.46% |
| Retail |
$RLX |
661.16 |
-0.81 |
-0.12% |
+26.37% |
| Gold & Silver |
$XAU |
160.08 |
-0.83 |
-0.52% |
-11.38% |
| Bank |
$BKX |
51.90 |
+0.68 |
+1.33% |
+31.79% |
| Biotech |
$BTK |
1,572.17 |
+12.21 |
+0.78% |
+44.05% |
|
|
|
 |
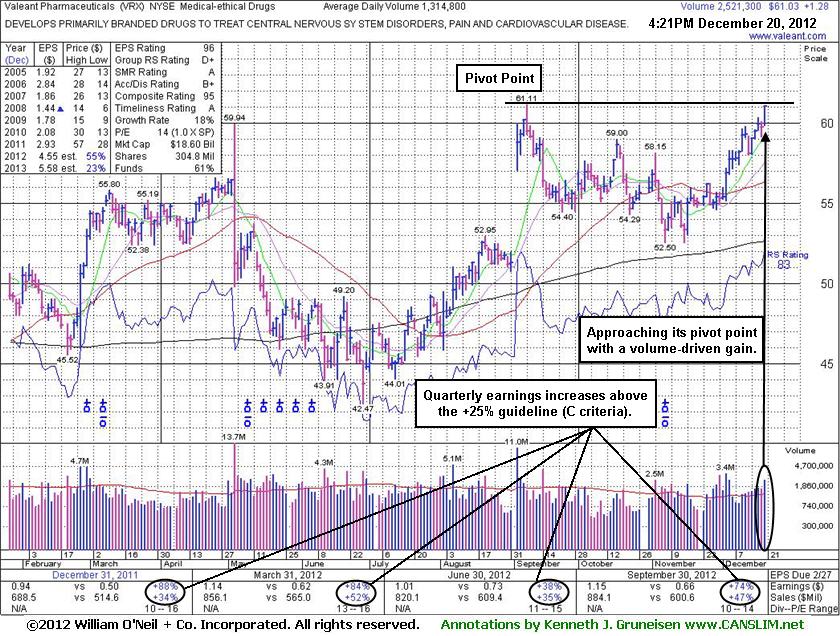
Finished Near Pivot Point With Volume Behind Solid Gain
Kenneth J. Gruneisen - Passed the CAN SLIM® Master's Exam
Often, when a leading stock is setting up to breakout of a solid base it is highlighted in CANSLIM.net's Mid-Day Breakouts Report. Sometimes stocks are highlighted shortly after a technical breakout, yet while the potential buy candidate may still be considered action-worthy. The most relevant factors are noted in the report which alerts prudent CANSLIM oriented investors to place the issue in their watch list. After doing any necessary backup research, the investor is prepared to act after the stock triggers a technical buy signal (breaks above its pivot point on more than +50% average turnover) but before it gets too extended from a sound base. In the event the stock fails to trigger a technical buy signal and its price declines then it will simply be removed from the watch list. Disciplined investors know to buy as near as possible to the pivot point and avoid chasing stocks after they have rallied more than +5% above their pivot point. It is crucial to always limit losses whenever any stock heads the wrong direction, and disciplined investors sell if a struggling stock ever falls more than -7% from their purchase price.
Valeant Pharmaceuticals (VRX +$1.28 or +2.14% to $61.03) finished strong after it was highlighted in yellow with pivot point cited based on its 9/07/12 high plus 10 cents in the earlier mid-day report (read here). It rallied with +92% above average volume and challenged its pivot point, however, disciplined investors know that a volume-driven gain above a stock's pivot point is necessary to trigger a proper technical buy signal before taking action. Keep in mind that it encountered stubborn resistance in prior months near the $60-61 area. In the Certifuication they teach a tactic called "pyramiding" that allows investors to let the market action dictate how heavily they position themselves in fresh buy candidates.
Quarterly earnings increases (C criteria) have been strong and well above the +25% guideline. A downturn in FY '07 and '08 earnings (A criteria) has been followed by a strong earnings rebound in recent years. The number of top-rated funds owning its shares rose from 818 in Mar '12 in to 889 in Sep '12, a reassuring trend concerning the I criteria. Its current Up/Down Volume Ratio of 1.4 is also an unbiased indication that its shares have been under accumulation over the past 50 days. Although it is of some concern that the Medical - Ethical Drugs group's Relative Strength rating is weak, there have been a couple of strong performers in the group which offer reassuring signs concerning the L criteria.
|
|
|
Color Codes Explained :
Y - Better candidates highlighted by our
staff of experts.
G - Previously featured
in past reports as yellow but may no longer be buyable under the
guidelines.
***Last / Change / Volume data in this table is the closing quote data***
Symbol/Exchange
Company Name
Industry Group |
PRICE |
CHANGE
(%Change) |
Day High |
Volume
(% DAV)
(% 50 day avg vol) |
52 Wk Hi
% From Hi |
Featured
Date |
Price
Featured |
Pivot Featured |
|
Max Buy |
CELG
-
NASDAQ
Celgene Corp
DRUGS - Drug Manufacturers - Major
|
$80.02
|
+0.32
0.40% |
$80.33
|
2,267,282
80.48% of 50 DAV
50 DAV is 2,817,300
|
$82.78
-3.33%
|
12/11/2012
|
$82.24
|
PP = $81.34
|
|
MB = $85.41
|
Most Recent Note - 12/17/2012 5:42:05 PM
Y - Halted its slide with a gain today. Slumped below its pivot point following a technical buy signal on 12/11/12, however its small losses lacked great volume conviction. Disciplined investors always limit losses if any stock falls -7% from their purchase price.
>>> The latest Featured Stock Update with an annotated graph appeared on 12/12/2012. Click here.
View all notes |
Alert me of new notes |
CANSLIM.net Company Profile |
SEC |
Zacks Reports |
StockTalk |
News |
Chart |
Request a new note
C
A N
S L
I M


|
CFNL
-
NASDAQ
Cardinal Financial Corp
BANKING - Regional - Southeast Banks
|
$16.50
|
+0.34
2.10% |
$16.66
|
180,034
87.86% of 50 DAV
50 DAV is 204,900
|
$16.32
1.10%
|
12/3/2012
|
$15.20
|
PP = $16.31
|
|
MB = $17.13
|
 Most Recent Note - 12/20/2012 11:14:30 AM
Y - Today's 4th consecutive gain has it hitting a new 52-week high and rallying above its pivot point. A strong gain backed by at least +40% above average volume may trigger a proper new (or add-on) technical buy signal.
>>> The latest Featured Stock Update with an annotated graph appeared on 12/10/2012. Click here.
View all notes |
Alert me of new notes |
CANSLIM.net Company Profile |
SEC |
Zacks Reports |
StockTalk |
News |
Chart |
Request a new note
C
A N
S L
I M
|
CMCSA
-
NASDAQ
Comcast Corp Cl A
MEDIA - CATV Systems
|
$38.09
|
+0.08
0.21% |
$38.22
|
11,417,182
95.16% of 50 DAV
50 DAV is 11,998,500
|
$38.19
-0.26%
|
12/3/2012
|
$37.08
|
PP = $38.06
|
|
MB = $39.96
|
Most Recent Note - 12/17/2012 5:36:01 PM
Y - Rallied up from its 50 DMA line with a volume-driven gain today, finishing only -1.1% off its 52-week high. Disciplined investors will watch for gains above the pivot point backed by at least the bare minimum +40% above average volume threshold to trigger a proper new (or add-on) technical buy signal before taking action.
>>> The latest Featured Stock Update with an annotated graph appeared on 12/7/2012. Click here.
View all notes |
Alert me of new notes |
CANSLIM.net Company Profile |
SEC |
Zacks Reports |
StockTalk |
News |
Chart |
Request a new note
C
A N
S L
I M
|
MIDD
-
NASDAQ
Middleby Corp
MANUFACTURING - Diversified Machinery
|
$128.43
|
-3.62
-2.74% |
$132.72
|
143,870
172.51% of 50 DAV
50 DAV is 83,400
|
$134.51
-4.52%
|
10/8/2012
|
$118.46
|
PP = $122.67
|
|
MB = $128.80
|
Most Recent Note - 12/19/2012 12:16:58 PM
G - Hitting new 52-week and all-time highs again with today's 4th consecutive gain, getting more extended beyond its "max buy" level. Earnings +23% on +18% sales for the Sep '12 quarter, below the +25% minimum earnings guideline (C criteria), raised concerns.
>>> The latest Featured Stock Update with an annotated graph appeared on 12/6/2012. Click here.
View all notes |
Alert me of new notes |
CANSLIM.net Company Profile |
SEC |
Zacks Reports |
StockTalk |
News |
Chart |
Request a new note
C
A N
S L
I M
|
N
-
NYSE
Netsuite Inc
DIVERSIFIED SERVICES - Business/Management Services
|
$67.20
|
-0.08
-0.12% |
$67.50
|
340,461
72.52% of 50 DAV
50 DAV is 469,500
|
$67.82
-0.91%
|
12/12/2012
|
$64.75
|
PP = $67.12
|
|
MB = $70.48
|
Most Recent Note - 12/19/2012 3:31:42 PM
Y - Wedging up and hitting a new 52-week high with today's 4th consecutive gain while inching above its pivot point without great volume conviction. Disciplined investors know that volume must be at least +40% above average behind gains above the pivot point to trigger a proper technical buy signal.
>>> The latest Featured Stock Update with an annotated graph appeared on 12/13/2012. Click here.
View all notes |
Alert me of new notes |
CANSLIM.net Company Profile |
SEC |
Zacks Reports |
StockTalk |
News |
Chart |
Request a new note
C
A N
S L
I M
|
Symbol/Exchange
Company Name
Industry Group |
PRICE |
CHANGE
(%Change) |
Day High |
Volume
(% DAV)
(% 50 day avg vol) |
52 Wk Hi
% From Hi |
Featured
Date |
Price
Featured |
Pivot Featured |
|
Max Buy |
NSR
-
NYSE
Neustar Inc
TELECOMMUNICATIONS - Diversified Communication Serv
|
$42.74
|
-0.36
-0.84% |
$43.00
|
496,351
140.09% of 50 DAV
50 DAV is 354,300
|
$43.85
-2.53%
|
12/11/2012
|
$41.85
|
PP = $41.41
|
|
MB = $43.48
|
Most Recent Note - 12/17/2012 12:25:48 PM
Y - Trading up today with higher volume, yet it remains below its "max buy" level. Clinched a technical buy signal on 12/11/12 as it rallied from a 10-week base. Quarterly comparisons through Sep '12 showed 3 consecutive increases of more than the +25% minimum earnings guideline (C criteria). Prior highs near $41 define initial support to watch on pullbacks.
>>> The latest Featured Stock Update with an annotated graph appeared on 12/11/2012. Click here.
View all notes |
Alert me of new notes |
CANSLIM.net Company Profile |
SEC |
Zacks Reports |
StockTalk |
News |
Chart |
Request a new note
C
A N
S L
I M
|
RAX
-
NYSE
Rackspace Hosting Inc
INTERNET - Internet Software and; Services
|
$73.58
|
+1.65
2.29% |
$73.86
|
1,070,997
70.37% of 50 DAV
50 DAV is 1,522,000
|
$73.37
0.29%
|
12/18/2012
|
$71.88
|
PP = $70.10
|
|
MB = $73.61
|
Most Recent Note - 12/18/2012 5:49:46 PM
Y - Rallied and closed above a new pivot point cited based on its 11/29/12 high plus 10 cents clinching a new (or add-on) technical buy signal. See the latest FSU analysis for more details and a new annotated graph.
>>> The latest Featured Stock Update with an annotated graph appeared on 12/18/2012. Click here.
View all notes |
Alert me of new notes |
CANSLIM.net Company Profile |
SEC |
Zacks Reports |
StockTalk |
News |
Chart |
Request a new note
C
A N
S L
I M
|
RNF
-
NYSE
Rentech Nitrogen Ptnr Lp
CHEMICALS - Agricultural Chemicals
|
$38.12
|
-0.33
-0.86% |
$39.00
|
191,780
63.76% of 50 DAV
50 DAV is 300,800
|
$41.15
-7.36%
|
11/1/2012
|
$39.11
|
PP = $40.15
|
|
MB = $42.16
|
Most Recent Note - 12/19/2012 5:37:21 PM
Y - Disciplined investors may still be watching for volume-driven gains for a new high close to trigger a technical buy signal. See the latest FSU analysis for more details and a new annotated graph.
>>> The latest Featured Stock Update with an annotated graph appeared on 12/19/2012. Click here.
View all notes |
Alert me of new notes |
CANSLIM.net Company Profile |
SEC |
Zacks Reports |
StockTalk |
News |
Chart |
Request a new note
C
A N
S L
I M
|
ULTA
-
NASDAQ
Ulta Salon Cosm & Frag
SPECIALTY RETAIL - Specialty Retail, Other
|
$96.41
|
+0.07
0.07% |
$97.13
|
430,736
53.83% of 50 DAV
50 DAV is 800,200
|
$103.52
-6.87%
|
12/4/2012
|
$100.29
|
PP = $103.62
|
|
MB = $108.80
|
Most Recent Note - 12/19/2012 3:27:04 PM
Y - Consolidating above its 50 DMA line which recently acted as support. Subsequent deterioration below its 50 DMA or 200 DMA line would raise more serious concerns and trigger technical sell signals. Meanwhile, disciplined investors will watch for volume-driven gains above the pivot point to trigger a new technical buy signal before taking action.
>>> The latest Featured Stock Update with an annotated graph appeared on 12/4/2012. Click here.
View all notes |
Alert me of new notes |
CANSLIM.net Company Profile |
SEC |
Zacks Reports |
StockTalk |
News |
Chart |
Request a new note
C
A N
S L
I M
|
VRX
-
NYSE
Valeant Pharmaceuticals
DRUGS - Drug Manufacturers - Other
|
$61.03
|
+1.28
2.14% |
$61.10
|
2,521,342
191.77% of 50 DAV
50 DAV is 1,314,800
|
$61.11
-0.13%
|
12/20/2012
|
$60.24
|
PP = $61.21
|
|
MB = $64.27
|
Most Recent Note - 12/20/2012 5:21:06 PM
Y - Rallied with +92% above average volume but failed to rise above its pivot point cited based on its 9/07/12 high plus 10 cents after highlighted in yellow in the earlier mid-day report. Encountered stubborn resistance in prior months near the $60-61 area. Disciplined investors may watch for a volume-driven gain above its pivot point to trigger a technical buy signal before taking action. Quarterly earnings increases (C criteria) have been strong and well above the +25% guideline. A downturn in FY '07 and '08 earnings (A criteria) has been followed by a strong earnings rebound in recent years. See the latest FSU analysis for more details and a new annotated graph.
>>> The latest Featured Stock Update with an annotated graph appeared on 12/20/2012. Click here.
View all notes |
Alert me of new notes |
CANSLIM.net Company Profile |
SEC |
Zacks Reports |
StockTalk |
News |
Chart |
Request a new note
C
A N
S L
I M
|
Symbol/Exchange
Company Name
Industry Group |
PRICE |
CHANGE
(%Change) |
Day High |
Volume
(% DAV)
(% 50 day avg vol) |
52 Wk Hi
% From Hi |
Featured
Date |
Price
Featured |
Pivot Featured |
|
Max Buy |
VSI
-
NYSE
Vitamin Shoppe Inc
SPECIALTY RETAIL - Specialty Retail, Other
|
$58.23
|
-1.08
-1.82% |
$59.33
|
249,313
103.36% of 50 DAV
50 DAV is 241,200
|
$61.89
-5.91%
|
12/3/2012
|
$59.06
|
PP = $61.99
|
|
MB = $65.09
|
Most Recent Note - 12/18/2012 4:01:11 PM
Y - Solid gain on above average volume and strong close near the session high today helped it rally back above its 50 DMA line and its color code is changed to yellow. The $61 area has been a stubborn resistance level in recent months.
>>> The latest Featured Stock Update with an annotated graph appeared on 12/3/2012. Click here.
View all notes |
Alert me of new notes |
CANSLIM.net Company Profile |
SEC |
Zacks Reports |
StockTalk |
News |
Chart |
Request a new note
C
A N
S L
I M
|
WPI
-
NYSE
Watson Pharmaceuticals
DRUGS - Drugs - Generic
|
$90.20
|
+1.30
1.46% |
$90.28
|
602,179
79.83% of 50 DAV
50 DAV is 754,300
|
$90.80
-0.66%
|
12/17/2012
|
$87.99
|
PP = $90.49
|
|
MB = $95.01
|
Most Recent Note - 12/18/2012 4:20:47 PM
Y - Up today with average volume for a best-ever close. Perched within close striking distance of its 52-week high today and no resistance remains due to overhead supply. Color code was changed to yellow with new pivot point cited based on its 12/12/12 high plus 10 cents.
>>> The latest Featured Stock Update with an annotated graph appeared on 12/17/2012. Click here.
View all notes |
Alert me of new notes |
CANSLIM.net Company Profile |
SEC |
Zacks Reports |
StockTalk |
News |
Chart |
Request a new note
C
A N
S L
I M
|
|
|
|
THESE ARE NOT BUY RECOMMENDATIONS!
Comments contained in the body of this report are technical
opinions only. The material herein has been obtained
from sources believed to be reliable and accurate, however,
its accuracy and completeness cannot be guaranteed.
This site is not an investment advisor, hence it does
not endorse or recommend any securities or other investments.
Any recommendation contained in this report may not
be suitable for all investors and it is not to be deemed
an offer or solicitation on our part with respect to
the purchase or sale of any securities. All trademarks,
service marks and trade names appearing in this report
are the property of their respective owners, and are
likewise used for identification purposes only.
This report is a service available
only to active Paid Premium Members.
You may opt-out of receiving report notifications
at any time. Questions or comments may be submitted
by writing to Premium Membership Services 665 S.E. 10 Street, Suite 201 Deerfield Beach, FL 33441-5634 or by calling 1-800-965-8307
or 954-785-1121.
|
|
|

