You are not logged in.
This means you
CAN ONLY VIEW reports that were published prior to Tuesday, April 15, 2025.
You
MUST UPGRADE YOUR MEMBERSHIP if you want to see any current reports.
AFTER MARKET UPDATE - FRIDAY, DECEMBER 21ST, 2012
Previous After Market Report Next After Market Report >>>
|
|
|
|
DOW |
-120.88 |
13,190.84 |
-0.91% |
|
Volume |
1,883,670,490 |
+176% |
|
Volume |
2,452,732,670 |
+49% |
|
NASDAQ |
-29.38 |
3,021.01 |
-0.96% |
|
Advancers |
982 |
31% |
|
Advancers |
816 |
31% |
|
S&P 500 |
-13.54 |
1,430.15 |
-0.94% |
|
Decliners |
2,071 |
65% |
|
Decliners |
1,671 |
64% |
|
Russell 2000 |
-4.57 |
847.92 |
-0.54% |
|
52 Wk Highs |
80 |
|
|
52 Wk Highs |
38 |
|
|
S&P 600 |
-1.97 |
475.73 |
-0.41% |
|
52 Wk Lows |
16 |
|
|
52 Wk Lows |
29 |
|
|
 |
Major Averages Posted Weekly Gains Despite Friday's Retreat
Kenneth J. Gruneisen - Passed the CAN SLIM® Master's Exam
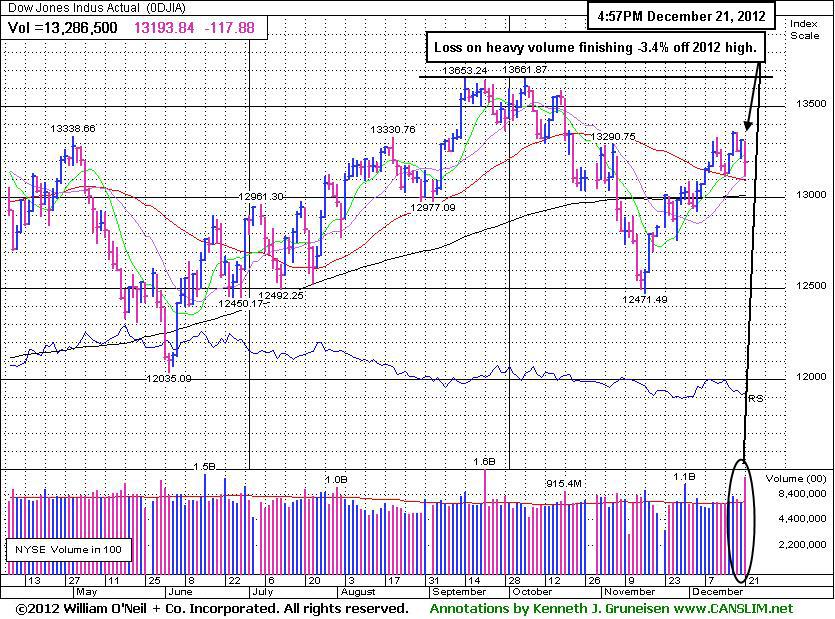
On the week, the Dow Jones Industrial Average was up +0.4%, the S&P 500 Index rose +1.2%, and the Nasdaq Composite Index rallied +1.7%. The major averages had a constructive week even though they lost ground on Friday while the volume totals were reported much heavier than the prior session totals on both the NYSE and the Nasdaq exchange, inflated by options expirations. Breadth was negative as decliners led advancers by a 2-1 margin on the NYSE and on the Nasdaq exchange. The total number of stocks hitting new 52-week highs contracted but still outnumbered new 52-week lows on the NYSE and on the Nasdaq exchange. There were 29 high-ranked companies from the CANSLIM.net Leaders List making new 52-week highs and appearing on the CANSLIM.net BreakOuts Page, down considerably from the prior session total of 67 stocks. Any sustainable rally requires a healthy crop of companies hitting new 52-week highs, so it had been an encouraging sign to see a meaningful expansion in leadership earlier this week. There were gains for only 3 of the 12 high-ranked companies currently included on the Featured Stocks Page.
The major averages are trading near the lows of the session amid heightened concerns over fiscal cliff negotiations after Republicans canceled the vote on House Speaker Boehner's budget plan. Concerns over the fiscal cliff overshadowed generally positive economic data as Durable Goods orders increased +0.7% in November. Separate reports showed personal income rose +0.6% and spending grew +0.4%. However, the University of Michigan Consumer Sentiment survey fell in December to 72.9 from 82.7 in the prior month.
All 10 sectors are lower in the session led by declines in consumer discretionary and energy. Shares of drug store chain Walgreen Co (WAG -3.30%) was down after reporting disappointing quarterly results. Exxon Mobile Corp (XOM -1.87%) fell as the price of oil retreated. Nike Inc (NKE +6.16%) was a notable gainer as shares of the athletic apparel maker rallied after earnings beat analyst estimates.
The 10-year note gained 5/16 to yield 1.76%.
Technically, the market direction (M criteria) remains in a confirmed uptrend. The Nasdaq Composite Index, benchmark S&P 500 Index, and the Dow Jones Industrial Average are again collectively rallying above their respective 50-day moving average (DMA) lines. New buying efforts may be justified only in worthy high-ranked leaders. See the noteworthy companies included on the Featured Stocks Page.
Watch for an announcement via email concerning the next WEBCAST. The webcast will also be available via an updated link highlighted at the top of the Premium Member Homepage.
PICTURED: The Dow Jones Industrial Average finished -3.4% off its 2012 high with a loss on heavy volume.
|
 Kenneth J. Gruneisen started out as a licensed stockbroker in August 1987, a couple of months prior to the historic stock market crash that took the Dow Jones Industrial Average down -22.6% in a single day. He has published daily fact-based fundamental and technical analysis on high-ranked stocks online for two decades. Through FACTBASEDINVESTING.COM, Kenneth provides educational articles, news, market commentary, and other information regarding proven investment systems that work in good times and bad.
Comments contained in the body of this report are technical opinions only and are not necessarily those of Gruneisen Growth Corp. The material herein has been obtained from sources believed to be reliable and accurate, however, its accuracy and completeness cannot be guaranteed. Our firm, employees, and customers may effect transactions, including transactions contrary to any recommendation herein, or have positions in the securities mentioned herein or options with respect thereto. Any recommendation contained in this report may not be suitable for all investors and it is not to be deemed an offer or solicitation on our part with respect to the purchase or sale of any securities. |
|
 |
Tech, Financial, and Retail Groups Led Decliners
Kenneth J. Gruneisen - Passed the CAN SLIM® Master's Exam
The tech sector saw unanimous losses from the Internet Index ($IIX -2.07%), Biotechnology Index ($BTK -1.26%), Semiconductor Index ($SOX -1.00%), and the Networking Index ($NWX -0.95%). Losses from the Retail Index ($RLX -1.22%) and weakness in the Bank Index ($BKX -1.19%) and Broker/Dealer Index ($XBD -0.57%) also weighed on the major averages. Weakness in energy-related shares led the Oil Services Index ($OSX -1.44%) and the Integrated Oil Index ($XOI -0.87%) lower. The Healthcare Index ($HMO -0.80%) also backpedaled while the Gold & Silver Index ($XAU +0.14%) held its ground.
Charts courtesy www.stockcharts.com
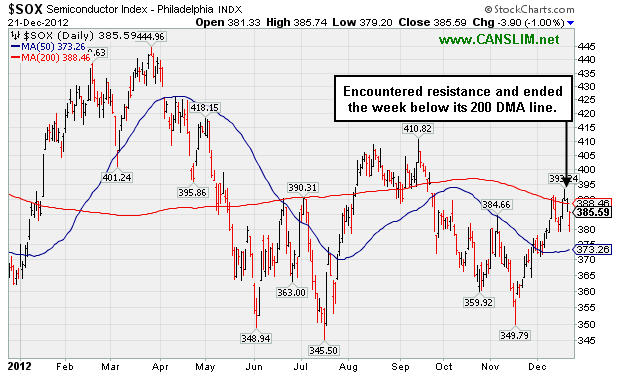
PICTURED: The Semiconductor Index ($SOX -1.00%) encountered resistance and ended the week below its 200-day moving average (DMA) line.
| Oil Services |
$OSX |
221.04 |
-3.22 |
-1.44% |
+2.20% |
| Healthcare |
$HMO |
2,526.08 |
-20.40 |
-0.80% |
+10.72% |
| Integrated Oil |
$XOI |
1,252.84 |
-10.98 |
-0.87% |
+1.93% |
| Semiconductor |
$SOX |
385.59 |
-3.90 |
-1.00% |
+5.80% |
| Networking |
$NWX |
228.93 |
-2.21 |
-0.95% |
+6.40% |
| Internet |
$IIX |
328.53 |
-6.93 |
-2.07% |
+16.61% |
| Broker/Dealer |
$XBD |
93.12 |
-0.53 |
-0.57% |
+11.82% |
| Retail |
$RLX |
653.10 |
-8.06 |
-1.22% |
+24.83% |
| Gold & Silver |
$XAU |
160.30 |
+0.22 |
+0.14% |
-11.26% |
| Bank |
$BKX |
51.28 |
-0.62 |
-1.19% |
+30.22% |
| Biotech |
$BTK |
1,552.42 |
-19.75 |
-1.26% |
+42.24% |
|
|
|
 |
Relative Strength Rating Sub Par For Buy Candidates After Retreat
Kenneth J. Gruneisen - Passed the CAN SLIM® Master's Exam
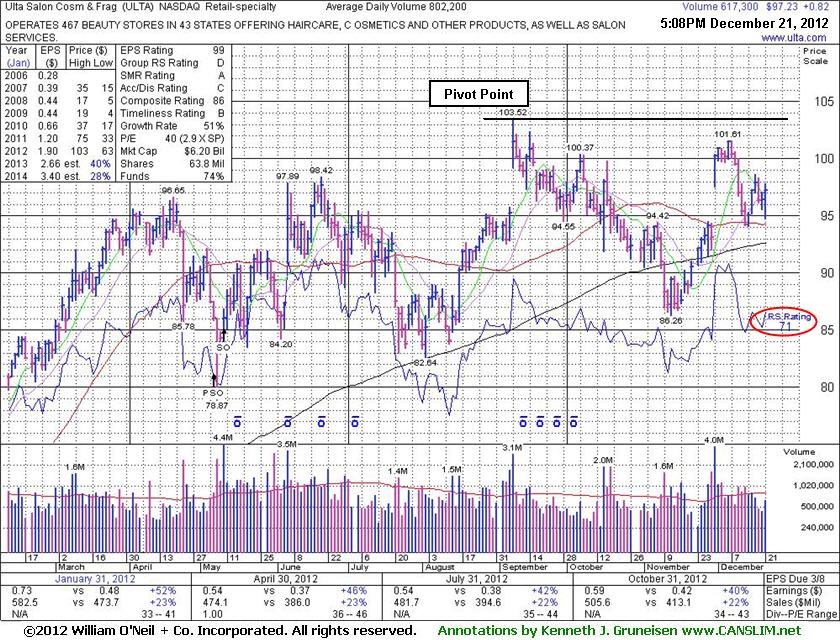
Ulta Salon Cosmetics & Fragrance, Inc. (ULTA +$0.82 or +0.85% to $97.23) is consolidating above its 50-day moving average (DMA) line which recently acted as support. Subsequent deterioration below its 50 DMA or 200 DMA line would raise more serious concerns and trigger technical sell signals. Its Relative Strength rating has slumped below the 80+ minimum guideline for buy candidates to a 71 (see red circle), down from an 83 rating when last shown in this FSU section on 12/04/12 with an annotated graph under the headline, "Recent Resilience and Strength Creates New Set-Up". Subsequent volume-driven gains failed to materialize to lift it above the new pivot point cited based on its 9/07/12 high plus 10 cents after highlighted in yellow in the 12/04/12 mid-day report (read here). Prior reports cautioned members - "Disciplined investors will watch for volume-driven gains above the pivot point to trigger a new technical buy signal, as it could spend a lot more time basing. Meanwhile, other stocks that have broken out but are not too extended from sound bases could be better choices to consider." Resistance still remains due to overhead supply up through the $101-103 range.
ULTA reported earnings +40% on +22% sales for the Oct '12 quarter. Its strong quarterly earnings increases above the +25% guideline in the 10 latest comparisons satisfies the C criteria, and its solid annual earnings (A criteria) history is also very reassuring. The number of top-rated funds with an ownership interest has grown from 515 funds in Dec '11 to 618 funds as of Sep '12, which is a very encouraging sign of increasing institutional interest (the I criteria). Based on weak action it was dropped from the Featured Stocks list on 11/08/12, yet it had rebounded impressively after the recent consolidation undercut its 200 DMA line. It gapped up above its 50-day moving average (DMA) line on 11/30/12, and the rebound above its 50 DMA line helped its technical stance improve.
|
|
|
Color Codes Explained :
Y - Better candidates highlighted by our
staff of experts.
G - Previously featured
in past reports as yellow but may no longer be buyable under the
guidelines.
***Last / Change / Volume data in this table is the closing quote data***
Symbol/Exchange
Company Name
Industry Group |
PRICE |
CHANGE
(%Change) |
Day High |
Volume
(% DAV)
(% 50 day avg vol) |
52 Wk Hi
% From Hi |
Featured
Date |
Price
Featured |
Pivot Featured |
|
Max Buy |
CELG
-
NASDAQ
Celgene Corp
DRUGS - Drug Manufacturers - Major
|
$79.70
|
-0.32
-0.40% |
$79.76
|
5,928,405
209.55% of 50 DAV
50 DAV is 2,829,100
|
$82.78
-3.72%
|
12/11/2012
|
$82.24
|
PP = $81.34
|
|
MB = $85.41
|
 Most Recent Note - 12/21/2012 12:06:59 PM
Y - Down with above average volume today after a small gap down, enduring distributional pressure amid weakness in the broader market. Slumped below its pivot point following a technical buy signal on 12/11/12, however its small losses lacked great volume conviction. Disciplined investors always limit losses if any stock falls -7% from their purchase price.
>>> The latest Featured Stock Update with an annotated graph appeared on 12/12/2012. Click here.
View all notes |
Alert me of new notes |
CANSLIM.net Company Profile |
SEC |
Zacks Reports |
StockTalk |
News |
Chart |
Request a new note
C
A N
S L
I M


|
CFNL
-
NASDAQ
Cardinal Financial Corp
BANKING - Regional - Southeast Banks
|
$16.30
|
-0.20
-1.21% |
$16.47
|
277,180
133.52% of 50 DAV
50 DAV is 207,600
|
$16.66
-2.16%
|
12/3/2012
|
$15.20
|
PP = $16.31
|
|
MB = $17.13
|
Most Recent Note - 12/20/2012 11:14:30 AM
Y - Today's 4th consecutive gain has it hitting a new 52-week high and rallying above its pivot point. A strong gain backed by at least +40% above average volume may trigger a proper new (or add-on) technical buy signal.
>>> The latest Featured Stock Update with an annotated graph appeared on 12/10/2012. Click here.
View all notes |
Alert me of new notes |
CANSLIM.net Company Profile |
SEC |
Zacks Reports |
StockTalk |
News |
Chart |
Request a new note
C
A N
S L
I M
|
CMCSA
-
NASDAQ
Comcast Corp Cl A
MEDIA - CATV Systems
|
$37.23
|
-0.86
-2.26% |
$37.66
|
25,628,505
213.13% of 50 DAV
50 DAV is 12,024,800
|
$38.22
-2.59%
|
12/3/2012
|
$37.08
|
PP = $38.06
|
|
MB = $39.96
|
Most Recent Note - 12/21/2012 12:09:44 PM
Y - Small gap down for a loss with above average volume amid widespread weakness today. It did not trigger a buy signal since previously noted with caution - "Disciplined investors will watch for gains above the pivot point backed by at least the bare minimum +40% above average volume threshold to trigger a proper new (or add-on) technical buy signal before taking action."
>>> The latest Featured Stock Update with an annotated graph appeared on 12/7/2012. Click here.
View all notes |
Alert me of new notes |
CANSLIM.net Company Profile |
SEC |
Zacks Reports |
StockTalk |
News |
Chart |
Request a new note
C
A N
S L
I M
|
MIDD
-
NASDAQ
Middleby Corp
MANUFACTURING - Diversified Machinery
|
$127.70
|
-0.73
-0.57% |
$128.74
|
165,803
193.24% of 50 DAV
50 DAV is 85,800
|
$134.51
-5.06%
|
10/8/2012
|
$118.46
|
PP = $122.67
|
|
MB = $128.80
|
Most Recent Note - 12/21/2012 5:35:21 PM
G - Down today for a 3rd consecutive loss with above average volume, enduring distributional pressure after a negative reversal on 12/19/12 at its new 52-week and all-time high. Earnings +23% on +18% sales for the Sep '12 quarter, below the +25% minimum earnings guideline (C criteria), raised concerns.
>>> The latest Featured Stock Update with an annotated graph appeared on 12/6/2012. Click here.
View all notes |
Alert me of new notes |
CANSLIM.net Company Profile |
SEC |
Zacks Reports |
StockTalk |
News |
Chart |
Request a new note
C
A N
S L
I M
|
N
-
NYSE
Netsuite Inc
DIVERSIFIED SERVICES - Business/Management Services
|
$67.05
|
-0.15
-0.22% |
$67.30
|
285,305
60.70% of 50 DAV
50 DAV is 470,000
|
$67.82
-1.14%
|
12/12/2012
|
$64.75
|
PP = $67.12
|
|
MB = $70.48
|
Most Recent Note - 12/19/2012 3:31:42 PM
Y - Wedging up and hitting a new 52-week high with today's 4th consecutive gain while inching above its pivot point without great volume conviction. Disciplined investors know that volume must be at least +40% above average behind gains above the pivot point to trigger a proper technical buy signal.
>>> The latest Featured Stock Update with an annotated graph appeared on 12/13/2012. Click here.
View all notes |
Alert me of new notes |
CANSLIM.net Company Profile |
SEC |
Zacks Reports |
StockTalk |
News |
Chart |
Request a new note
C
A N
S L
I M
|
Symbol/Exchange
Company Name
Industry Group |
PRICE |
CHANGE
(%Change) |
Day High |
Volume
(% DAV)
(% 50 day avg vol) |
52 Wk Hi
% From Hi |
Featured
Date |
Price
Featured |
Pivot Featured |
|
Max Buy |
NSR
-
NYSE
Neustar Inc
TELECOMMUNICATIONS - Diversified Communication Serv
|
$42.32
|
-0.42
-0.98% |
$42.85
|
746,179
207.79% of 50 DAV
50 DAV is 359,100
|
$43.85
-3.49%
|
12/11/2012
|
$41.85
|
PP = $41.41
|
|
MB = $43.48
|
Most Recent Note - 12/21/2012 3:56:27 PM
Y - Retreating from its 52-week high with above average volume behind today's 3rd consecutive small loss, yet it remains above its pivot point. Prior highs near $41 define initial support to watch on pullbacks.
>>> The latest Featured Stock Update with an annotated graph appeared on 12/11/2012. Click here.
View all notes |
Alert me of new notes |
CANSLIM.net Company Profile |
SEC |
Zacks Reports |
StockTalk |
News |
Chart |
Request a new note
C
A N
S L
I M
|
RAX
-
NYSE
Rackspace Hosting Inc
INTERNET - Internet Software and; Services
|
$72.86
|
-0.72
-0.98% |
$73.26
|
1,437,957
94.82% of 50 DAV
50 DAV is 1,516,500
|
$73.86
-1.35%
|
12/18/2012
|
$71.88
|
PP = $70.10
|
|
MB = $73.61
|
Most Recent Note - 12/18/2012 5:49:46 PM
Y - Rallied and closed above a new pivot point cited based on its 11/29/12 high plus 10 cents clinching a new (or add-on) technical buy signal. See the latest FSU analysis for more details and a new annotated graph.
>>> The latest Featured Stock Update with an annotated graph appeared on 12/18/2012. Click here.
View all notes |
Alert me of new notes |
CANSLIM.net Company Profile |
SEC |
Zacks Reports |
StockTalk |
News |
Chart |
Request a new note
C
A N
S L
I M
|
RNF
-
NYSE
Rentech Nitrogen Ptnr Lp
CHEMICALS - Agricultural Chemicals
|
$38.18
|
+0.06
0.16% |
$38.37
|
111,196
36.88% of 50 DAV
50 DAV is 301,500
|
$41.15
-7.22%
|
11/1/2012
|
$39.11
|
PP = $40.15
|
|
MB = $42.16
|
Most Recent Note - 12/19/2012 5:37:21 PM
Y - Disciplined investors may still be watching for volume-driven gains for a new high close to trigger a technical buy signal. See the latest FSU analysis for more details and a new annotated graph.
>>> The latest Featured Stock Update with an annotated graph appeared on 12/19/2012. Click here.
View all notes |
Alert me of new notes |
CANSLIM.net Company Profile |
SEC |
Zacks Reports |
StockTalk |
News |
Chart |
Request a new note
C
A N
S L
I M
|
ULTA
-
NASDAQ
Ulta Salon Cosm & Frag
SPECIALTY RETAIL - Specialty Retail, Other
|
$97.23
|
+0.82
0.85% |
$97.81
|
618,893
77.15% of 50 DAV
50 DAV is 802,200
|
$103.52
-6.08%
|
12/4/2012
|
$100.29
|
PP = $103.62
|
|
MB = $108.80
|
Most Recent Note - 12/21/2012 5:32:43 PM
Y - Consolidating above its 50 DMA line which recently acted as support. Waning Relative Strength rating, below the 80+ minimum guideline for buy candidates, is a concern. See the latest FSU analysis for more details and a new annotated graph.
>>> The latest Featured Stock Update with an annotated graph appeared on 12/21/2012. Click here.
View all notes |
Alert me of new notes |
CANSLIM.net Company Profile |
SEC |
Zacks Reports |
StockTalk |
News |
Chart |
Request a new note
C
A N
S L
I M
|
VRX
-
NYSE
Valeant Pharmaceuticals
DRUGS - Drug Manufacturers - Other
|
$60.84
|
-0.19
-0.31% |
$61.00
|
2,137,558
157.58% of 50 DAV
50 DAV is 1,356,500
|
$61.11
-0.44%
|
12/20/2012
|
$60.24
|
PP = $61.21
|
|
MB = $64.27
|
Most Recent Note - 12/20/2012 5:21:06 PM
Y - Rallied with +92% above average volume but failed to rise above its pivot point cited based on its 9/07/12 high plus 10 cents after highlighted in yellow in the earlier mid-day report. Encountered stubborn resistance in prior months near the $60-61 area. Disciplined investors may watch for a volume-driven gain above its pivot point to trigger a technical buy signal before taking action. Quarterly earnings increases (C criteria) have been strong and well above the +25% guideline. A downturn in FY '07 and '08 earnings (A criteria) has been followed by a strong earnings rebound in recent years. See the latest FSU analysis for more details and a new annotated graph.
>>> The latest Featured Stock Update with an annotated graph appeared on 12/20/2012. Click here.
View all notes |
Alert me of new notes |
CANSLIM.net Company Profile |
SEC |
Zacks Reports |
StockTalk |
News |
Chart |
Request a new note
C
A N
S L
I M
|
Symbol/Exchange
Company Name
Industry Group |
PRICE |
CHANGE
(%Change) |
Day High |
Volume
(% DAV)
(% 50 day avg vol) |
52 Wk Hi
% From Hi |
Featured
Date |
Price
Featured |
Pivot Featured |
|
Max Buy |
VSI
-
NYSE
Vitamin Shoppe Inc
SPECIALTY RETAIL - Specialty Retail, Other
|
$57.51
|
-0.72
-1.24% |
$58.48
|
352,286
146.42% of 50 DAV
50 DAV is 240,600
|
$61.89
-7.08%
|
12/3/2012
|
$59.06
|
PP = $61.99
|
|
MB = $65.09
|
Most Recent Note - 12/21/2012 3:58:36 PM
G - Slumping below its 50 DMA line again today with a small loss on slightly higher volume and its color code is changed to green. The $61 area has been a stubborn resistance level in recent months.
>>> The latest Featured Stock Update with an annotated graph appeared on 12/3/2012. Click here.
View all notes |
Alert me of new notes |
CANSLIM.net Company Profile |
SEC |
Zacks Reports |
StockTalk |
News |
Chart |
Request a new note
C
A N
S L
I M
|
WPI
-
NYSE
Watson Pharmaceuticals
DRUGS - Drugs - Generic
|
$90.85
|
+0.65
0.72% |
$91.16
|
1,684,685
222.52% of 50 DAV
50 DAV is 757,100
|
$90.80
0.06%
|
12/17/2012
|
$87.99
|
PP = $90.49
|
|
MB = $95.01
|
Most Recent Note - 12/21/2012 5:37:26 PM
Y - Gain today with +122% above average volume for a new 52-week high clinched a technical buy signal. No resistance remains due to overhead supply.
>>> The latest Featured Stock Update with an annotated graph appeared on 12/17/2012. Click here.
View all notes |
Alert me of new notes |
CANSLIM.net Company Profile |
SEC |
Zacks Reports |
StockTalk |
News |
Chart |
Request a new note
C
A N
S L
I M
|
|
|
|
THESE ARE NOT BUY RECOMMENDATIONS!
Comments contained in the body of this report are technical
opinions only. The material herein has been obtained
from sources believed to be reliable and accurate, however,
its accuracy and completeness cannot be guaranteed.
This site is not an investment advisor, hence it does
not endorse or recommend any securities or other investments.
Any recommendation contained in this report may not
be suitable for all investors and it is not to be deemed
an offer or solicitation on our part with respect to
the purchase or sale of any securities. All trademarks,
service marks and trade names appearing in this report
are the property of their respective owners, and are
likewise used for identification purposes only.
This report is a service available
only to active Paid Premium Members.
You may opt-out of receiving report notifications
at any time. Questions or comments may be submitted
by writing to Premium Membership Services 665 S.E. 10 Street, Suite 201 Deerfield Beach, FL 33441-5634 or by calling 1-800-965-8307
or 954-785-1121.
|
|
|

