You are not logged in.
This means you
CAN ONLY VIEW reports that were published prior to Tuesday, April 15, 2025.
You
MUST UPGRADE YOUR MEMBERSHIP if you want to see any current reports.
AFTER MARKET UPDATE - WEDNESDAY, DECEMBER 19TH, 2012
Previous After Market Report Next After Market Report >>>
|
|
|
|
DOW |
-98.99 |
13,251.97 |
-0.74% |
|
Volume |
750,865,060 |
-8% |
|
Volume |
1,871,079,620 |
-4% |
|
NASDAQ |
-10.17 |
3,044.36 |
-0.33% |
|
Advancers |
1,507 |
48% |
|
Advancers |
1,239 |
48% |
|
S&P 500 |
-10.98 |
1,435.81 |
-0.76% |
|
Decliners |
1,536 |
48% |
|
Decliners |
1,214 |
47% |
|
Russell 2000 |
+0.20 |
847.89 |
+0.02% |
|
52 Wk Highs |
170 |
|
|
52 Wk Highs |
108 |
|
|
S&P 600 |
-0.25 |
475.03 |
-0.05% |
|
52 Wk Lows |
14 |
|
|
52 Wk Lows |
25 |
|
|
 |
Major Averages Pull Back With Lighter Volume Totals
Kenneth J. Gruneisen - Passed the CAN SLIM® Master's Exam
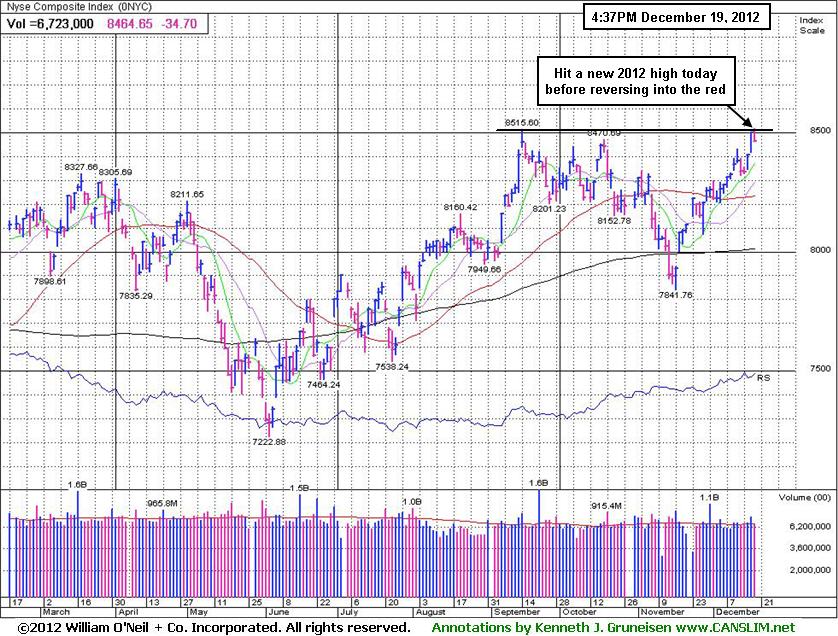
The major averages ended with losses on Wednesday while the volume totals were reported lighter than the prior session totals on both the NYSE and the Nasdaq exchange. Advancers and decliners were evenly mixed on the NYSE and on the Nasdaq exchange. The total number of stocks hitting new 52-week highs solidly outnumbered new 52-week lows on the NYSE and on the Nasdaq exchange. There were 67 high-ranked companies from the CANSLIM.net Leaders List making new 52-week highs and appearing on the CANSLIM.net BreakOuts Page, down from the prior session total of 75 stocks. Any sustainable rally requires a healthy crop of companies hitting new 52-week highs, so it has been an encouraging sign to see a meaningful expansion in leadership this week. There were gains for only 3 of the 12 high-ranked companies currently included on the Featured Stocks Page, showing a clearly negative bias versus the broader market.
Investors continue to watch the budget negotiations in Washington with optimism a deal can be reached to avoid the scheduled tax increases and spending cuts at the end of the year. There was mixed housing data before the open, as reports showed housing starts declined -3.6% while building permits increased +3.0% in November.
All 10 sectors in the S&P 500 ended the session in negative territory. On the earnings front, Oracle Corp (ORCL +3.68%) rose following its better-than-expected earnings release last night. FedEx Corp (FDX +0.91%) was higher after quarterly results fell less than analysts projected. The new General Motors Company (GM +6.63%) rose after the automaker said it plans to purchase 200 million shares from the U.S. Treasury. Shares of Alcoa Inc (AA -3.03%) fell after S&P placed the aluminum maker's credit rating under review for a possible downgrade.
Treasuries were higher with the 10-year note up 1/8 of a point to yield 1.80%.
Technically, the market direction (M criteria) remains in a confirmed uptrend. The Nasdaq Composite Index, benchmark S&P 500 Index, and the Dow Jones Industrial Average are again collectively rallying above their respective 50-day moving average (DMA) lines. New buying efforts may be justified only in worthy high-ranked leaders. See the noteworthy companies included on the Featured Stocks Page.
Watch for an announcement via email concerning the next WEBCAST. The webcast will also be available via an updated link highlighted at the top of the Premium Member Homepage.
PICTURED: The NYSE Composite Index touched a new 2012 high earlier before reversing into the red.
|
 Kenneth J. Gruneisen started out as a licensed stockbroker in August 1987, a couple of months prior to the historic stock market crash that took the Dow Jones Industrial Average down -22.6% in a single day. He has published daily fact-based fundamental and technical analysis on high-ranked stocks online for two decades. Through FACTBASEDINVESTING.COM, Kenneth provides educational articles, news, market commentary, and other information regarding proven investment systems that work in good times and bad.
Comments contained in the body of this report are technical opinions only and are not necessarily those of Gruneisen Growth Corp. The material herein has been obtained from sources believed to be reliable and accurate, however, its accuracy and completeness cannot be guaranteed. Our firm, employees, and customers may effect transactions, including transactions contrary to any recommendation herein, or have positions in the securities mentioned herein or options with respect thereto. Any recommendation contained in this report may not be suitable for all investors and it is not to be deemed an offer or solicitation on our part with respect to the purchase or sale of any securities. |
|
 |
Defensive Groups Fell; Tech and Financial Groups Mixed
Kenneth J. Gruneisen - Passed the CAN SLIM® Master's Exam
The Retail Index ($RLX -1.04%) was a negative influence on the major averages and defensive groups including the Gold & Silver Index ($XAU -1.00%) and the Healthcare Index ($HMO -0.81%) lost ground. Financial shares were mixed as the Bank Index ($BKX -0.74%) edged lower and the Broker/Dealer Index ($XBD +0.68%) posted a modest gain. The tech sector was also mixed as the Biotechnology Index ($BTK -0.49%) and the Internet Index ($IIX -0.28%) finished with modest losses while the Semiconductor Index ($SOX +0.19%) and the Networking Index ($NWX +0.87%) posted gains. Weakness in energy-related shares led the Integrated Oil Index ($XOI -0.63%) and the Oil Services Index ($OSX -0.34%) to small losses.
Charts courtesy www.stockcharts.com
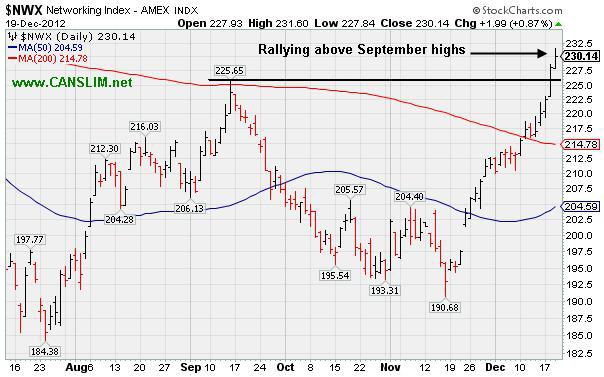
PICTURED: The Networking Index ($NWX +0.87%) has rallied above its September highs with a streak of 5 consecutive gains.
| Oil Services |
$OSX |
222.90 |
-0.77 |
-0.34% |
+3.06% |
| Healthcare |
$HMO |
2,520.98 |
-20.55 |
-0.81% |
+10.49% |
| Integrated Oil |
$XOI |
1,254.82 |
-7.96 |
-0.63% |
+2.09% |
| Semiconductor |
$SOX |
389.47 |
+0.74 |
+0.19% |
+6.87% |
| Networking |
$NWX |
230.14 |
+1.99 |
+0.87% |
+6.96% |
| Internet |
$IIX |
333.61 |
-0.94 |
-0.28% |
+18.41% |
| Broker/Dealer |
$XBD |
92.75 |
+0.62 |
+0.68% |
+11.38% |
| Retail |
$RLX |
661.97 |
-6.97 |
-1.04% |
+26.52% |
| Gold & Silver |
$XAU |
160.91 |
-1.63 |
-1.00% |
-10.92% |
| Bank |
$BKX |
51.22 |
-0.38 |
-0.74% |
+30.07% |
| Biotech |
$BTK |
1,559.96 |
-7.74 |
-0.49% |
+42.93% |
|
|
|
 |
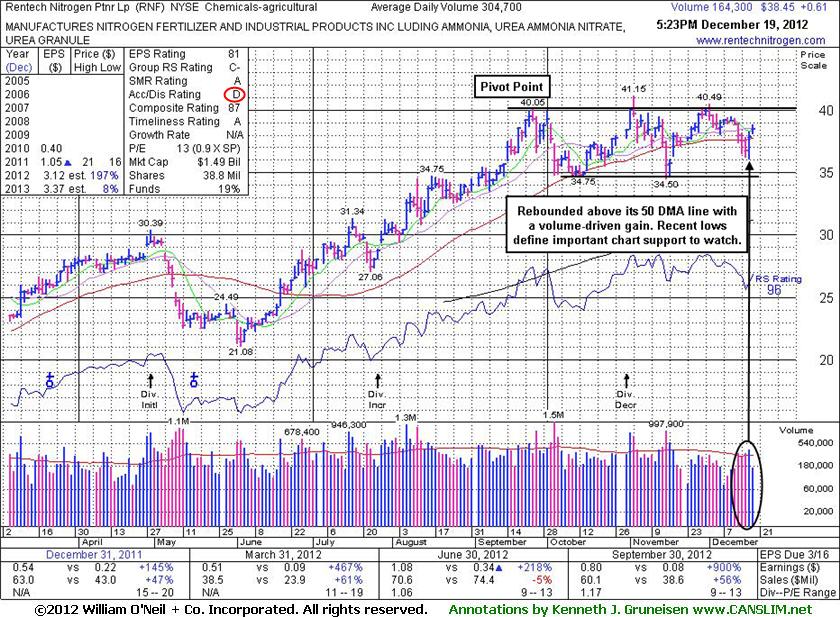
Still Awaiting Volume-Driven Gain Above Pivot Point
Kenneth J. Gruneisen - Passed the CAN SLIM® Master's Exam
Rentech Nitrogen Ptnr LP (RNF +$0.61 or +1.61% to $38.45) improved its technical stance by rebounding above its 50-day moving average (DMA) line with a volume-driven gain on the prior session, and it posted another gain today on lighter volume. Disciplined investors may still be watching for volume-driven gains for a new high close to trigger a technical buy signal. Meanwhile, recent lows define chart support to watch where subsequent violations may raise serious concerns and trigger technical sell signals.
Its last appearance in this FSU section was on 11/26/12 with an annotated graph under the headline, "Rebounded Above 50 DMA Line Near 52-Week High". The market direction (M criteria) was noted as favorable again for taking action on new buy candidates. However, concerns have been raised by its Accumulation/Distribution Rating which stands at a D today (see red circle). As previously mentioned - "That is a good reason to not jump in "early" but to instead wait for proof of fresh institutional buying demand."
On 11/01/12 its color code was changed to yellow with a new pivot point cited based on its 9/25/12 high plus 10 cents, but the noted "negative reversal" kept it from triggering a new buy signal and it has since zig zagged above and below its 50 DMA line. On 8/07/12 it triggered a technical buy signal with its considerable gain backed by +266% above average volume as it rallied above its earlier pivot point into new high territory. It traded as much as +35.4% higher within less than 2 months afterward.
The number of top-rated funds owning its shares fell from 52 in Jun '12 to 47 as of Sep '12, a slightly disconcerting sign concerning the I criteria. However, its current Up/Down Volume Ratio of 1.2 indicates a slightly reassuring sign of institutional accumulation over the past 50 days.
|
|
|
Color Codes Explained :
Y - Better candidates highlighted by our
staff of experts.
G - Previously featured
in past reports as yellow but may no longer be buyable under the
guidelines.
***Last / Change / Volume data in this table is the closing quote data***
Symbol/Exchange
Company Name
Industry Group |
PRICE |
CHANGE
(%Change) |
Day High |
Volume
(% DAV)
(% 50 day avg vol) |
52 Wk Hi
% From Hi |
Featured
Date |
Price
Featured |
Pivot Featured |
|
Max Buy |
CELG
-
NASDAQ
Celgene Corp
DRUGS - Drug Manufacturers - Major
|
$79.70
|
-0.33
-0.41% |
$80.63
|
2,948,082
104.64% of 50 DAV
50 DAV is 2,817,400
|
$82.78
-3.72%
|
12/11/2012
|
$82.24
|
PP = $81.34
|
|
MB = $85.41
|
Most Recent Note - 12/17/2012 5:42:05 PM
Y - Halted its slide with a gain today. Slumped below its pivot point following a technical buy signal on 12/11/12, however its small losses lacked great volume conviction. Disciplined investors always limit losses if any stock falls -7% from their purchase price.
>>> The latest Featured Stock Update with an annotated graph appeared on 12/12/2012. Click here.
View all notes |
Alert me of new notes |
CANSLIM.net Company Profile |
SEC |
Zacks Reports |
StockTalk |
News |
Chart |
Request a new note
C
A N
S L
I M


|
CFNL
-
NASDAQ
Cardinal Financial Corp
BANKING - Regional - Southeast Banks
|
$16.16
|
+0.00
0.00% |
$16.23
|
100,859
49.08% of 50 DAV
50 DAV is 205,500
|
$16.32
-0.98%
|
12/3/2012
|
$15.20
|
PP = $16.31
|
|
MB = $17.13
|
Most Recent Note - 12/18/2012 4:04:26 PM
Y - A 2nd consecutive volume-driven gain today led to a best-ever close. A rally above its pivot point backed by at least +40% above average volume is still needed to trigger a proper new (or add-on) technical buy signal.
>>> The latest Featured Stock Update with an annotated graph appeared on 12/10/2012. Click here.
View all notes |
Alert me of new notes |
CANSLIM.net Company Profile |
SEC |
Zacks Reports |
StockTalk |
News |
Chart |
Request a new note
C
A N
S L
I M
|
CMCSA
-
NASDAQ
Comcast Corp Cl A
MEDIA - CATV Systems
|
$38.01
|
-0.04
-0.11% |
$38.19
|
13,650,342
114.77% of 50 DAV
50 DAV is 11,894,000
|
$38.15
-0.37%
|
12/3/2012
|
$37.08
|
PP = $38.06
|
|
MB = $39.96
|
Most Recent Note - 12/17/2012 5:36:01 PM
Y - Rallied up from its 50 DMA line with a volume-driven gain today, finishing only -1.1% off its 52-week high. Disciplined investors will watch for gains above the pivot point backed by at least the bare minimum +40% above average volume threshold to trigger a proper new (or add-on) technical buy signal before taking action.
>>> The latest Featured Stock Update with an annotated graph appeared on 12/7/2012. Click here.
View all notes |
Alert me of new notes |
CANSLIM.net Company Profile |
SEC |
Zacks Reports |
StockTalk |
News |
Chart |
Request a new note
C
A N
S L
I M
|
MIDD
-
NASDAQ
Middleby Corp
MANUFACTURING - Diversified Machinery
|
$132.05
|
-0.34
-0.26% |
$134.51
|
123,685
151.39% of 50 DAV
50 DAV is 81,700
|
$133.14
-0.82%
|
10/8/2012
|
$118.46
|
PP = $122.67
|
|
MB = $128.80
|
 Most Recent Note - 12/19/2012 12:16:58 PM
G - Hitting new 52-week and all-time highs again with today's 4th consecutive gain, getting more extended beyond its "max buy" level. Earnings +23% on +18% sales for the Sep '12 quarter, below the +25% minimum earnings guideline (C criteria), raised concerns.
>>> The latest Featured Stock Update with an annotated graph appeared on 12/6/2012. Click here.
View all notes |
Alert me of new notes |
CANSLIM.net Company Profile |
SEC |
Zacks Reports |
StockTalk |
News |
Chart |
Request a new note
C
A N
S L
I M
|
N
-
NYSE
Netsuite Inc
DIVERSIFIED SERVICES - Business/Management Services
|
$67.28
|
+1.02
1.54% |
$67.82
|
410,693
87.79% of 50 DAV
50 DAV is 467,800
|
$67.02
0.39%
|
12/12/2012
|
$64.75
|
PP = $67.12
|
|
MB = $70.48
|
Most Recent Note - 12/19/2012 3:31:42 PM
Y - Wedging up and hitting a new 52-week high with today's 4th consecutive gain while inching above its pivot point without great volume conviction. Disciplined investors know that volume must be at least +40% above average behind gains above the pivot point to trigger a proper technical buy signal.
>>> The latest Featured Stock Update with an annotated graph appeared on 12/13/2012. Click here.
View all notes |
Alert me of new notes |
CANSLIM.net Company Profile |
SEC |
Zacks Reports |
StockTalk |
News |
Chart |
Request a new note
C
A N
S L
I M
|
Symbol/Exchange
Company Name
Industry Group |
PRICE |
CHANGE
(%Change) |
Day High |
Volume
(% DAV)
(% 50 day avg vol) |
52 Wk Hi
% From Hi |
Featured
Date |
Price
Featured |
Pivot Featured |
|
Max Buy |
NSR
-
NYSE
Neustar Inc
TELECOMMUNICATIONS - Diversified Communication Serv
|
$43.10
|
-0.10
-0.23% |
$43.68
|
452,843
129.49% of 50 DAV
50 DAV is 349,700
|
$43.85
-1.71%
|
12/11/2012
|
$41.85
|
PP = $41.41
|
|
MB = $43.48
|
Most Recent Note - 12/17/2012 12:25:48 PM
Y - Trading up today with higher volume, yet it remains below its "max buy" level. Clinched a technical buy signal on 12/11/12 as it rallied from a 10-week base. Quarterly comparisons through Sep '12 showed 3 consecutive increases of more than the +25% minimum earnings guideline (C criteria). Prior highs near $41 define initial support to watch on pullbacks.
>>> The latest Featured Stock Update with an annotated graph appeared on 12/11/2012. Click here.
View all notes |
Alert me of new notes |
CANSLIM.net Company Profile |
SEC |
Zacks Reports |
StockTalk |
News |
Chart |
Request a new note
C
A N
S L
I M
|
RAX
-
NYSE
Rackspace Hosting Inc
INTERNET - Internet Software and; Services
|
$71.93
|
-0.51
-0.70% |
$73.23
|
1,502,250
97.86% of 50 DAV
50 DAV is 1,535,100
|
$73.37
-1.96%
|
12/18/2012
|
$71.88
|
PP = $70.10
|
|
MB = $73.61
|
Most Recent Note - 12/18/2012 5:49:46 PM
Y - Rallied and closed above a new pivot point cited based on its 11/29/12 high plus 10 cents clinching a new (or add-on) technical buy signal. See the latest FSU analysis for more details and a new annotated graph.
>>> The latest Featured Stock Update with an annotated graph appeared on 12/18/2012. Click here.
View all notes |
Alert me of new notes |
CANSLIM.net Company Profile |
SEC |
Zacks Reports |
StockTalk |
News |
Chart |
Request a new note
C
A N
S L
I M
|
RNF
-
NYSE
Rentech Nitrogen Ptnr Lp
CHEMICALS - Agricultural Chemicals
|
$38.45
|
+0.61
1.61% |
$38.83
|
164,304
53.92% of 50 DAV
50 DAV is 304,700
|
$41.15
-6.56%
|
11/1/2012
|
$39.11
|
PP = $40.15
|
|
MB = $42.16
|
Most Recent Note - 12/19/2012 5:37:21 PM
Y - Disciplined investors may still be watching for volume-driven gains for a new high close to trigger a technical buy signal. See the latest FSU analysis for more details and a new annotated graph.
>>> The latest Featured Stock Update with an annotated graph appeared on 12/19/2012. Click here.
View all notes |
Alert me of new notes |
CANSLIM.net Company Profile |
SEC |
Zacks Reports |
StockTalk |
News |
Chart |
Request a new note
C
A N
S L
I M
|
ULTA
-
NASDAQ
Ulta Salon Cosm & Frag
SPECIALTY RETAIL - Specialty Retail, Other
|
$96.34
|
-1.58
-1.61% |
$98.33
|
468,940
58.44% of 50 DAV
50 DAV is 802,400
|
$103.52
-6.94%
|
12/4/2012
|
$100.29
|
PP = $103.62
|
|
MB = $108.80
|
Most Recent Note - 12/19/2012 3:27:04 PM
Y - Consolidating above its 50 DMA line which recently acted as support. Subsequent deterioration below its 50 DMA or 200 DMA line would raise more serious concerns and trigger technical sell signals. Meanwhile, disciplined investors will watch for volume-driven gains above the pivot point to trigger a new technical buy signal before taking action.
>>> The latest Featured Stock Update with an annotated graph appeared on 12/4/2012. Click here.
View all notes |
Alert me of new notes |
CANSLIM.net Company Profile |
SEC |
Zacks Reports |
StockTalk |
News |
Chart |
Request a new note
C
A N
S L
I M
|
VSI
-
NYSE
Vitamin Shoppe Inc
SPECIALTY RETAIL - Specialty Retail, Other
|
$59.31
|
+0.55
0.94% |
$59.70
|
162,857
66.80% of 50 DAV
50 DAV is 243,800
|
$61.89
-4.17%
|
12/3/2012
|
$59.06
|
PP = $61.99
|
|
MB = $65.09
|
Most Recent Note - 12/18/2012 4:01:11 PM
Y - Solid gain on above average volume and strong close near the session high today helped it rally back above its 50 DMA line and its color code is changed to yellow. The $61 area has been a stubborn resistance level in recent months.
>>> The latest Featured Stock Update with an annotated graph appeared on 12/3/2012. Click here.
View all notes |
Alert me of new notes |
CANSLIM.net Company Profile |
SEC |
Zacks Reports |
StockTalk |
News |
Chart |
Request a new note
C
A N
S L
I M
|
Symbol/Exchange
Company Name
Industry Group |
PRICE |
CHANGE
(%Change) |
Day High |
Volume
(% DAV)
(% 50 day avg vol) |
52 Wk Hi
% From Hi |
Featured
Date |
Price
Featured |
Pivot Featured |
|
Max Buy |
WPI
-
NYSE
Watson Pharmaceuticals
DRUGS - Drugs - Generic
|
$88.90
|
-0.91
-1.01% |
$90.80
|
577,150
75.25% of 50 DAV
50 DAV is 767,000
|
$90.39
-1.65%
|
12/17/2012
|
$87.99
|
PP = $90.49
|
|
MB = $95.01
|
Most Recent Note - 12/18/2012 4:20:47 PM
Y - Up today with average volume for a best-ever close. Perched within close striking distance of its 52-week high today and no resistance remains due to overhead supply. Color code was changed to yellow with new pivot point cited based on its 12/12/12 high plus 10 cents.
>>> The latest Featured Stock Update with an annotated graph appeared on 12/17/2012. Click here.
View all notes |
Alert me of new notes |
CANSLIM.net Company Profile |
SEC |
Zacks Reports |
StockTalk |
News |
Chart |
Request a new note
C
A N
S L
I M
|
|
|
|
THESE ARE NOT BUY RECOMMENDATIONS!
Comments contained in the body of this report are technical
opinions only. The material herein has been obtained
from sources believed to be reliable and accurate, however,
its accuracy and completeness cannot be guaranteed.
This site is not an investment advisor, hence it does
not endorse or recommend any securities or other investments.
Any recommendation contained in this report may not
be suitable for all investors and it is not to be deemed
an offer or solicitation on our part with respect to
the purchase or sale of any securities. All trademarks,
service marks and trade names appearing in this report
are the property of their respective owners, and are
likewise used for identification purposes only.
This report is a service available
only to active Paid Premium Members.
You may opt-out of receiving report notifications
at any time. Questions or comments may be submitted
by writing to Premium Membership Services 665 S.E. 10 Street, Suite 201 Deerfield Beach, FL 33441-5634 or by calling 1-800-965-8307
or 954-785-1121.
|
|
|

