You are not logged in.
This means you
CAN ONLY VIEW reports that were published prior to Monday, April 14, 2025.
You
MUST UPGRADE YOUR MEMBERSHIP if you want to see any current reports.
AFTER MARKET UPDATE - MONDAY, DECEMBER 19TH, 2011
Previous After Market Report Next After Market Report >>>
|
|
|
|
DOW |
-100.13 |
11,766.26 |
-0.84% |
|
Volume |
774,694,660 |
-57% |
|
Volume |
1,526,469,270 |
-38% |
|
NASDAQ |
-32.19 |
2,523.14 |
-1.26% |
|
Advancers |
635 |
20% |
|
Advancers |
565 |
21% |
|
S&P 500 |
-14.31 |
1,205.35 |
-1.17% |
|
Decliners |
2,396 |
77% |
|
Decliners |
2,029 |
76% |
|
Russell 2000 |
-13.49 |
708.56 |
-1.87% |
|
52 Wk Highs |
77 |
|
|
52 Wk Highs |
33 |
|
|
S&P 600 |
-6.62 |
397.17 |
-1.64% |
|
52 Wk Lows |
119 |
|
|
52 Wk Lows |
170 |
|
|
 |
Major Averages Fall With Poor Breadth But Lighter Volume
Kenneth J. Gruneisen - Passed the CAN SLIM® Master's Exam
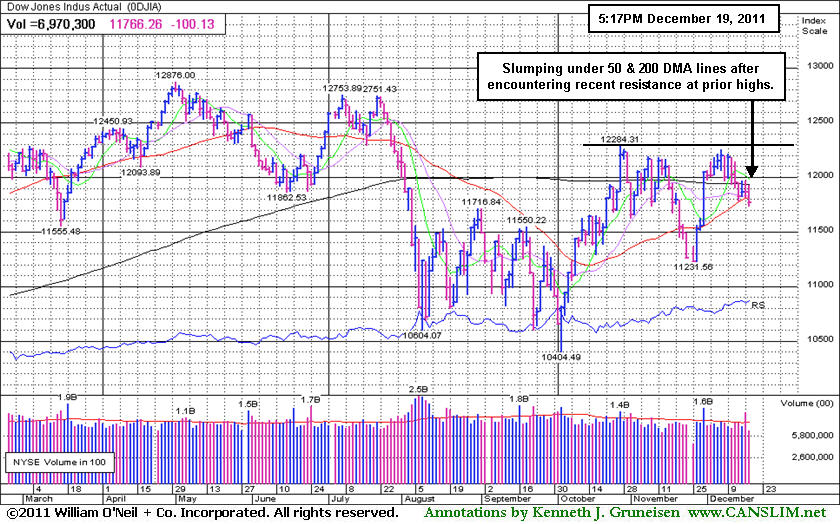
The Dow Jones Industrial Average, S&P 500 Index, and the Nasdaq Composite Index ended unanimously lower on Monday. Volume totals were lighter on the NYSE and on the Nasdaq exchange, down from Friday's session totals which were inflated by options expirations. Decliners led advancers by almost 4-1 on the NYSE and on the Nasdaq exchange. New 52-week lows considerably outnumbered new highs on the NYSE and on the Nasdaq exchange. There were 23 high-ranked companies from the CANSLIM.net Leaders List that made new 52-week highs and appeared on the CANSLIM.net BreakOuts Page, up a notch from the prior session total of 22 stocks. There were gains for only 7 of the 18 high-ranked companies currently included on the Featured Stocks Page.
Stocks were initially higher as Euro-area finance ministers discussed the possibility for 200 billion euros in additional funding through the IMF. However, negative comments from ECB President Mario Draghi put a damper on investor optimism. Draghi said substantial risks to the economy remain and the law forbids him from stepping up government bond purchases. In other regional action, an EU source said finance ministers failed to agree on raising the joint ceiling for the European Stability Mechanism and European Financial Stability Facility.
Banks were also hit hard as the Federal Reserve is expected to embrace a new global framework that requires big banks to hold extra capital. Bank of America Corp (BAC), JPMorgan Chase & Co (JPM), and Citigroup Inc (C) all gave up more than -3.5% off of the news.
Commodity producers also retreated as prices fell on concern that demand will ease after property prices declined in China. Alcoa Inc (AA -3.18%) and Freeport-McMoRan
Copper & Gold Inc (FCX -3.38%) slipped.
The National Association of Home Builders reported improved sentiment, with its index gaining for the third consecutive month, which was the first time since 2009, however, the index still shows new home builder sentiment is depressed.
Our monthly newsletter CANSLIM.net News will be published soon with an informative review of current market conditions, leading groups, and best buy candidates. Via the Premium Member Homepage links to all prior reports and webcasts are always available.
PICTURED: The Dow Jones Industrial Average is slumping under its 50-day and 200-day moving average lines after encountering resistance at recent highs.
|
 Kenneth J. Gruneisen started out as a licensed stockbroker in August 1987, a couple of months prior to the historic stock market crash that took the Dow Jones Industrial Average down -22.6% in a single day. He has published daily fact-based fundamental and technical analysis on high-ranked stocks online for two decades. Through FACTBASEDINVESTING.COM, Kenneth provides educational articles, news, market commentary, and other information regarding proven investment systems that work in good times and bad.
Comments contained in the body of this report are technical opinions only and are not necessarily those of Gruneisen Growth Corp. The material herein has been obtained from sources believed to be reliable and accurate, however, its accuracy and completeness cannot be guaranteed. Our firm, employees, and customers may effect transactions, including transactions contrary to any recommendation herein, or have positions in the securities mentioned herein or options with respect thereto. Any recommendation contained in this report may not be suitable for all investors and it is not to be deemed an offer or solicitation on our part with respect to the purchase or sale of any securities. |
|
 |
Financial, Tech, and Commodity-Linked Groups Sank
Kenneth J. Gruneisen - Passed the CAN SLIM® Master's Exam
Losses from the Bank Index ($BKX -2.70%) and Broker/Dealer Index ($XBD -2.49%) weighed on the major averages as the market fell on Monday. The tech sector was led lower by large losses from the Semiconductor Index ($SOX -2.69%), Networking Index ($NWX -2.69%), and Internet Index ($IIX -1.76%) dragged on the major averages. Meanwhile the Healthcare Index ($HMO -0.66%) and Biotechnology Index ($BTK -0.60%) edged lower, and the Retail Index ($RLX -1.10%) also fell. Commodity-linked groups had a down day as the Oil Services Index ($OSX -2.63%), Integrated Oil Index ($XOI -1.58%), and Gold & Silver Index ($XAU -2.34%) sank.
Charts courtesy www.stockcharts.com
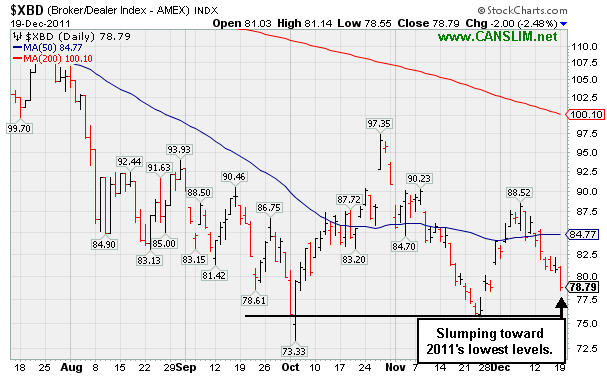
PICTURED: The Broker/Dealer Index ($XBD -2.49%) is slumping toward 2011's lowest levels.
| Oil Services |
$OSX |
205.08 |
-5.53 |
-2.63% |
-16.33% |
| Healthcare |
$HMO |
2,205.33 |
-14.63 |
-0.66% |
+30.34% |
| Integrated Oil |
$XOI |
1,151.69 |
-18.50 |
-1.58% |
-5.07% |
| Semiconductor |
$SOX |
343.36 |
-9.50 |
-2.69% |
-16.62% |
| Networking |
$NWX |
203.00 |
-5.60 |
-2.69% |
-27.64% |
| Internet |
$IIX |
270.36 |
-4.84 |
-1.76% |
-12.14% |
| Broker/Dealer |
$XBD |
78.78 |
-2.01 |
-2.49% |
-35.17% |
| Retail |
$RLX |
514.11 |
-5.72 |
-1.10% |
+1.13% |
| Gold & Silver |
$XAU |
179.04 |
-4.29 |
-2.34% |
-20.98% |
| Bank |
$BKX |
36.69 |
-1.02 |
-2.70% |
-29.73% |
| Biotech |
$BTK |
1,017.60 |
-6.19 |
-0.60% |
-21.58% |
|
|
|
 |
Secondary Buy Point Possibly Forming
Kenneth J. Gruneisen - Passed the CAN SLIM® Master's Exam
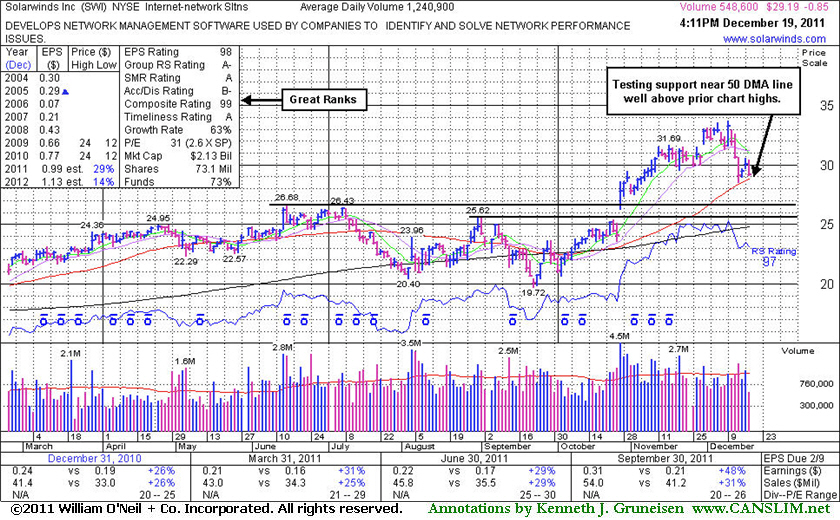
Solarwinds Inc (SWI -$0.78 or -2.60% to $29.26) halted its slide after slumping near its 50-day moving average (DMA) line last week. That important short-term average was noted as initial support to watch above prior chart highs. Its last appearance in this FSU section was on 11/22/11 with an annotated graph included under the headline, "Strong Tech Leader Extended From Prior Base."
It is still extended from its previous base pattern. Prior highs in the $25-26 area define initial chart support to watch below its 50 DMA line in the event a violation triggers a technical sell signal. Meanwhile, in the Certification program they teach that a secondary buy point to watch for (following a sound earlier breakout) is from the first successful test of support at a stock's 50 DMA line up to as much as +5% above its latest high. In this case, assuming SWI finds support near that important short-term average, it would then be buyable up to +5% above the latest high hit on 12/09/11 or $33.68 X 1.05 = $35.36.
It reported earnings +48% on +31% sales revenues for the quarter ended September 30, 2011 versus the year ago period. Prior quarterly comparisons showed sales and earnings (C criteria) above the investment system guidelines and it also has a good annual earnings (A criteria) history. The number of top-rated funds owning its shares rose from 263 in Dec '10 to 389 in Sep '11, a reassuring sign concerning the I criteria of the fact-based investment system.
The 10/27/11 "breakaway gap" helped SWI technically break out from a "double bottom" base formed over the prior 5 months. Volume was more than 4 times average behind the considerable gain, a clear indication of institutional accumulation. At the time it was noted - "A breakaway gap is the one noted exception where a stock may be bought more than +5% above its prior highs, however chasing a stock farther above prior highs increases the chance investors may be prompted to sell based on an ordinary pullback if they follow strict selling rules which say to always limit losses if a stock falls more than -7% from your purchase price."
|
|
|
Color Codes Explained :
Y - Better candidates highlighted by our
staff of experts.
G - Previously featured
in past reports as yellow but may no longer be buyable under the
guidelines.
***Last / Change / Volume data in this table is the closing quote data***
Symbol/Exchange
Company Name
Industry Group |
PRICE |
CHANGE
(%Change) |
Day High |
Volume
(% DAV)
(% 50 day avg vol) |
52 Wk Hi
% From Hi |
Featured
Date |
Price
Featured |
Pivot Featured |
|
Max Buy |
ADS
-
NYSE
Alliance Data Sys Corp
COMPUTER SOFTWARE and SERVICES - Information and Delivery Service
|
$102.80
|
-0.20
-0.19% |
$104.15
|
476,761
50.19% of 50 DAV
50 DAV is 949,900
|
$107.33
-4.22%
|
10/21/2011
|
$97.94
|
PP = $101.15
|
|
MB = $106.21
|
 Most Recent Note - 12/19/2011 5:44:53 PM
Y - Quietly consolidating just above its 50 DMA line with a small loss today on light volume. A violation of that important short-term average would raise concerns.
>>> The latest Featured Stock Update with an annotated graph appeared on 12/14/2011. Click here.
View all notes |
Alert me of new notes |
CANSLIM.net Company Profile |
SEC |
Zacks Reports |
StockTalk |
News |
Chart |
Request a new note
C
A N
S L
I M


|
ALXN
-
NASDAQ
Alexion Pharmaceuticals
DRUGS - Drug Manufacturers - Other
|
$67.24
|
+0.87
1.31% |
$68.17
|
1,327,952
87.29% of 50 DAV
50 DAV is 1,521,300
|
$70.42
-4.52%
|
11/30/2011
|
$68.66
|
PP = $70.52
|
|
MB = $74.05
|
Most Recent Note - 12/16/2011 4:35:07 PM
Y - Rallied back above its 50 DMA line today with a solid volume-driven gain helping its technical stance improve and its color code is changed to yellow. Prior lows near $62 define important near-term support to watch.
>>> The latest Featured Stock Update with an annotated graph appeared on 12/12/2011. Click here.
View all notes |
Alert me of new notes |
CANSLIM.net Company Profile |
SEC |
Zacks Reports |
StockTalk |
News |
Chart |
Request a new note
C
A N
S L
I M
|
CELG
-
NASDAQ
Celgene Corp
DRUGS - Drug Manufacturers - Major
|
$64.58
|
+0.89
1.40% |
$65.00
|
3,186,368
82.94% of 50 DAV
50 DAV is 3,841,700
|
$68.25
-5.38%
|
9/16/2011
|
$61.21
|
PP = $62.59
|
|
MB = $65.72
|
Most Recent Note - 12/15/2011 5:47:31 PM
G - Recently encountered resistance at its 50 DMA line. Gains above that short-term average would help its outlook improve, meanwhile it is -7.5% off its 52-week high. Recent lows and the 200 DMA line coincide to define the near-term chart support level near $60.
>>> The latest Featured Stock Update with an annotated graph appeared on 12/1/2011. Click here.
View all notes |
Alert me of new notes |
CANSLIM.net Company Profile |
SEC |
Zacks Reports |
StockTalk |
News |
Chart |
Request a new note
C
A N
S L
I M
|
FEIC
-
NASDAQ
F E I Co
ELECTRONICS - Diversified Electronics
|
$38.92
|
-0.64
-1.62% |
$40.20
|
303,522
69.47% of 50 DAV
50 DAV is 436,900
|
$42.25
-7.88%
|
12/7/2011
|
$41.41
|
PP = $42.35
|
|
MB = $44.47
|
Most Recent Note - 12/16/2011 4:37:37 PM
Y - Perched above its 50 DMA line which defines important near-term chart support along with prior lows in the $36 area. Disciplined investors would note that a volume-driven gain above the pivot point did not trigger any recent technical buy signal.
>>> The latest Featured Stock Update with an annotated graph appeared on 11/25/2011. Click here.
View all notes |
Alert me of new notes |
CANSLIM.net Company Profile |
SEC |
Zacks Reports |
StockTalk |
News |
Chart |
Request a new note
C
A N
S L
I M
|
GNC
-
NYSE
G N C Holdings Inc
RETAIL - Drug Stores
|
$27.97
|
+0.12
0.43% |
$28.19
|
1,347,002
104.88% of 50 DAV
50 DAV is 1,284,300
|
$28.91
-3.25%
|
10/26/2011
|
$24.60
|
PP = $24.80
|
|
MB = $26.04
|
Most Recent Note - 12/16/2011 4:38:31 PM
G - Still hovering near its all-time high today, extended from its prior base pattern. Prior chart highs and its 50 DMA line coincide in the $25-26 area defining important support to watch on pullbacks.
>>> The latest Featured Stock Update with an annotated graph appeared on 12/16/2011. Click here.
View all notes |
Alert me of new notes |
CANSLIM.net Company Profile |
SEC |
Zacks Reports |
StockTalk |
News |
Chart |
Request a new note
C
A N
S L
I M
|
Symbol/Exchange
Company Name
Industry Group |
PRICE |
CHANGE
(%Change) |
Day High |
Volume
(% DAV)
(% 50 day avg vol) |
52 Wk Hi
% From Hi |
Featured
Date |
Price
Featured |
Pivot Featured |
|
Max Buy |
HMSY
-
NASDAQ
H M S Holdings Corp
COMPUTER SOFTWARE and SERVICES - Healthcare Information Service
|
$30.50
|
-0.65
-2.09% |
$31.39
|
1,256,794
185.20% of 50 DAV
50 DAV is 678,600
|
$32.16
-5.16%
|
10/27/2011
|
$26.44
|
PP = $28.37
|
|
MB = $29.79
|
Most Recent Note - 12/19/2011 12:34:12 PM
G - Churned heavy volume last week while challenging its all-time high and completing the previously noted acquisition of HealthDataInsights, Inc. It is extended from its prior base. Prior highs in the $27-28 area acted as support during the recent pullback.
>>> The latest Featured Stock Update with an annotated graph appeared on 11/30/2011. Click here.
View all notes |
Alert me of new notes |
CANSLIM.net Company Profile |
SEC |
Zacks Reports |
StockTalk |
News |
Chart |
Request a new note
C
A N
S L
I M
|
ISRG
-
NASDAQ
Intuitive Surgical Inc
HEALTH SERVICES - Medical Appliances and Equipment
|
$432.19
|
+0.07
0.02% |
$436.95
|
196,508
47.62% of 50 DAV
50 DAV is 412,700
|
$449.06
-3.76%
|
10/19/2011
|
$424.69
|
PP = $415.29
|
|
MB = $436.05
|
Most Recent Note - 12/19/2011 5:47:46 PM
G - Posted a 3rd consecutive small gain today with lighter than average volume while consolidating just above important support at its 50 DMA line. Prior lows in the $410 area define additional near-term support to watch.
>>> The latest Featured Stock Update with an annotated graph appeared on 12/13/2011. Click here.
View all notes |
Alert me of new notes |
CANSLIM.net Company Profile |
SEC |
Zacks Reports |
StockTalk |
News |
Chart |
Request a new note
C
A N
S L
I M
|
MELI
-
NASDAQ
Mercadolibre Inc
INTERNET - Internet Software and; Services
|
$83.22
|
-0.88
-1.05% |
$85.47
|
250,290
37.61% of 50 DAV
50 DAV is 665,400
|
$95.48
-12.84%
|
12/5/2011
|
$91.08
|
PP = $92.83
|
|
MB = $97.47
|
Most Recent Note - 12/16/2011 4:51:02 PM
G - Down today for a 5th consecutive loss on near average or lighter volume, slumping -11.9% off its all-time high. Color code was changed to green based on its deterioration below the pivot point cited. Disciplined investors limit losses if ever a stock falls -7% from their purchase price.
>>> The latest Featured Stock Update with an annotated graph appeared on 12/5/2011. Click here.
View all notes |
Alert me of new notes |
CANSLIM.net Company Profile |
SEC |
Zacks Reports |
StockTalk |
News |
Chart |
Request a new note
C
A N
S L
I M
|
MG
-
NYSE
Mistras Group Inc
DIVERSIFIED SERVICES - Bulding and Faci;ity Management Services
|
$22.79
|
-0.83
-3.51% |
$24.03
|
130,089
62.81% of 50 DAV
50 DAV is 207,100
|
$25.28
-9.85%
|
10/28/2011
|
$22.49
|
PP = $23.61
|
|
MB = $24.79
|
Most Recent Note - 12/19/2011 5:36:38 PM
Y - Down today for a 3rd consecutive loss, slumping below its pivot point and raising some concerns. Prior highs in the $23 area define initial chart support to watch above its 50 DMA line.
>>> The latest Featured Stock Update with an annotated graph appeared on 12/8/2011. Click here.
View all notes |
Alert me of new notes |
CANSLIM.net Company Profile |
SEC |
Zacks Reports |
StockTalk |
News |
Chart |
Request a new note
C
A N
S L
I M
|
MKTX
-
NASDAQ
Marketaxess Holdings Inc
FINANCIAL SERVICES - Investment Brokerage - Nationa
|
$28.95
|
+0.27
0.94% |
$29.15
|
211,622
87.41% of 50 DAV
50 DAV is 242,100
|
$31.45
-7.95%
|
10/28/2011
|
$29.79
|
PP = $31.05
|
|
MB = $32.60
|
Most Recent Note - 12/15/2011 1:24:06 PM
Y - Considerable gain today has it rebounding above its 50 DMA line, helping its technical stance, and its color code is changed to yellow. Still facing previously stubborn resistance in the $31 area, meanwhile volume-driven gains are needed to confirm a proper buy signal.
>>> The latest Featured Stock Update with an annotated graph appeared on 11/23/2011. Click here.
View all notes |
Alert me of new notes |
CANSLIM.net Company Profile |
SEC |
Zacks Reports |
StockTalk |
News |
Chart |
Request a new note
C
A N
S L
I M
|
Symbol/Exchange
Company Name
Industry Group |
PRICE |
CHANGE
(%Change) |
Day High |
Volume
(% DAV)
(% 50 day avg vol) |
52 Wk Hi
% From Hi |
Featured
Date |
Price
Featured |
Pivot Featured |
|
Max Buy |
OSIS
-
NASDAQ
O S I Systems Inc
ELECTRONICS - Semiconductor Equipment and Mate
|
$45.33
|
-0.77
-1.67% |
$47.15
|
59,596
40.16% of 50 DAV
50 DAV is 148,400
|
$49.04
-7.57%
|
11/1/2011
|
$42.07
|
PP = $45.57
|
|
MB = $47.85
|
Most Recent Note - 12/15/2011 5:50:23 PM
Y - Posted a 2nd consecutive gain today with light volume, consolidating just above its 50 DMA line defining near-term chart support. It has made no headway since its gap gain with +44% above average volume on 11/30/11 triggered a technical buy signal.
>>> The latest Featured Stock Update with an annotated graph appeared on 11/28/2011. Click here.
View all notes |
Alert me of new notes |
CANSLIM.net Company Profile |
SEC |
Zacks Reports |
StockTalk |
News |
Chart |
Request a new note
C
A N
S L
I M
|
PRGO
-
NASDAQ
Perrigo Co
DRUGS - Drug Related Products
|
$98.03
|
-0.15
-0.15% |
$99.19
|
1,109,600
130.93% of 50 DAV
50 DAV is 847,500
|
$101.94
-3.84%
|
12/9/2011
|
$99.54
|
PP = $101.56
|
|
MB = $106.64
|
Most Recent Note - 12/19/2011 12:54:22 PM
Y - Found impressive support last week while consolidating above its 50 DMA line. Insider buying was recently reported while perched near all-time highs, which is a reassuring sign. It has formed a late-stage base, however disciplined investors would watch for confirming gains to trigger a proper new technical buy signal. Chart readers may note that its Relative Strength line peaked in September and did not recently lead the way confirming new highs.
>>> The latest Featured Stock Update with an annotated graph appeared on 12/9/2011. Click here.
View all notes |
Alert me of new notes |
CANSLIM.net Company Profile |
SEC |
Zacks Reports |
StockTalk |
News |
Chart |
Request a new note
C
A N
S L
I M
|
RAX
-
NYSE
Rackspace Hosting Inc
INTERNET - Internet Software and; Services
|
$44.21
|
+0.11
0.25% |
$44.85
|
1,733,054
108.96% of 50 DAV
50 DAV is 1,590,600
|
$46.50
-4.91%
|
11/8/2011
|
$44.28
|
PP = $46.27
|
|
MB = $48.58
|
Most Recent Note - 12/19/2011 5:49:51 PM
Y - Today it posted a 3rd consecutive gain while churning near its 52-week and all-time high, making limited price progress in recent weeks. Its Relative Strength line has led the way into new high territory recently, which is recognized as a positive characteristic in buy candidates. Support to watch is at its closely coinciding 50 and 200 DMA lines. Subsequent violations would trigger damaging technical sell signals.
>>> The latest Featured Stock Update with an annotated graph appeared on 12/7/2011. Click here.
View all notes |
Alert me of new notes |
CANSLIM.net Company Profile |
SEC |
Zacks Reports |
StockTalk |
News |
Chart |
Request a new note
C
A N
S L
I M
|
SWI
-
NYSE
Solarwinds Inc
COMPUTER SOFTWARE and SERVICES - Application Software
|
$29.26
|
-0.78
-2.60% |
$30.43
|
650,224
55.47% of 50 DAV
50 DAV is 1,172,200
|
$33.68
-13.12%
|
10/27/2011
|
$27.78
|
PP = $25.62
|
|
MB = $26.90
|
Most Recent Note - 12/16/2011 4:40:55 PM
G - Halted its slide after slumping near its 50 DMA line this week. That important short-term average was noted as initial support to watch above prior chart highs.
>>> The latest Featured Stock Update with an annotated graph appeared on 12/19/2011. Click here.
View all notes |
Alert me of new notes |
CANSLIM.net Company Profile |
SEC |
Zacks Reports |
StockTalk |
News |
Chart |
Request a new note
C
A N
S L
I M
|
TDG
-
NYSE
Transdigm Group Inc
AEROSPACE/DEFENSE - Aerospace/Defense Products and; Services
|
$95.56
|
-0.42
-0.44% |
$96.98
|
216,270
52.37% of 50 DAV
50 DAV is 413,000
|
$102.73
-6.98%
|
11/9/2011
|
$98.45
|
PP = $95.14
|
|
MB = $99.90
|
Most Recent Note - 12/15/2011 5:52:56 PM
Y - Small gain today on lighter volume halted a streak of 3 consecutive losses. Its 50 DMA line defines near-term support above recent lows where subsequent violations would trigger technical sell signals.
>>> The latest Featured Stock Update with an annotated graph appeared on 12/6/2011. Click here.
View all notes |
Alert me of new notes |
CANSLIM.net Company Profile |
SEC |
Zacks Reports |
StockTalk |
News |
Chart |
Request a new note
C
A N
S L
I M
|
Symbol/Exchange
Company Name
Industry Group |
PRICE |
CHANGE
(%Change) |
Day High |
Volume
(% DAV)
(% 50 day avg vol) |
52 Wk Hi
% From Hi |
Featured
Date |
Price
Featured |
Pivot Featured |
|
Max Buy |
UA
-
NYSE
Under Armour Inc Cl A
CONSUMER NON-DURABLES - Textile - Apparel Clothing
|
$72.03
|
-2.10
-2.83% |
$74.90
|
601,168
45.26% of 50 DAV
50 DAV is 1,328,400
|
$87.40
-17.59%
|
10/25/2011
|
$82.43
|
PP = $80.80
|
|
MB = $84.84
|
Most Recent Note - 12/19/2011 5:39:09 PM
G - Loss today on light volume has it slumping further below the previously noted low ($73.55 on 11/21/11) and testing important chart support at its 200 DMA line. More damaging losses would raise serious concerns.
>>> The latest Featured Stock Update with an annotated graph appeared on 11/29/2011. Click here.
View all notes |
Alert me of new notes |
CANSLIM.net Company Profile |
SEC |
Zacks Reports |
StockTalk |
News |
Chart |
Request a new note
C
A N
S L
I M
|
ULTA
-
NASDAQ
Ulta Salon Cosm & Frag
SPECIALTY RETAIL - Specialty Retail, Other
|
$64.91
|
-2.10
-3.13% |
$68.00
|
966,578
91.32% of 50 DAV
50 DAV is 1,058,400
|
$75.70
-14.25%
|
12/2/2011
|
$72.88
|
PP = $75.79
|
|
MB = $79.58
|
Most Recent Note - 12/19/2011 5:40:56 PM
G - Loss today on average volume has it testing prior lows near $64 previously noted as an important chart support level above its 200 DMA line.
>>> The latest Featured Stock Update with an annotated graph appeared on 12/2/2011. Click here.
View all notes |
Alert me of new notes |
CANSLIM.net Company Profile |
SEC |
Zacks Reports |
StockTalk |
News |
Chart |
Request a new note
C
A N
S L
I M
|
V
-
NYSE
Visa Inc Cl A
DIVERSIFIED SERVICES - Business/Management Services
|
$98.58
|
+1.14
1.17% |
$99.37
|
5,884,706
110.93% of 50 DAV
50 DAV is 5,305,100
|
$98.60
-0.02%
|
10/24/2011
|
$94.21
|
PP = $94.85
|
|
MB = $99.59
|
Most Recent Note - 12/19/2011 5:42:59 PM
Y - Up today with slightly above average volume for its best close of all-time, bucking the mostly negative action in the broader market. See the latest FSU analysis for more details and a new annotated graph.
>>> The latest Featured Stock Update with an annotated graph appeared on 12/15/2011. Click here.
View all notes |
Alert me of new notes |
CANSLIM.net Company Profile |
SEC |
Zacks Reports |
StockTalk |
News |
Chart |
Request a new note
C
A N
S L
I M
|
|
|
|
THESE ARE NOT BUY RECOMMENDATIONS!
Comments contained in the body of this report are technical
opinions only. The material herein has been obtained
from sources believed to be reliable and accurate, however,
its accuracy and completeness cannot be guaranteed.
This site is not an investment advisor, hence it does
not endorse or recommend any securities or other investments.
Any recommendation contained in this report may not
be suitable for all investors and it is not to be deemed
an offer or solicitation on our part with respect to
the purchase or sale of any securities. All trademarks,
service marks and trade names appearing in this report
are the property of their respective owners, and are
likewise used for identification purposes only.
This report is a service available
only to active Paid Premium Members.
You may opt-out of receiving report notifications
at any time. Questions or comments may be submitted
by writing to Premium Membership Services 665 S.E. 10 Street, Suite 201 Deerfield Beach, FL 33441-5634 or by calling 1-800-965-8307
or 954-785-1121.
|
|
|

