You are not logged in.
This means you
CAN ONLY VIEW reports that were published prior to Tuesday, April 15, 2025.
You
MUST UPGRADE YOUR MEMBERSHIP if you want to see any current reports.
AFTER MARKET UPDATE - FRIDAY, DECEMBER 16TH, 2011
Previous After Market Report Next After Market Report >>>
|
|
|
|
DOW |
-2.42 |
11,866.39 |
-0.02% |
|
Volume |
1,788,727,850 |
+106% |
|
Volume |
2,457,089,640 |
+45% |
|
NASDAQ |
+14.32 |
2,555.33 |
+0.56% |
|
Advancers |
1,833 |
59% |
|
Advancers |
1,403 |
53% |
|
S&P 500 |
+3.91 |
1,219.66 |
+0.32% |
|
Decliners |
1,150 |
37% |
|
Decliners |
1,115 |
42% |
|
Russell 2000 |
+6.04 |
722.05 |
+0.84% |
|
52 Wk Highs |
75 |
|
|
52 Wk Highs |
40 |
|
|
S&P 600 |
+3.31 |
403.79 |
+0.83% |
|
52 Wk Lows |
64 |
|
|
52 Wk Lows |
119 |
|
|
 |
Major Averages Lost Ground While Damage Mounted in Past Week
Kenneth J. Gruneisen - Passed the CAN SLIM® Master's Exam
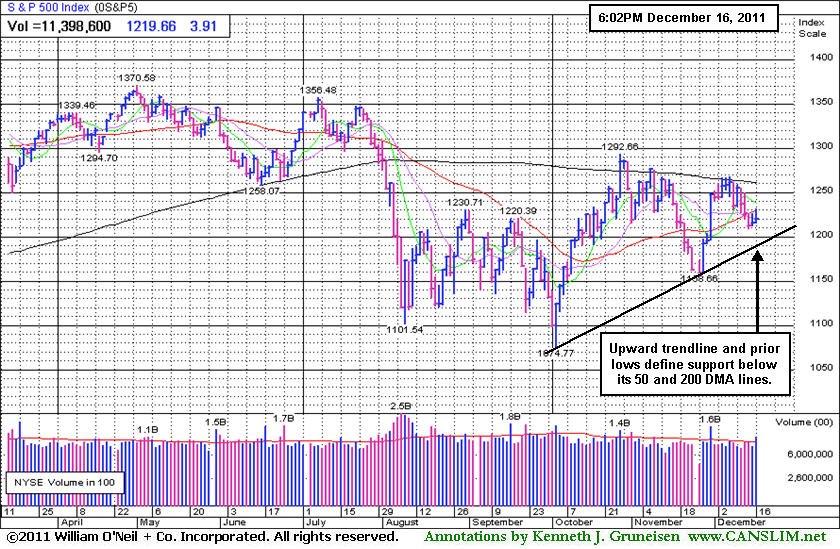
Markets closed Friday's trading session mixed but mostly higher. Volume totals were reported substantially higher on the NYSE and on the Nasdaq exchange versus Thursday's session totals, inflated by options expirations. For the week, the Dow Jones Industrial Average was down -2.65%, the S&P 500 Index fell -2.86%, and the Nasdaq Composite Index lost -3.46%. On the NYSE Friday advancing issues led decliners by 3-2 and advancing issues led decliners by about 7-5 on the Nasdaq exchange. New 52-week highs outnumbered new 52-week lows on the NYSE and yet new lows considerably outnumbered new highs on the Nasdaq exchange. There were 22 high-ranked companies from the CANSLIM.net Leaders List that made new 52-week highs and appeared on the CANSLIM.net BreakOuts Page, up from the prior session total of 10 stocks. There were losses for only 3 of the 18 high-ranked companies currently included on the Featured Stocks Page.
Stocks had erased earlier gains at mid-session. The U.S. dollar wiped out losses against the euro. Markets were initially higher amid signs that stresses in European markets were easing. Two-year yields on Spanish and Italian bonds retreated from record highs and Euro Group head, Jean-Claude Juncker, said the European Union should meet an informal Dec. 19 deadline for arranging loans to the International Monetary Fund. Economic data was positive as consumer prices were flat in November. Core prices, which exclude food and energy costs, rose +0.2%, more than forecast.
Fitch Ratings lowered France’s rating outlook to negative and put Belgium, Spain, Slovenia, Italy, Ireland and Cyprus on review for a downgrade, citing Europe’s failure to find a “comprehensive solution” to the debt crisis. It also said all investment-grade countries in the euro region rated below AAA are subject to a rating watch negative review, which the firm expects to complete by the end of January.
Markets lost steam after European markets closed lower. The London FTSE lost -0.25%, while the DAX in Frankfurt dropped -0.50% and France's CAC 40 gave up -0.88%. Additional pressure came from Fitch's downgrade of The Goldman Sachs Group Inc (GS -1.96%), Bank of America Corp (BAC -1.14%) and five other large banks based in Europe and the US while the ratings firm cited "increased challenges" in the financial markets.
In commodities, copper rallied the most in two weeks, gold climbed for the first time in five days, but crude oil headed for its worst week since September. In bondland, Treasuries experienced their largest weekly gains since early November. The 10-year yield fell to a two-month low of 1.85%, quickly approaching the record low of 1.67% reached back on September 23.
International Business Machines Corp (IBM -2.09%) and United Technologies (UTX -1.55%) to lead the blue-chip laggards. In other action, Research In Motion Ltd (RIMM -11.17%) fell after missing earnings expectations and delaying the release of new devices.
Our monthly newsletter CANSLIM.net News will be published soon with an informative review of current market conditions, leading groups, and best buy candidates. Via the Premium Member Homepage links to all prior reports and webcasts are always available.
PICTURED: The S&P 500 Index's upward trendline and prior lows define support below its 50-day and 200-day moving average (DMA) lines. Year-to-date, the Dow Jones Industrial Average is up +2.45%. The S&P 500 Index is negative by -3.05%. The Nasdaq Composite Index is off -3.68%.
|
 Kenneth J. Gruneisen started out as a licensed stockbroker in August 1987, a couple of months prior to the historic stock market crash that took the Dow Jones Industrial Average down -22.6% in a single day. He has published daily fact-based fundamental and technical analysis on high-ranked stocks online for two decades. Through FACTBASEDINVESTING.COM, Kenneth provides educational articles, news, market commentary, and other information regarding proven investment systems that work in good times and bad.
Comments contained in the body of this report are technical opinions only and are not necessarily those of Gruneisen Growth Corp. The material herein has been obtained from sources believed to be reliable and accurate, however, its accuracy and completeness cannot be guaranteed. Our firm, employees, and customers may effect transactions, including transactions contrary to any recommendation herein, or have positions in the securities mentioned herein or options with respect thereto. Any recommendation contained in this report may not be suitable for all investors and it is not to be deemed an offer or solicitation on our part with respect to the purchase or sale of any securities. |
|
 |
Defensive and Energy-Linked Groups Led Gainers
Kenneth J. Gruneisen - Passed the CAN SLIM® Master's Exam
Energy-related shares rose, boosting the Oil Services Index ($OSX +1.96%) and Integrated Oil Index ($XOI +0.51%). Defensive groups also posted gains as the Healthcare Index ($HMO +1.30%) and Gold & Silver Index ($XAU +1.53%) rose. The Broker/Dealer Index ($XBD +0.07%) inched higher while the Bank Index ($BKX +0.56%) and Retail Index ($RLX +0.59%) posted modest gains that helped add to the session's positive bias on Friday. The tech sector saw small gains from the Internet Index ($IIX +0.60%), Semiconductor Index ($SOX +0.81%), and Biotechnology Index ($BTK +0.86%), meanwhile the Networking Index ($NWX -0.08%) lagged.
Charts courtesy www.stockcharts.com
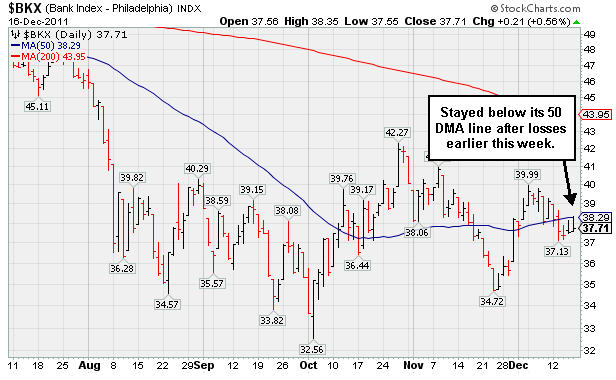
PICTURED: The influential Bank Index ($BKX +0.56%) stayed below its 50-day moving average (DMA) line after losses earlier this week.
| Oil Services |
$OSX |
210.61 |
+4.05 |
+1.96% |
-14.08% |
| Healthcare |
$HMO |
2,219.96 |
+28.59 |
+1.30% |
+31.20% |
| Integrated Oil |
$XOI |
1,170.19 |
+5.91 |
+0.51% |
-3.54% |
| Semiconductor |
$SOX |
352.86 |
+2.82 |
+0.81% |
-14.32% |
| Networking |
$NWX |
208.60 |
-0.17 |
-0.08% |
-25.65% |
| Internet |
$IIX |
275.20 |
+1.65 |
+0.60% |
-10.57% |
| Broker/Dealer |
$XBD |
80.79 |
+0.06 |
+0.07% |
-33.51% |
| Retail |
$RLX |
519.83 |
+3.04 |
+0.59% |
+2.25% |
| Gold & Silver |
$XAU |
183.33 |
+2.77 |
+1.53% |
-19.09% |
| Bank |
$BKX |
37.71 |
+0.21 |
+0.56% |
-27.77% |
| Biotech |
$BTK |
1,023.79 |
+8.71 |
+0.86% |
-21.10% |
|
|
|
 |
Hovering Near Highs Extended From Prior Base
Kenneth J. Gruneisen - Passed the CAN SLIM® Master's Exam
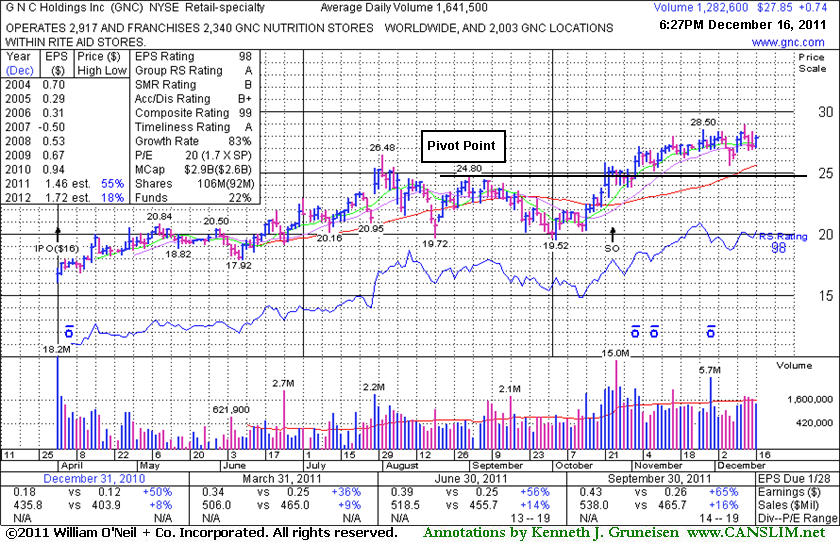
G N C Holdings Inc (GNC +$0.74 or +2.73% to $27.85) is still hovering near its all-time high today, extended from its prior base pattern. Disciplined investors do not chase extended stocks. No resistance remains due to overhead supply so it could produce more climactic gains. Prior chart highs and its 50-day moving average (DMA) line coincide in the $25 area defining important support to watch on pullbacks. Its last appearance in this FSU section was on 11/21/11 with an annotated graph under the headline, "Negative Reversal Marked Recent High Yet No Resistance Remains."
It completed a Secondary Offering on 10/15/11 and it had followed that with some volume-driven gains. It was perched near its 52-week high within striking distance of new highs (N criteria), holding its ground after volume-driven gains helped it rally from a "double bottom" base pattern formed over the prior 3 months. Its pivot point was based on its 9/01/11 high. The 10/24/11 gain with more than 4 times average volume had triggered a technical buy signal.
New institutional owners are often attracted when a company has the help of underwriters in placing shares during offerings. The number of top-rated funds owning its shares rose from 148 in June to 193 in September '11, a reassuring sign concerning the I criteria. The Retail - Specialty industry group has a Relative Strength Rating of 84, which is good news concerning the L criteria. Its strong quarterly earnings increases with accelerating sales growth and a great annual earnings history satisfies the C and A criteria and helped it earn stellar ranks.
|
|
|
Color Codes Explained :
Y - Better candidates highlighted by our
staff of experts.
G - Previously featured
in past reports as yellow but may no longer be buyable under the
guidelines.
***Last / Change / Volume data in this table is the closing quote data***
Symbol/Exchange
Company Name
Industry Group |
PRICE |
CHANGE
(%Change) |
Day High |
Volume
(% DAV)
(% 50 day avg vol) |
52 Wk Hi
% From Hi |
Featured
Date |
Price
Featured |
Pivot Featured |
|
Max Buy |
ADS
-
NYSE
Alliance Data Sys Corp
COMPUTER SOFTWARE and SERVICES - Information and Delivery Service
|
$103.00
|
+1.45
1.43% |
$103.85
|
960,381
101.10% of 50 DAV
50 DAV is 949,900
|
$107.33
-4.03%
|
10/21/2011
|
$97.94
|
PP = $101.15
|
|
MB = $106.21
|
Most Recent Note - 12/14/2011 2:40:18 PM
Y - Quietly slumping near its 50 DMA line today with a 3rd consecutive loss on light volume. A violation of that important short-term average would raise concerns.
>>> The latest Featured Stock Update with an annotated graph appeared on 12/14/2011. Click here.
View all notes |
Alert me of new notes |
CANSLIM.net Company Profile |
SEC |
Zacks Reports |
StockTalk |
News |
Chart |
Request a new note
C
A N
S L
I M


|
ALXN
-
NASDAQ
Alexion Pharmaceuticals
DRUGS - Drug Manufacturers - Other
|
$66.37
|
+2.70
4.24% |
$66.48
|
1,862,801
122.45% of 50 DAV
50 DAV is 1,521,300
|
$70.42
-5.75%
|
11/30/2011
|
$68.66
|
PP = $70.52
|
|
MB = $74.05
|
 Most Recent Note - 12/16/2011 4:35:07 PM
Y - Rallied back above its 50 DMA line today with a solid volume-driven gain helping its technical stance improve and its color code is changed to yellow. Prior lows near $62 define important near-term support to watch.
>>> The latest Featured Stock Update with an annotated graph appeared on 12/12/2011. Click here.
View all notes |
Alert me of new notes |
CANSLIM.net Company Profile |
SEC |
Zacks Reports |
StockTalk |
News |
Chart |
Request a new note
C
A N
S L
I M
|
CELG
-
NASDAQ
Celgene Corp
DRUGS - Drug Manufacturers - Major
|
$63.69
|
+0.59
0.94% |
$64.02
|
5,738,674
149.38% of 50 DAV
50 DAV is 3,841,700
|
$68.25
-6.68%
|
9/16/2011
|
$61.21
|
PP = $62.59
|
|
MB = $65.72
|
Most Recent Note - 12/15/2011 5:47:31 PM
G - Recently encountered resistance at its 50 DMA line. Gains above that short-term average would help its outlook improve, meanwhile it is -7.5% off its 52-week high. Recent lows and the 200 DMA line coincide to define the near-term chart support level near $60.
>>> The latest Featured Stock Update with an annotated graph appeared on 12/1/2011. Click here.
View all notes |
Alert me of new notes |
CANSLIM.net Company Profile |
SEC |
Zacks Reports |
StockTalk |
News |
Chart |
Request a new note
C
A N
S L
I M
|
FEIC
-
NASDAQ
F E I Co
ELECTRONICS - Diversified Electronics
|
$39.56
|
+0.92
2.38% |
$39.65
|
487,726
111.63% of 50 DAV
50 DAV is 436,900
|
$42.25
-6.37%
|
12/7/2011
|
$41.41
|
PP = $42.35
|
|
MB = $44.47
|
Most Recent Note - 12/16/2011 4:37:37 PM
Y - Perched above its 50 DMA line which defines important near-term chart support along with prior lows in the $36 area. Disciplined investors would note that a volume-driven gain above the pivot point did not trigger any recent technical buy signal.
>>> The latest Featured Stock Update with an annotated graph appeared on 11/25/2011. Click here.
View all notes |
Alert me of new notes |
CANSLIM.net Company Profile |
SEC |
Zacks Reports |
StockTalk |
News |
Chart |
Request a new note
C
A N
S L
I M
|
GNC
-
NYSE
G N C Holdings Inc
RETAIL - Drug Stores
|
$27.85
|
+0.74
2.73% |
$28.07
|
1,336,134
104.04% of 50 DAV
50 DAV is 1,284,300
|
$28.91
-3.67%
|
10/26/2011
|
$24.60
|
PP = $24.80
|
|
MB = $26.04
|
Most Recent Note - 12/16/2011 4:38:31 PM
G - Still hovering near its all-time high today, extended from its prior base pattern. Prior chart highs and its 50 DMA line coincide in the $25-26 area defining important support to watch on pullbacks.
>>> The latest Featured Stock Update with an annotated graph appeared on 12/16/2011. Click here.
View all notes |
Alert me of new notes |
CANSLIM.net Company Profile |
SEC |
Zacks Reports |
StockTalk |
News |
Chart |
Request a new note
C
A N
S L
I M
|
Symbol/Exchange
Company Name
Industry Group |
PRICE |
CHANGE
(%Change) |
Day High |
Volume
(% DAV)
(% 50 day avg vol) |
52 Wk Hi
% From Hi |
Featured
Date |
Price
Featured |
Pivot Featured |
|
Max Buy |
HMSY
-
NASDAQ
H M S Holdings Corp
COMPUTER SOFTWARE and SERVICES - Healthcare Information Service
|
$31.15
|
+0.15
0.48% |
$32.03
|
14,275,917
2,103.73% of 50 DAV
50 DAV is 678,600
|
$32.16
-3.14%
|
10/27/2011
|
$26.44
|
PP = $28.37
|
|
MB = $29.79
|
Most Recent Note - 12/16/2011 4:45:50 PM
G - Churned heavy volume today while it challenged its all-time high and completed the previously noted acquisition of HealthDataInsights, Inc. It is extended from its prior base. Prior highs in the $27-28 area acted as support during the recent pullback.
>>> The latest Featured Stock Update with an annotated graph appeared on 11/30/2011. Click here.
View all notes |
Alert me of new notes |
CANSLIM.net Company Profile |
SEC |
Zacks Reports |
StockTalk |
News |
Chart |
Request a new note
C
A N
S L
I M
|
ISRG
-
NASDAQ
Intuitive Surgical Inc
HEALTH SERVICES - Medical Appliances and Equipment
|
$432.12
|
+3.77
0.88% |
$434.14
|
333,826
80.89% of 50 DAV
50 DAV is 412,700
|
$449.06
-3.77%
|
10/19/2011
|
$424.69
|
PP = $415.29
|
|
MB = $436.05
|
Most Recent Note - 12/14/2011 5:53:19 PM
G - Sank today with volume higher (near average) while nearly testing its 50 DMA line. Prior lows in the $410 area define additional near-term support to watch. See the latest FSU analysis for more details and a new annotated graph.
>>> The latest Featured Stock Update with an annotated graph appeared on 12/13/2011. Click here.
View all notes |
Alert me of new notes |
CANSLIM.net Company Profile |
SEC |
Zacks Reports |
StockTalk |
News |
Chart |
Request a new note
C
A N
S L
I M
|
MELI
-
NASDAQ
Mercadolibre Inc
INTERNET - Internet Software and; Services
|
$84.10
|
-0.15
-0.18% |
$85.75
|
479,244
72.02% of 50 DAV
50 DAV is 665,400
|
$95.48
-11.92%
|
12/5/2011
|
$91.08
|
PP = $92.83
|
|
MB = $97.47
|
Most Recent Note - 12/16/2011 4:51:02 PM
G - Down today for a 5th consecutive loss on near average or lighter volume, slumping -11.9% off its all-time high. Color code was changed to green based on its deterioration below the pivot point cited. Disciplined investors limit losses if ever a stock falls -7% from their purchase price.
>>> The latest Featured Stock Update with an annotated graph appeared on 12/5/2011. Click here.
View all notes |
Alert me of new notes |
CANSLIM.net Company Profile |
SEC |
Zacks Reports |
StockTalk |
News |
Chart |
Request a new note
C
A N
S L
I M
|
MG
-
NYSE
Mistras Group Inc
DIVERSIFIED SERVICES - Bulding and Faci;ity Management Services
|
$23.62
|
-0.39
-1.62% |
$24.04
|
157,875
76.23% of 50 DAV
50 DAV is 207,100
|
$25.28
-6.57%
|
10/28/2011
|
$22.49
|
PP = $23.61
|
|
MB = $24.79
|
Most Recent Note - 12/15/2011 1:47:59 PM
Y - Stubbornly holding its ground since its solid gain on 12/05/11 with +55% above average volume triggered a technical buy signal. Prior highs in the $23 area define initial chart support to watch above its 50 DMA line.
>>> The latest Featured Stock Update with an annotated graph appeared on 12/8/2011. Click here.
View all notes |
Alert me of new notes |
CANSLIM.net Company Profile |
SEC |
Zacks Reports |
StockTalk |
News |
Chart |
Request a new note
C
A N
S L
I M
|
MKTX
-
NASDAQ
Marketaxess Holdings Inc
FINANCIAL SERVICES - Investment Brokerage - Nationa
|
$28.68
|
+0.42
1.49% |
$28.93
|
281,017
116.07% of 50 DAV
50 DAV is 242,100
|
$31.45
-8.81%
|
10/28/2011
|
$29.79
|
PP = $31.05
|
|
MB = $32.60
|
Most Recent Note - 12/15/2011 1:24:06 PM
Y - Considerable gain today has it rebounding above its 50 DMA line, helping its technical stance, and its color code is changed to yellow. Still facing previously stubborn resistance in the $31 area, meanwhile volume-driven gains are needed to confirm a proper buy signal.
>>> The latest Featured Stock Update with an annotated graph appeared on 11/23/2011. Click here.
View all notes |
Alert me of new notes |
CANSLIM.net Company Profile |
SEC |
Zacks Reports |
StockTalk |
News |
Chart |
Request a new note
C
A N
S L
I M
|
Symbol/Exchange
Company Name
Industry Group |
PRICE |
CHANGE
(%Change) |
Day High |
Volume
(% DAV)
(% 50 day avg vol) |
52 Wk Hi
% From Hi |
Featured
Date |
Price
Featured |
Pivot Featured |
|
Max Buy |
OSIS
-
NASDAQ
O S I Systems Inc
ELECTRONICS - Semiconductor Equipment and Mate
|
$46.10
|
-0.09
-0.19% |
$47.27
|
154,888
104.37% of 50 DAV
50 DAV is 148,400
|
$49.04
-6.00%
|
11/1/2011
|
$42.07
|
PP = $45.57
|
|
MB = $47.85
|
Most Recent Note - 12/15/2011 5:50:23 PM
Y - Posted a 2nd consecutive gain today with light volume, consolidating just above its 50 DMA line defining near-term chart support. It has made no headway since its gap gain with +44% above average volume on 11/30/11 triggered a technical buy signal.
>>> The latest Featured Stock Update with an annotated graph appeared on 11/28/2011. Click here.
View all notes |
Alert me of new notes |
CANSLIM.net Company Profile |
SEC |
Zacks Reports |
StockTalk |
News |
Chart |
Request a new note
C
A N
S L
I M
|
PRGO
-
NASDAQ
Perrigo Co
DRUGS - Drug Related Products
|
$98.18
|
+1.21
1.25% |
$99.36
|
20,700,083
2,442.49% of 50 DAV
50 DAV is 847,500
|
$101.94
-3.69%
|
12/9/2011
|
$99.54
|
PP = $101.56
|
|
MB = $106.64
|
Most Recent Note - 12/14/2011 5:59:47 PM
Y - Down today with above average volume, demonstrating action indicative of distributional pressure. Color code was changed yellow since it has formed a late-stage base, while confirming gains above its pivot point are still needed to trigger a proper new technical buy signal.
>>> The latest Featured Stock Update with an annotated graph appeared on 12/9/2011. Click here.
View all notes |
Alert me of new notes |
CANSLIM.net Company Profile |
SEC |
Zacks Reports |
StockTalk |
News |
Chart |
Request a new note
C
A N
S L
I M
|
RAX
-
NYSE
Rackspace Hosting Inc
INTERNET - Internet Software and; Services
|
$44.10
|
+0.70
1.61% |
$44.50
|
2,204,177
138.58% of 50 DAV
50 DAV is 1,590,600
|
$46.50
-5.15%
|
11/8/2011
|
$44.28
|
PP = $46.27
|
|
MB = $48.58
|
Most Recent Note - 12/14/2011 12:48:35 PM
Y - Churning near its 52-week and all-time high, making limited price progress in recent weeks. Its Relative Strength line has led the way into new high territory recently, which is recognized as a positive characteristic in buy candidates. Support to watch is at its closely coinciding 50 and 200 DMA lines. Subsequent violations would trigger damaging technical sell signals.
>>> The latest Featured Stock Update with an annotated graph appeared on 12/7/2011. Click here.
View all notes |
Alert me of new notes |
CANSLIM.net Company Profile |
SEC |
Zacks Reports |
StockTalk |
News |
Chart |
Request a new note
C
A N
S L
I M
|
SWI
-
NYSE
Solarwinds Inc
COMPUTER SOFTWARE and SERVICES - Application Software
|
$30.04
|
+0.58
1.97% |
$30.59
|
1,370,646
116.93% of 50 DAV
50 DAV is 1,172,200
|
$33.68
-10.81%
|
10/27/2011
|
$27.78
|
PP = $25.62
|
|
MB = $26.90
|
Most Recent Note - 12/16/2011 4:40:55 PM
G - Halted its slide after slumping near its 50 DMA line this week. That important short-term average was noted as initial support to watch above prior chart highs.
>>> The latest Featured Stock Update with an annotated graph appeared on 11/22/2011. Click here.
View all notes |
Alert me of new notes |
CANSLIM.net Company Profile |
SEC |
Zacks Reports |
StockTalk |
News |
Chart |
Request a new note
C
A N
S L
I M
|
TDG
-
NYSE
Transdigm Group Inc
AEROSPACE/DEFENSE - Aerospace/Defense Products and; Services
|
$95.98
|
+0.84
0.88% |
$96.12
|
331,661
80.31% of 50 DAV
50 DAV is 413,000
|
$102.73
-6.57%
|
11/9/2011
|
$98.45
|
PP = $95.14
|
|
MB = $99.90
|
Most Recent Note - 12/15/2011 5:52:56 PM
Y - Small gain today on lighter volume halted a streak of 3 consecutive losses. Its 50 DMA line defines near-term support above recent lows where subsequent violations would trigger technical sell signals.
>>> The latest Featured Stock Update with an annotated graph appeared on 12/6/2011. Click here.
View all notes |
Alert me of new notes |
CANSLIM.net Company Profile |
SEC |
Zacks Reports |
StockTalk |
News |
Chart |
Request a new note
C
A N
S L
I M
|
Symbol/Exchange
Company Name
Industry Group |
PRICE |
CHANGE
(%Change) |
Day High |
Volume
(% DAV)
(% 50 day avg vol) |
52 Wk Hi
% From Hi |
Featured
Date |
Price
Featured |
Pivot Featured |
|
Max Buy |
UA
-
NYSE
Under Armour Inc Cl A
CONSUMER NON-DURABLES - Textile - Apparel Clothing
|
$74.13
|
+0.00
0.00% |
$75.27
|
936,690
70.51% of 50 DAV
50 DAV is 1,328,400
|
$87.40
-15.18%
|
10/25/2011
|
$82.43
|
PP = $80.80
|
|
MB = $84.84
|
Most Recent Note - 12/15/2011 5:58:09 PM
G - Gain today halted a streak of 3 consecutive losses, but concerns were raised by recent trading below a prior low ($73.55 on 11/21/11) while testing important chart support at its 200 DMA line.
>>> The latest Featured Stock Update with an annotated graph appeared on 11/29/2011. Click here.
View all notes |
Alert me of new notes |
CANSLIM.net Company Profile |
SEC |
Zacks Reports |
StockTalk |
News |
Chart |
Request a new note
C
A N
S L
I M
|
ULTA
-
NASDAQ
Ulta Salon Cosm & Frag
SPECIALTY RETAIL - Specialty Retail, Other
|
$67.01
|
+0.29
0.43% |
$68.20
|
877,044
82.87% of 50 DAV
50 DAV is 1,058,400
|
$75.70
-11.48%
|
12/2/2011
|
$72.88
|
PP = $75.79
|
|
MB = $79.58
|
Most Recent Note - 12/15/2011 6:00:31 PM
G - Color code was changed to green after violating its 50 DMA line, and today it extended its losing streak with a 4th consecutive loss. Prior lows near $64 define the next important chart support level above its 200 DMA line.
>>> The latest Featured Stock Update with an annotated graph appeared on 12/2/2011. Click here.
View all notes |
Alert me of new notes |
CANSLIM.net Company Profile |
SEC |
Zacks Reports |
StockTalk |
News |
Chart |
Request a new note
C
A N
S L
I M
|
V
-
NYSE
Visa Inc Cl A
DIVERSIFIED SERVICES - Business/Management Services
|
$97.44
|
+1.62
1.69% |
$97.75
|
4,389,172
82.73% of 50 DAV
50 DAV is 5,305,100
|
$98.60
-1.18%
|
10/24/2011
|
$94.21
|
PP = $94.85
|
|
MB = $99.59
|
Most Recent Note - 12/16/2011 4:50:04 PM
Y - Up today with near average volume, finishing at its second best close of all-time. See the latest FSU analysis for more details and a new annotated graph.
>>> The latest Featured Stock Update with an annotated graph appeared on 12/15/2011. Click here.
View all notes |
Alert me of new notes |
CANSLIM.net Company Profile |
SEC |
Zacks Reports |
StockTalk |
News |
Chart |
Request a new note
C
A N
S L
I M
|
|
|
|
THESE ARE NOT BUY RECOMMENDATIONS!
Comments contained in the body of this report are technical
opinions only. The material herein has been obtained
from sources believed to be reliable and accurate, however,
its accuracy and completeness cannot be guaranteed.
This site is not an investment advisor, hence it does
not endorse or recommend any securities or other investments.
Any recommendation contained in this report may not
be suitable for all investors and it is not to be deemed
an offer or solicitation on our part with respect to
the purchase or sale of any securities. All trademarks,
service marks and trade names appearing in this report
are the property of their respective owners, and are
likewise used for identification purposes only.
This report is a service available
only to active Paid Premium Members.
You may opt-out of receiving report notifications
at any time. Questions or comments may be submitted
by writing to Premium Membership Services 665 S.E. 10 Street, Suite 201 Deerfield Beach, FL 33441-5634 or by calling 1-800-965-8307
or 954-785-1121.
|
|
|

