You are not logged in.
This means you
CAN ONLY VIEW reports that were published prior to Monday, February 26, 2024.
You
MUST UPGRADE YOUR MEMBERSHIP if you want to see any current reports.
AFTER MARKET UPDATE - TUESDAY, DECEMBER 18TH, 2018
Previous After Market Report Next After Market Report >>>
|
|
|
|
DOW |
+82.66 |
23,675.64 |
+0.35% |
|
Volume |
1,076,535,050 |
-7% |
|
Volume |
2,564,603,720 |
-3% |
|
NASDAQ |
+30.18 |
6,783.91 |
+0.45% |
|
Advancers |
1,370 |
46% |
|
Advancers |
1,277 |
41% |
|
S&P 500 |
+0.22 |
2,546.16 |
+0.01% |
|
Decliners |
1,636 |
54% |
|
Decliners |
1,830 |
59% |
|
Russell 2000 |
-0.97 |
1,377.18 |
-0.07% |
|
52 Wk Highs |
3 |
|
|
52 Wk Highs |
13 |
|
|
S&P 600 |
+1.28 |
858.86 |
+0.15% |
|
52 Wk Lows |
738 |
|
|
52 Wk Lows |
679 |
|
|
 |
Leadership Remains Thin as Major Indices Post Small Gains
Kenneth J. Gruneisen - Passed the CAN SLIM® Master's Exam
Stocks finished higher Tuesday. The Dow added 82 points to 23,675 while the S&P 500 was up less than a point to 2,546. The Nasdaq Composite advanced 30 points to 6,783. The volume totals on the session were lighter than the prior session totals on the NYSE and on the Nasdaq exchange. Advancers led decliners by an 8-7 margin on the NYSE but decliners led advancers by a 3-2 margin on the Nasdaq exchange. Leadership remained thin as for the second consecutive session there was only 1 high-ranked company from the Leaders List that made a new 52-week high and was listed on the BreakOuts Page. New 52-week lows totals solidly outnumbered new 52-week highs totals on the NYSE and on the Nasdaq exchange. As noted in prior commentaries, the major indices (M criteria) are in a correction. Disciplined investors reduce exposure to protect capital in bad markets and wait for a new rally and solid follow-through day to eventually shift the market direction (M criteria) back to a bullish stance. The Featured Stocks Page provides the most timely analysis on high-ranked leaders. Charts used courtesy of www.stockcharts.com
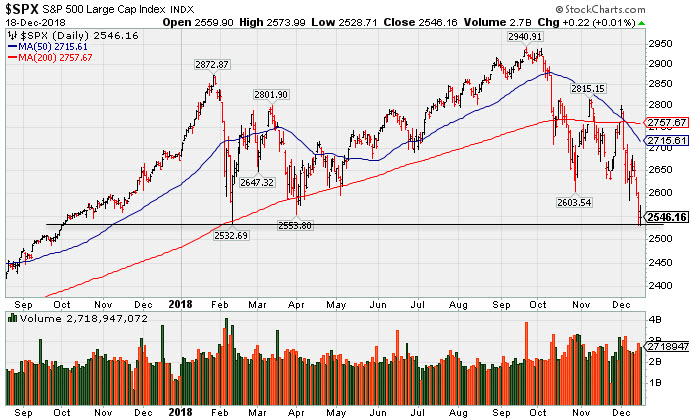
PICTURED: The S&P 500 Index fell to its lowest close since October 2, 2017. Recent rallies met resistance near its 50-day moving average (DMA) line as it formed a bearish series of lower highs and lower lows.
The major averages rebounded modestly from a 14-month low during another volatile session on Wall Street. The S&P 500 traded in a wide range during the session jumping 1.1% and falling as much as 0.7% before ending essentially unchanged. Despite today’s advance, the U.S. benchmarks remain on track to post their worst December performance since the Great Depression. The Federal Reserve garnered attention as policy makers began the first day of their final meeting of 2018. On the data front, housing starts increased 3.2% in November, well above the downwardly revised 1.6% decline in October. Separately, November building permits jumped 5.0%, beating expectations of a 0.4% drop.
Six of 11 S&P 500 sectors ended in positive territory. Consumer Discretionary led the advance as Amazon (AMZN +2.01%) rose. Technology shares also outperformed as Apple (AAPL +1.30%) rose. Energy stocks were a notable decliner in sympathy with 16-month low oil prices. Exxon Mobil (XOM -2.76%) and Chevron (CVX -2.41%) fell.
Treasuries strengthened with the yield on the 10-year note off four basis points to 2.82%. In commodities, WTI crude tumbled -7.3% to $46.24/barrel. COMEX gold added 0.1% to $1,249.20/ounce amid a weaker dollar. |
 Kenneth J. Gruneisen started out as a licensed stockbroker in August 1987, a couple of months prior to the historic stock market crash that took the Dow Jones Industrial Average down -22.6% in a single day. He has published daily fact-based fundamental and technical analysis on high-ranked stocks online for two decades. Through FACTBASEDINVESTING.COM, Kenneth provides educational articles, news, market commentary, and other information regarding proven investment systems that work in good times and bad.
Comments contained in the body of this report are technical opinions only and are not necessarily those of Gruneisen Growth Corp. The material herein has been obtained from sources believed to be reliable and accurate, however, its accuracy and completeness cannot be guaranteed. Our firm, employees, and customers may effect transactions, including transactions contrary to any recommendation herein, or have positions in the securities mentioned herein or options with respect thereto. Any recommendation contained in this report may not be suitable for all investors and it is not to be deemed an offer or solicitation on our part with respect to the purchase or sale of any securities. |
|
 |
Retail, Semiconductor, and Gold & Silver Indexes Rose
Kenneth J. Gruneisen - Passed the CAN SLIM® Master's Exam
The Retail Index ($RLX +1.38%) rose while the Broker/Dealer Index ($XBD -0%) was unchanged and the Bank Index ($BKX -1.36%) created a drag on the major indices. The tech sector had a negative bias as the Biotech Index ($BTK -1.42%) and the Networking Index ($NWX -0.52%) were lower and the Semiconductor Index ($SOX +1.28%) posted a gain. The Oil Services Index ($OSX -2.71%) and Integrated Oil Index ($XOI -2.29%) both slumped, meanwhile, the Gold & Silver Index ($XAU +2.05%) again was a standout gainer.
Charts courtesy of www.stockcharts.com
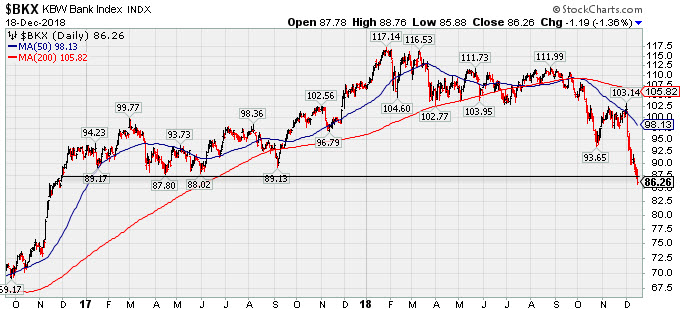 PICTURED: The Bank Index ($BKX -1.36%) met prompt resistance when rebounding near its 50-day moving average (DMA) line, and it has slumped to lows not seen since November 2016.
| Oil Services |
$OSX |
85.66 |
-2.39 |
-2.71% |
-42.72% |
| Integrated Oil |
$XOI |
1,186.72 |
-27.79 |
-2.29% |
-11.14% |
| Semiconductor |
$SOX |
1,177.36 |
+14.90 |
+1.28% |
-6.04% |
| Networking |
$NWX |
489.26 |
-2.53 |
-0.52% |
-0.26% |
| Broker/Dealer |
$XBD |
236.98 |
+0.00 |
+0.00% |
-10.66% |
| Retail |
$RLX |
1,974.31 |
+26.82 |
+1.38% |
+13.87% |
| Gold & Silver |
$XAU |
70.61 |
+1.42 |
+2.05% |
-17.19% |
| Bank |
$BKX |
86.26 |
-1.19 |
-1.36% |
-19.16% |
| Biotech |
$BTK |
4,281.59 |
-61.59 |
-1.42% |
+1.41% |
|
|
|
 |
Consolidating Above 200-Day Moving Average
Kenneth J. Gruneisen - Passed the CAN SLIM® Master's Exam
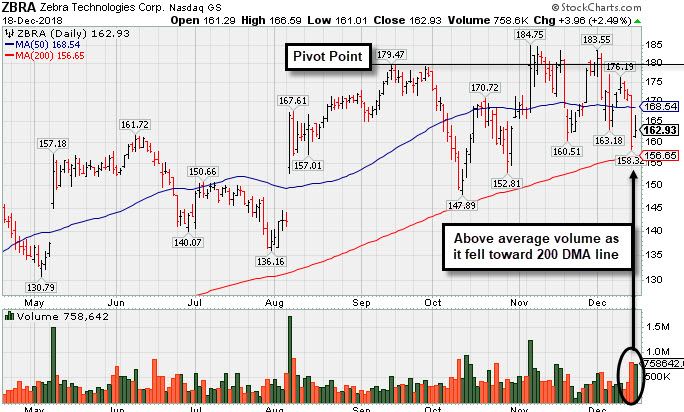
Zebra Tech Corp Cl A (ZBRA +$3.96 or +2.49% to $162.93) rebounded a little today after a slump toward its 200-day moving average (DMA) line, ending -11.8% off its all-time high. A damaging volume-driven loss on the prior session violated its 50 DMA line ($168) and undercut the recent lows triggering a technical sell signal. The 200 DMA line ($156) defines important near-term support to watch. A rebound above the 50 DMA line is needed for its outlook to improve. Concerns remain until a follow-through day confirms a new market rally (M criteria).
It reported Sep '18 earnings +54% on +17% sales revenues, continuing its strong earnings track record. Fundamentals remain strong. The past 3 quarters showed earnings increases above the +25% minimum guideline (C criteria). Recent sequential comparisons show encouraging sales revenues acceleration. Annual earnings (A criteria) history has been strong since a downturn in FY '08 and '09.
ZBRA has sputtered since last shown in this FSU section on 11/28/18 with an annotated graph under the headline, "Challenging High After Rebound Above 50-day Average". It was highlighted in yellow with pivot point cited based on its 6/08/18 high plus 10 cents in the 8/07/18 mid-day report (read here). It found support in recent months after pullbacks near its 200 DMA line.
The number of top-rated funds owning its shares from 553 in Sep '17 to 698 in Sep '18, a reassuring sign concerning the I criteria. Its current Up/Down Volume Ratio of 1.1 is an unbiased indication its shares have been under slight accumulation over the past 50 days. It has earned an A Timeliness Rating and a B Sponsorship Rating. There are 53.8 million shares outstanding (S criteria) which can contribute to greater price volatility in the event of institutional buying or selling. |
|
|
Color Codes Explained :
Y - Better candidates highlighted by our
staff of experts.
G - Previously featured
in past reports as yellow but may no longer be buyable under the
guidelines.
***Last / Change / Volume data in this table is the closing quote data***
Symbol/Exchange
Company Name
Industry Group |
PRICE |
CHANGE
(%Change) |
Day High |
Volume
(% DAV)
(% 50 day avg vol) |
52 Wk Hi
% From Hi |
Featured
Date |
Price
Featured |
Pivot Featured |
|
Max Buy |
MLR
-
NYSE
Miller Industries Inc
AUTOMOTIVE - Auto Parts
|
$27.03
|
-0.13
-0.48% |
$27.42
|
33,510
111.70% of 50 DAV
50 DAV is 30,000
|
$29.40
-8.06%
|
11/30/2018
|
$28.35
|
PP = $29.50
|
|
MB = $30.98
|
 Most Recent Note - 12/18/2018 5:26:36 PM
Y - Still sputtering since highlighted in yellow with pivot point cited based on its 8/10/18 high plus 10 cents in the 11/30/18 mid-day report. Resistance remains due to overhead supply up to the $29 level. Subsequent gains above the pivot point backed by at least +40% above average volume are needed to trigger a technical buy signal.
>>> FEATURED STOCK ARTICLE : Perched Within Striking Distance of All Time High - 12/3/2018 |
View all notes |
Set NEW NOTE alert |
Company Profile |
SEC
News |
Chart |
Request a new note
C
A
S
I |
ZBRA
-
NASDAQ
Zebra Tech Corp Cl A
COMPUTER HARDWARE - Computer Peripherals
|
$162.93
|
+3.96
2.49% |
$166.59
|
759,678
157.28% of 50 DAV
50 DAV is 483,000
|
$184.75
-11.81%
|
11/6/2018
|
$170.41
|
PP = $179.57
|
|
MB = $188.55
|
Most Recent Note - 12/18/2018 5:28:23 PM
G - Rebounded today after a slump toward its 200 DMA line. Damaging volume-driven loss on the prior session violated its 50 DMA line ($168) and undercut the recent lows triggering a technical sell signal. The 200 DMA line ($156) defines important near-term support to watch. A rebound above the 50 DMA line is needed for its outlook to improve. See the latest FSU analysis for more details and a new annotated graph.
>>> FEATURED STOCK ARTICLE : Consolidating Above 200-Day Moving Average - 12/18/2018 |
View all notes |
Set NEW NOTE alert |
Company Profile |
SEC
News |
Chart |
Request a new note
C
A
S
I |
CME
-
NASDAQ
C M E Group Inc
DIVERSIFIED SERVICES - Business/Management Services
|
$182.79
|
-2.80
-1.51% |
$187.99
|
2,126,433
94.80% of 50 DAV
50 DAV is 2,243,000
|
$197.08
-7.25%
|
10/4/2018
|
$179.29
|
PP = $177.45
|
|
MB = $186.32
|
Most Recent Note - 12/17/2018 5:50:58 PM
G - Light volume was behind today's 5th consecutive loss while testing near its 50 DMA line ($185.52) and recent low ($183.43 on 12/06/18) noted as important near-term support. Recently reported earnings +22% on +2% sales revenues for the Sep '18 quarter, below the +25% minimum earnings guideline (C criteria), raising fundamental concerns.
>>> FEATURED STOCK ARTICLE : Consolidating Above 50-Day Moving Average - 12/12/2018 |
View all notes |
Set NEW NOTE alert |
Company Profile |
SEC
News |
Chart |
Request a new note
C
A
S
I |
GDOT
-
NYSE
Green Dot Corp Cl A
FINANCIAL SERVICES - Credit Services
|
$78.60
|
+0.54
0.69% |
$79.61
|
417,485
80.75% of 50 DAV
50 DAV is 517,000
|
$93.00
-15.48%
|
11/8/2018
|
$90.35
|
PP = $91.61
|
|
MB = $96.19
|
Most Recent Note - 12/17/2018 12:40:59 PM
G - Consolidating just above its 50 DMA line ($79.08). Faces resistance due to overhead supply up to the $93 level. Its 200 DMA line and prior low ($71.50 on 10/29/18) define important near-term support.
>>> FEATURED STOCK ARTICLE : Recently Found Support Near 200-Day Average - 12/7/2018 |
View all notes |
Set NEW NOTE alert |
Company Profile |
SEC
News |
Chart |
Request a new note
C
A
S
I |
UBNT
-
NASDAQ
Ubiquiti Networks
TELECOMMUNICATIONS - Diversified Communication Serv
|
$101.92
|
-2.02
-1.94% |
$105.06
|
660,144
136.96% of 50 DAV
50 DAV is 482,000
|
$115.44
-11.71%
|
11/9/2018
|
$108.20
|
PP = $101.43
|
|
MB = $106.50
|
Most Recent Note - 12/17/2018 5:42:04 PM
Y - Pulled back below its "max buy" level with today's 3rd consecutive loss and its color code is changed to yellow. Prior high ($101.33 on 9/25/18) defines initial support to watch above its 50 DMA line ($99.28).
>>> FEATURED STOCK ARTICLE : Volume Totals Cooling While Still Hovering Above "Max Buy" Level - 12/11/2018 |
View all notes |
Set NEW NOTE alert |
Company Profile |
SEC
News |
Chart |
Request a new note
C
A
S
I |
Symbol/Exchange
Company Name
Industry Group |
PRICE |
CHANGE
(%Change) |
Day High |
Volume
(% DAV)
(% 50 day avg vol) |
52 Wk Hi
% From Hi |
Featured
Date |
Price
Featured |
Pivot Featured |
|
Max Buy |
PRAH
-
NASDAQ
P R A Health Sciences
HEALTH SERVICES - Medical Laboratories and Researc
|
$96.00
|
-0.21
-0.22% |
$97.92
|
408,445
77.21% of 50 DAV
50 DAV is 529,000
|
$121.98
-21.30%
|
11/30/2018
|
$117.06
|
PP = $112.98
|
|
MB = $118.63
|
Most Recent Note - 12/17/2018 5:39:08 PM
G - Recent losses violated its 50 and 200 DMA lines amid weak action in the broader market (M criteria). Concerns were noted after it undercut its pivot point following a "negative reversal". A rebound above the 50 DMA line is needed for its outlook to improve. See the latest FSU analysis for more details and a new annotated graph.
>>> FEATURED STOCK ARTICLE : Abrupt Retreat Amid Broadly Weak Market Conditions - 12/17/2018 |
View all notes |
Set NEW NOTE alert |
Company Profile |
SEC
News |
Chart |
Request a new note
C
A
S
I |
PLNT
-
NYSE
Planet Fitness Inc Cl A
Leisure-Services
|
$53.89
|
+0.58
1.09% |
$54.85
|
1,137,739
90.58% of 50 DAV
50 DAV is 1,256,000
|
$58.50
-7.88%
|
11/7/2018
|
$57.10
|
PP = $55.45
|
|
MB = $58.22
|
Most Recent Note - 12/18/2018 5:27:18 PM
Y - Still perched near its all-time high. Its 50 DMA line and recent low ($48.02 on 11/20/18) define important near-term support to watch on pullbacks.
>>> FEATURED STOCK ARTICLE : Fitness Firm Remains Near High Despite Unhealthy Environment - 12/14/2018 |
View all notes |
Set NEW NOTE alert |
Company Profile |
SEC
News |
Chart |
Request a new note
C
A
S
I |
MEDP
-
NASDAQ
Medpace Holdings Inc
Medical-Research Eqp/Svc
|
$50.37
|
-1.09
-2.12% |
$51.99
|
710,627
130.15% of 50 DAV
50 DAV is 546,000
|
$65.09
-22.62%
|
12/3/2018
|
$63.43
|
PP = $65.19
|
|
MB = $68.45
|
Most Recent Note - 12/17/2018 5:48:12 PM
G - Color code is changed to green after slumping below its 50 DMA line ($55.16) with damaging losses triggering a technical sell signal and raising greater concerns. The 200 DMA line and prior low define the next support to watch.
>>> FEATURED STOCK ARTICLE : Pullback After 9 Straight Gains Challenged High - 12/4/2018 |
View all notes |
Set NEW NOTE alert |
Company Profile |
SEC
News |
Chart |
Request a new note
C
A
S
I |
INVA
-
NASDAQ
Innoviva Inc
Medical-Biomed/Biotech
|
$16.59
|
-0.03
-0.18% |
$17.05
|
764,834
65.88% of 50 DAV
50 DAV is 1,161,000
|
$18.60
-10.81%
|
11/23/2018
|
$17.74
|
PP = $18.09
|
|
MB = $18.99
|
Most Recent Note - 12/18/2018 5:25:28 PM
Y - Volume totals have been cooling while consolidating above its 50 DMA line ($16.25). Subsequent gains and a strong close above the pivot point backed by at least +40% above average volume may clinch a technical buy signal.
>>> FEATURED STOCK ARTICLE : Perched Near High With Volume Totals Cooling - 12/13/2018 |
View all notes |
Set NEW NOTE alert |
Company Profile |
SEC
News |
Chart |
Request a new note
C
A
S
I |
|
|
|
THESE ARE NOT BUY RECOMMENDATIONS!
Comments contained in the body of this report are technical
opinions only. The material herein has been obtained
from sources believed to be reliable and accurate, however,
its accuracy and completeness cannot be guaranteed.
This site is not an investment advisor, hence it does
not endorse or recommend any securities or other investments.
Any recommendation contained in this report may not
be suitable for all investors and it is not to be deemed
an offer or solicitation on our part with respect to
the purchase or sale of any securities. All trademarks,
service marks and trade names appearing in this report
are the property of their respective owners, and are
likewise used for identification purposes only.
This report is a service available
only to active Paid Premium Members.
You may opt-out of receiving report notifications
at any time. Questions or comments may be submitted
by writing to Premium Membership Services 665 S.E. 10 Street, Suite 201 Deerfield Beach, FL 33441-5634 or by calling 1-800-965-8307
or 954-785-1121.
|
|
|