You are not logged in.
This means you
CAN ONLY VIEW reports that were published prior to Monday, March 24, 2025.
You
MUST UPGRADE YOUR MEMBERSHIP if you want to see any current reports.
AFTER MARKET UPDATE - TUESDAY, DECEMBER 11TH, 2018
Previous After Market Report Next After Market Report >>>
|
|
|
|
DOW |
-53.02 |
24,370.24 |
-0.22% |
|
Volume |
889,864,630 |
-12% |
|
Volume |
2,245,397,170 |
-4% |
|
NASDAQ |
+11.31 |
7,031.83 |
+0.16% |
|
Advancers |
1,345 |
45% |
|
Advancers |
1,384 |
45% |
|
S&P 500 |
-0.94 |
2,636.78 |
-0.04% |
|
Decliners |
1,649 |
55% |
|
Decliners |
1,678 |
55% |
|
Russell 2000 |
-2.96 |
1,440.13 |
-0.21% |
|
52 Wk Highs |
38 |
|
|
52 Wk Highs |
20 |
|
|
S&P 600 |
-1.32 |
897.59 |
-0.15% |
|
52 Wk Lows |
290 |
|
|
52 Wk Lows |
286 |
|
|
 |
Leadership Showed Little Improvement as Major Indices Ended Mixed
Kenneth J. Gruneisen - Passed the CAN SLIM® Master's Exam
Stocks finished mixed Tuesday. The Dow traded in a wide range, gaining as much as 360 points and falling more than 200 points before finishing down 53 points at 24,370. The S&P 500 down less than a point to 2,636 while the Nasdaq Composite added 11 points to 7,031. The volume totals on the session were lighter than the prior session totals on the NYSE and on the Nasdaq exchange. Breadth was slightly negative as decliners led advancers by an 8-7 margin on the NYSE and on the Nasdaq exchange. There were 13 high-ranked companies from the Leaders List that made new 52-week highs and were listed on the BreakOuts Page, versus 3 on the prior session. New 52-week lows totals solidly outnumbered new 52-week highs totals on the NYSE and on the Nasdaq exchange. The major indices (M criteria) are in a correction again as damaging losses violated the recent Day 1 lows. New buying efforts are not justified under the fact-based investment system's rules until a new confirmed rally is noted. The Featured Stocks Page provides the most timely analysis on high-ranked leaders. Strict buying and selling rules should always be followed on a case by case basis. Charts used courtesy of www.stockcharts.com
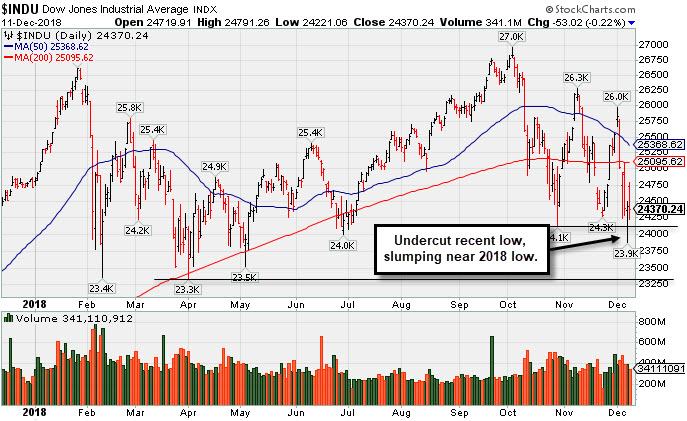
PICTURED: The Dow Jones Industrial Average slumped near its 2018 low as it undercut the recent low on Monday's session then managed a "positive reversal".
The major averages fluctuated as investors weighed political headwinds against positive trade developments. An initial market boost after Chinese officials proposed to lower tariffs on U.S. autos from 40% to 15% was offset by President Trump’s suggestion of a possible government shutdown. On the data front, small business optimism eased in November from historically high levels. A survey on inflation showed producer prices climbed 0.1% in November compared to a 0.6% gain in October. Core PPI increased 2.7% year-over-year in November after a 2.6% clip in October.
Eight of 11 S&P 500 sectors finished higher. Consumer Staples outperformed as Proctor & Gamble (PG +0.95%). Financials and Industrials lagged with Citigroup (C -1.49%) and Boeing (BA -1.32%) falling. In corporate news, General Motors (GM +0.78%) on news of reduced Chinese tariffs. Shares of Pfizer (PFE -0.88%) fell after being the subject of an analyst downgrade.
Treasuries weakened with the yield on the 10-year note up three basis points to 2.88%. In commodities, WTI crude added 1.4% to $51.72/barrel. COMEX gold lost 0.1% to $1,241.90/ounce amid a stronger dollar. |
 Kenneth J. Gruneisen started out as a licensed stockbroker in August 1987, a couple of months prior to the historic stock market crash that took the Dow Jones Industrial Average down -22.6% in a single day. He has published daily fact-based fundamental and technical analysis on high-ranked stocks online for two decades. Through FACTBASEDINVESTING.COM, Kenneth provides educational articles, news, market commentary, and other information regarding proven investment systems that work in good times and bad.
Comments contained in the body of this report are technical opinions only and are not necessarily those of Gruneisen Growth Corp. The material herein has been obtained from sources believed to be reliable and accurate, however, its accuracy and completeness cannot be guaranteed. Our firm, employees, and customers may effect transactions, including transactions contrary to any recommendation herein, or have positions in the securities mentioned herein or options with respect thereto. Any recommendation contained in this report may not be suitable for all investors and it is not to be deemed an offer or solicitation on our part with respect to the purchase or sale of any securities. |
|
 |
Tech Sector had Positive Bias and Retail Index Edged Higher
Kenneth J. Gruneisen - Passed the CAN SLIM® Master's Exam
The tech sector had a positive bias as the Semiconductor Index ($SOX +0.62%), Biotech Index ($BTK +0.23%), and the Networking Index ($NWX +0.53%) posted unanimous gains. The Retail Index ($RLX +0.11%) also posted a small gain, but the Broker/Dealer Index ($XBD -0.12%) and the Bank Index ($BKX -1.23%) suffered losses. The Gold & Silver Index ($XAU -0.46%) and Oil Services Index ($OSX -1.48%) both lost ground while the Integrated Oil Index ($XOI +0.03%) finished flat.
Charts courtesy of www.stockcharts.com
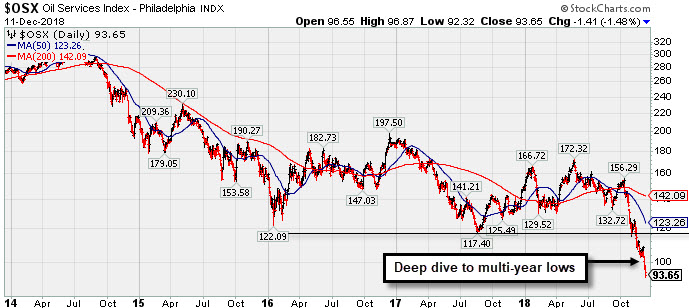 PICTURED: The 5-year chart of the Oil Services Index ($OSX -1.48%) illustrates its 2018 slump below the lows from prior years.
| Oil Services |
$OSX |
93.65 |
-1.40 |
-1.47% |
-37.38% |
| Integrated Oil |
$XOI |
1,250.79 |
+0.41 |
+0.03% |
-6.35% |
| Semiconductor |
$SOX |
1,181.48 |
+7.29 |
+0.62% |
-5.71% |
| Networking |
$NWX |
507.65 |
+2.66 |
+0.53% |
+3.49% |
| Broker/Dealer |
$XBD |
244.56 |
-0.29 |
-0.12% |
-7.80% |
| Retail |
$RLX |
2,050.99 |
+2.28 |
+0.11% |
+18.30% |
| Gold & Silver |
$XAU |
67.09 |
-0.31 |
-0.46% |
-21.32% |
| Bank |
$BKX |
90.17 |
-1.12 |
-1.23% |
-15.50% |
| Biotech |
$BTK |
4,510.81 |
+10.33 |
+0.23% |
+6.84% |
|
|
|
 |
Volume Totals Cooling While Still Hovering Above "Max Buy" Level
Kenneth J. Gruneisen - Passed the CAN SLIM® Master's Exam
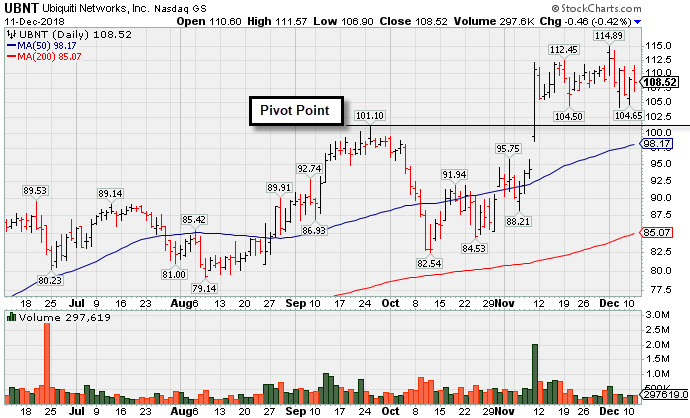
Ubiquiti Networks Inc (UBNT -$0.46 or -0.42% to $108.52) retreated from its all-time high with recent losses on lighter volume. The prior high ($101.33 on 9/25/18) defines initial support to watch on pullbacks. It quickly got extended more than +5% above the prior high and finished strong after highlighted in yellow in the 11/09/18 mid-day report with new pivot point cited based on its 9/25/18 high plus 10 cents (read here). The big gain for a new high with nearly 4 times average volume triggered a technical buy signal. It was last shown in this FSU section with an annotated graph under the headline, "Pullback Following Breakout Gain on After Latest Earnings Report". A tactical approach taught in the Certification requires investors to avoid chasing extended stocks. Disciplined investors also know to always limit losses if ever any stock falls more than 7% from their purchase price! Bullish action last week came after it reported earnings +27% on +15% sales revenues for the Sep '18 quarter, marking its 3rd consecutive quarterly comparison above the +25% minimum earnings guideline (C criteria), helping it better match the fact-based investment system's fundamental guidelines. The number of top-rated funds owning its shares rose from 262 in Dec '17 to 294 in Sep '18, a reassuring sign concerning the I criteria. Its current Up/Down Volume ratio of 0.9 is an unbiased indication its shares have been under slight distributional pressure over the past 50 days. Its small supply of only 14.9 million shares (S criteria) in the public float can contribute to greater price volatility in the event of institutional buying or selling. It has earned a B Timeliness Rating and B Sponsorship Rating. It hails from the Telecom - Infrastructure Industry Group which has an 81 Group Relative Strength Rating, a reassuring sign concerning the L criteria. After a small downturn in FY '15 its annual earnings (A criteria) growth has been strong. That fundamental shortcoming had a role in limiting its appearances since UBNT was shown in this FSU section on 4/20/12 with an annotated graph under the headline, "Formed a New Ascending Base But Did Not Confirm New Buy Signal".
Chart courtesy of www.stockcharts.com
 |
|
|
Color Codes Explained :
Y - Better candidates highlighted by our
staff of experts.
G - Previously featured
in past reports as yellow but may no longer be buyable under the
guidelines.
***Last / Change / Volume data in this table is the closing quote data***
Symbol/Exchange
Company Name
Industry Group |
PRICE |
CHANGE
(%Change) |
Day High |
Volume
(% DAV)
(% 50 day avg vol) |
52 Wk Hi
% From Hi |
Featured
Date |
Price
Featured |
Pivot Featured |
|
Max Buy |
MLR
-
NYSE
Miller Industries Inc
AUTOMOTIVE - Auto Parts
|
$27.39
|
+0.06
0.22% |
$28.26
|
14,292
49.28% of 50 DAV
50 DAV is 29,000
|
$29.40
-6.84%
|
11/30/2018
|
$28.35
|
PP = $29.50
|
|
MB = $30.98
|
Most Recent Note - 12/10/2018 1:04:20 PM
Y - Pulling back for a 4th consecutive session after trading within close striking distance of its 52-week high. Highlighted in yellow with pivot point cited based on its 8/10/18 high plus 10 cents in the 11/30/18 mid-day report. Faces little resistance due to overhead supply up to the $29 level. Subsequent gains above the pivot point backed by at least +40% above average volume are needed to trigger a technical buy signal. Reported earnings +95% on +28% sales revenues for the Sep '18 quarter. Recent quarterly comparisons have been above the +25% minimum earnings guideline (C criteria) and, sequentially, showed encouraging sales revenues acceleration. Annual earnings history (A criteria) has also been good. Very small supply of only 11.4 million shares outstanding (A criteria) can contribute to greater price volatility in the event of institutional buying or selling.
>>> FEATURED STOCK ARTICLE : Perched Within Striking Distance of All Time High - 12/3/2018 |
View all notes |
Set NEW NOTE alert |
Company Profile |
SEC
News |
Chart |
Request a new note
C
A
S
I |
ZBRA
-
NASDAQ
Zebra Tech Corp Cl A
COMPUTER HARDWARE - Computer Peripherals
|
$169.97
|
+2.10
1.25% |
$172.44
|
356,704
75.41% of 50 DAV
50 DAV is 473,000
|
$184.75
-8.00%
|
11/6/2018
|
$170.41
|
PP = $179.57
|
|
MB = $188.55
|
Most Recent Note - 12/7/2018 5:14:16 PM
G - Sank below its 50 DMA line ($169) again raising concerns and its color code is changed to green. The prior lows and 200 DMA line ($155) define important near-term support to watch.
>>> FEATURED STOCK ARTICLE : Challenging High After Rebound Above 50-day Average - 11/28/2018 |
View all notes |
Set NEW NOTE alert |
Company Profile |
SEC
News |
Chart |
Request a new note
C
A
S
I |
CME
-
NASDAQ
C M E Group Inc
DIVERSIFIED SERVICES - Business/Management Services
|
$189.51
|
-0.84
-0.44% |
$192.66
|
2,744,171
125.48% of 50 DAV
50 DAV is 2,187,000
|
$197.08
-3.84%
|
10/4/2018
|
$179.29
|
PP = $177.45
|
|
MB = $186.32
|
Most Recent Note - 12/10/2018 5:34:15 PM
G - Managed a positive reversal for a light volume gain today, ending near the session high. Perched near its all-time high, above its 50 DMA line ($184.23) and recent low ($183.43 on 12/06/18) defining important near-term support. Recently reported earnings +22% on +2% sales revenues for the Sep '18 quarter, below the +25% minimum earnings guideline (C criteria), raising fundamental concerns.
>>> FEATURED STOCK ARTICLE : Extended From Base After More Gain With Above Average Volume - 11/15/2018 |
View all notes |
Set NEW NOTE alert |
Company Profile |
SEC
News |
Chart |
Request a new note
C
A
S
I |
GDOT
-
NYSE
Green Dot Corp Cl A
FINANCIAL SERVICES - Credit Services
|
$79.55
|
+0.09
0.11% |
$81.65
|
464,010
94.89% of 50 DAV
50 DAV is 489,000
|
$93.00
-14.46%
|
11/8/2018
|
$90.35
|
PP = $91.61
|
|
MB = $96.19
|
Most Recent Note - 12/7/2018 5:12:21 PM
G - Still below its 50 DMA line. Its 200 DMA line and prior low ($71.50 on 10/29/18) define important near-term support. See the latest FSU analysis for more details and a new annotated graph.
>>> FEATURED STOCK ARTICLE : Recently Found Support Near 200-Day Average - 12/7/2018 |
View all notes |
Set NEW NOTE alert |
Company Profile |
SEC
News |
Chart |
Request a new note
C
A
S
I |
UBNT
-
NASDAQ
Ubiquiti Networks
TELECOMMUNICATIONS - Diversified Communication Serv
|
$108.52
|
-0.46
-0.42% |
$111.57
|
297,619
61.88% of 50 DAV
50 DAV is 481,000
|
$114.89
-5.54%
|
11/9/2018
|
$108.20
|
PP = $101.43
|
|
MB = $106.50
|
 Most Recent Note - 12/11/2018 6:34:19 PM
G - Volume totals have been cooling while consolidating above its "max buy" level near its all-time high. Prior high ($101.33 on 9/25/18) defines initial support to watch on pullbacks. See the latest FSU analysis for more details and a new annotated graph.
>>> FEATURED STOCK ARTICLE : Volume Totals Cooling While Still Hovering Above "Max Buy" Level - 12/11/2018 |
View all notes |
Set NEW NOTE alert |
Company Profile |
SEC
News |
Chart |
Request a new note
C
A
S
I |
Symbol/Exchange
Company Name
Industry Group |
PRICE |
CHANGE
(%Change) |
Day High |
Volume
(% DAV)
(% 50 day avg vol) |
52 Wk Hi
% From Hi |
Featured
Date |
Price
Featured |
Pivot Featured |
|
Max Buy |
PRAH
-
NASDAQ
P R A Health Sciences
HEALTH SERVICES - Medical Laboratories and Researc
|
$104.00
|
-0.90
-0.86% |
$106.76
|
436,319
83.27% of 50 DAV
50 DAV is 524,000
|
$121.98
-14.74%
|
11/30/2018
|
$117.06
|
PP = $112.98
|
|
MB = $118.63
|
Most Recent Note - 12/7/2018 5:20:19 PM
G - Color code is changed to green after a 4th consecutive loss undercut its 50 DMA line ($103.25). Undercut its pivot point after a noted "negative reversal".
>>> FEATURED STOCK ARTICLE : Streak of Gains For New Highs Marked by Increasing Volume - 11/30/2018 |
View all notes |
Set NEW NOTE alert |
Company Profile |
SEC
News |
Chart |
Request a new note
C
A
S
I |
PLNT
-
NYSE
Planet Fitness Inc Cl A
Leisure-Services
|
$53.47
|
-0.11
-0.21% |
$54.99
|
851,932
66.92% of 50 DAV
50 DAV is 1,273,000
|
$58.50
-8.60%
|
11/7/2018
|
$57.10
|
PP = $55.45
|
|
MB = $58.22
|
Most Recent Note - 12/7/2018 1:10:10 PM
Y - Pulling back further today following a "negative reversal" on 12/04/18 after it touched a new all-time high. Its 50 DMA line and recent low ($48.02 on 11/20/18) define important near-term support to watch on pullbacks.
>>> FEATURED STOCK ARTICLE : Fitness Firm Perched Near All-Time High - 11/29/2018 |
View all notes |
Set NEW NOTE alert |
Company Profile |
SEC
News |
Chart |
Request a new note
C
A
S
I |
MEDP
-
NASDAQ
Medpace Holdings Inc
Medical-Research Eqp/Svc
|
$57.69
|
-0.01
-0.02% |
$59.03
|
468,203
83.61% of 50 DAV
50 DAV is 560,000
|
$65.09
-11.37%
|
12/3/2018
|
$63.43
|
PP = $65.19
|
|
MB = $68.45
|
Most Recent Note - 12/7/2018 5:15:59 PM
Y - Pulled back today for a 3rd consecutive loss since highlighted in yellow with pivot point cited based on its 9/17/18 high plus 10 cents in the 12/03/18 mid-day report. Subsequent gains above the pivot point backed by a least +40% above average volume may trigger a technical buy signal. Reported earnings +68% on +62% sales revenues for the Sep '18 quarter marking the 3rd consecutive comparison above the +25% minimum earnings guideline (C criteria).
>>> FEATURED STOCK ARTICLE : Pullback After 9 Straight Gains Challenged High - 12/4/2018 |
View all notes |
Set NEW NOTE alert |
Company Profile |
SEC
News |
Chart |
Request a new note
C
A
S
I |
INVA
-
NASDAQ
Innoviva Inc
Medical-Biomed/Biotech
|
$17.48
|
-0.14
-0.79% |
$17.90
|
710,934
60.25% of 50 DAV
50 DAV is 1,180,000
|
$18.60
-6.02%
|
11/23/2018
|
$17.74
|
PP = $18.09
|
|
MB = $18.99
|
Most Recent Note - 12/10/2018 5:35:31 PM
Y - Still holding its ground with volume totals cooling while perched near its all-time high. Subsequent gains and a strong close above the pivot point backed by at least +40% above average volume may clinch a technical buy signal.
>>> FEATURED STOCK ARTICLE : Bullish Action in Biotech Firm With Strong Earnings History - 11/23/2018 |
View all notes |
Set NEW NOTE alert |
Company Profile |
SEC
News |
Chart |
Request a new note
C
A
S
I |
|
|
|
THESE ARE NOT BUY RECOMMENDATIONS!
Comments contained in the body of this report are technical
opinions only. The material herein has been obtained
from sources believed to be reliable and accurate, however,
its accuracy and completeness cannot be guaranteed.
This site is not an investment advisor, hence it does
not endorse or recommend any securities or other investments.
Any recommendation contained in this report may not
be suitable for all investors and it is not to be deemed
an offer or solicitation on our part with respect to
the purchase or sale of any securities. All trademarks,
service marks and trade names appearing in this report
are the property of their respective owners, and are
likewise used for identification purposes only.
This report is a service available
only to active Paid Premium Members.
You may opt-out of receiving report notifications
at any time. Questions or comments may be submitted
by writing to Premium Membership Services 665 S.E. 10 Street, Suite 201 Deerfield Beach, FL 33441-5634 or by calling 1-800-965-8307
or 954-785-1121.
|
|
|

