You are not logged in.
This means you
CAN ONLY VIEW reports that were published prior to Thursday, April 17, 2025.
You
MUST UPGRADE YOUR MEMBERSHIP if you want to see any current reports.
AFTER MARKET UPDATE - MONDAY, DECEMBER 3RD, 2018
Previous After Market Report Next After Market Report >>>
|
|
|
|
DOW |
+287.97 |
25,826.43 |
+1.13% |
|
Volume |
985,496,270 |
-35% |
|
Volume |
2,600,033,750 |
+3% |
|
NASDAQ |
+110.97 |
7,441.51 |
+1.51% |
|
Advancers |
2,205 |
74% |
|
Advancers |
2,016 |
65% |
|
S&P 500 |
+30.20 |
2,790.37 |
+1.09% |
|
Decliners |
793 |
26% |
|
Decliners |
1,073 |
35% |
|
Russell 2000 |
+15.69 |
1,548.96 |
+1.02% |
|
52 Wk Highs |
77 |
|
|
52 Wk Highs |
76 |
|
|
S&P 600 |
+6.82 |
969.77 |
+0.71% |
|
52 Wk Lows |
128 |
|
|
52 Wk Lows |
94 |
|
|
 |
Major Indices Rallied in Response to Easing Geopolitical Tensions
Kenneth J. Gruneisen - Passed the CAN SLIM® Master's Exam
Stocks finished higher Monday. The Dow added 287 points to 25826 while the S&P 500 advanced 30 points to 2790. The Nasdaq Composite gained 110 points to 7441. The volume totals on the session were mixed, lighter than the prior session total on the NYSE and higher on the Nasdaq exchange. Breadth was positive as advancers led decliners by almost a 3-1 margin on the NYSE and nearly 2-1 on the Nasdaq exchange. There were 49 high-ranked companies from the Leaders List that made new 52-week highs and were listed on the BreakOuts Page, versus 30 on the prior session. New 52-week lows totals still solidly outnumbered new 52-week highs totals on the NYSE and on the Nasdaq exchange. Technically, the +1.5% gain for the Nasdaq Composite Index marked a follow-through day confirming a new rally for the major indices (M criteria). New buying efforts are justified under the fact-based investment system's rules only in stocks meeting all of the key fundamental and technical criteria. The Featured Stocks Page provides the most timely analysis on high-ranked leaders. Strict buying and selling rules should always be followed on a case by case basis. Charts used courtesy of www.stockcharts.com
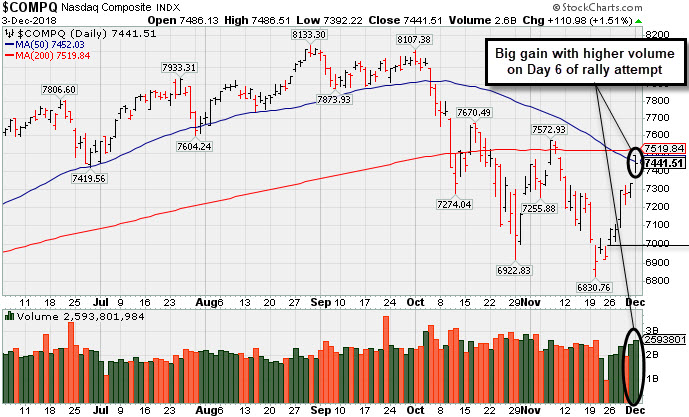
PICTURED: The Nasdaq Composite Index rose +1.51% on Monday with a gain on higher volume marking Day 6 of the new rally attempt. Disciplined investors may recognize the bullish action between Day 4 and Day 7 of the rally attempt as a follow-through day of big gains (+1% or more) from at least one major average, with higher volume, and coupled with a leadership expansion.
The major averages climbed as easing geopolitical tensions provided a boost to investor sentiment. Over the weekend, U.S. President Trump and Chinese Premier Xi agreed to hold off on any additional tariffs for 90-days as they work to secure a new trade agreement. On the data front, an update from the Institute for Supply Management (ISM) revealed manufacturing activity accelerated more than expected in November. Meanwhile, construction spending unexpectedly decreased month-over-month in October, for its third consecutive decline.
President Trump declared Wednesday a national day of mourning for former President George Herbert Walker Bush, who died Friday at the age of 94. The companies that run the New York Stock Exchange and the Nasdaq Stock Market both said their markets would be closed on Wednesday.
Ten of 11 S&P 500 sectors ended in positive territory with Energy and Consumer Discretionary stocks pacing gains. Shares of Exxon Mobil (XOM +2.18%) and Amazon (AMZN +4.86%) rose. The Technology and Industrial groups also outperformed with Apple (AAPL +3.49%) and Caterpillar (CAT +2.42%) rising. Consumer Staples was the lone laggard with PepsiCo (PEP -2.43%) down. In M&A news, GlaxoSmithKline (GSK -7.79%) fell after announcing it reached a deal to acquire biotech company Tesaro (TSRO +58.47%) for $5.1 billion.
Treasuries were mixed along the curve with the yield on the 10-year note down three basis points to 2.98%. In commodities, WTI crude added 4.4% to $53.15/barrel. COMEX gold gained 0.8% to $1,229.70/ounce amid a weaker dollar. |
 Kenneth J. Gruneisen started out as a licensed stockbroker in August 1987, a couple of months prior to the historic stock market crash that took the Dow Jones Industrial Average down -22.6% in a single day. He has published daily fact-based fundamental and technical analysis on high-ranked stocks online for two decades. Through FACTBASEDINVESTING.COM, Kenneth provides educational articles, news, market commentary, and other information regarding proven investment systems that work in good times and bad.
Comments contained in the body of this report are technical opinions only and are not necessarily those of Gruneisen Growth Corp. The material herein has been obtained from sources believed to be reliable and accurate, however, its accuracy and completeness cannot be guaranteed. Our firm, employees, and customers may effect transactions, including transactions contrary to any recommendation herein, or have positions in the securities mentioned herein or options with respect thereto. Any recommendation contained in this report may not be suitable for all investors and it is not to be deemed an offer or solicitation on our part with respect to the purchase or sale of any securities. |
|
 |
Retail, Tech, Financial, and Commodity-Linked Groups Rose
Kenneth J. Gruneisen - Passed the CAN SLIM® Master's Exam
The Retail Index ($RLX +2.61%) outpaced the Broker/Dealer Index ($XBD +0.53%) and the Bank Index ($BKX +0.13%). The tech sector also had a positive bias as the Semiconductor Index ($SOX +2.67%) outpaced the Networking Index ($NWX +1.57%) and the Biotech Index ($BTK +1.18%). Commodity-linked groups also had a positive bias as the Oil Services Index ($OSX +3.45%), Integrated Oil Index ($XOI +2.50%) and Gold & Silver Index ($XAU +2.14%) each posted a solid gain.
Charts courtesy of www.stockcharts.com
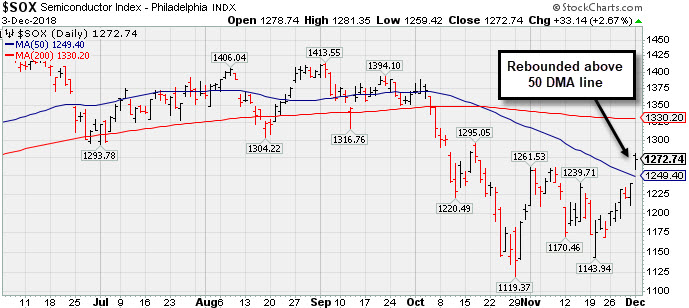 PICTURED: The Broker/Dealer Index ($XBD +0.64%) has been sputtering below its 50-day moving average (DMA) line yet it up from its October low.
| Oil Services |
$OSX |
108.36 |
+3.62 |
+3.46% |
-27.54% |
| Integrated Oil |
$XOI |
1,335.56 |
+32.52 |
+2.50% |
+0.00% |
| Semiconductor |
$SOX |
1,272.74 |
+33.14 |
+2.67% |
+1.57% |
| Networking |
$NWX |
523.61 |
+8.11 |
+1.57% |
+6.74% |
| Broker/Dealer |
$XBD |
263.87 |
+1.38 |
+0.53% |
-0.52% |
| Retail |
$RLX |
2,186.19 |
+55.60 |
+2.61% |
+26.09% |
| Gold & Silver |
$XAU |
65.84 |
+1.38 |
+2.14% |
-22.79% |
| Bank |
$BKX |
101.70 |
+0.13 |
+0.13% |
-4.69% |
| Biotech |
$BTK |
4,811.58 |
+56.03 |
+1.18% |
+13.96% |
|
|
|
 |
Perched Within Striking Distance of All Time High
Kenneth J. Gruneisen - Passed the CAN SLIM® Master's Exam
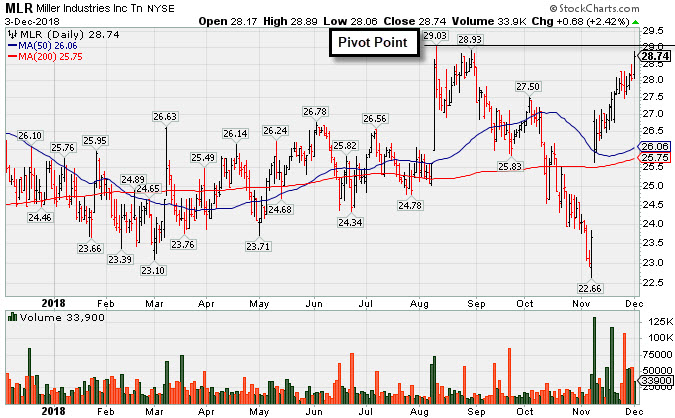
Miller Industries Inc (MLR +$0.68 or +2.42% to $28.74) posted a gain today on lighter (but above average) volume. It encountered distributional pressure and finished lower after highlighted in yellow with pivot point cited based on its 8/10/18 high plus 10 cents in the 11/30/18 mid-day report (read here). It faces very little resistance due to overhead supply up to the $29 level. Subsequent gains above the pivot point backed by at least +40% above average volume are needed to trigger a technical buy signal.
Reported earnings +95% on +28% sales revenues for the Sep '18 quarter. Recent quarterly comparisons have been above the +25% minimum earnings guideline (C criteria) and, sequentially, showed encouraging sales revenues acceleration. Annual earnings history (A criteria) has also been good. Very small supply of only 11.4 million shares outstanding (A criteria) can contribute to greater price volatility in the event of institutional buying or selling.
The number of top-rated funds owning its shares rose from 196 in Mar '18 to 216 in Sep '18, a reassuring sign. The current Up/Down Volume Ratio of 1.2 is an unbiased indication its shares have been under accumulation over the past 50 days. It has earned an A Timeliness rating and a B Sponsorship Rating.
Charts courtesy of www.stockcharts.com
 |
|
|
Color Codes Explained :
Y - Better candidates highlighted by our
staff of experts.
G - Previously featured
in past reports as yellow but may no longer be buyable under the
guidelines.
***Last / Change / Volume data in this table is the closing quote data***
Symbol/Exchange
Company Name
Industry Group |
PRICE |
CHANGE
(%Change) |
Day High |
Volume
(% DAV)
(% 50 day avg vol) |
52 Wk Hi
% From Hi |
Featured
Date |
Price
Featured |
Pivot Featured |
|
Max Buy |
MLR
-
NYSE
Miller Industries Inc
AUTOMOTIVE - Auto Parts
|
$28.74
|
+0.68
2.42% |
$28.89
|
33,900
121.07% of 50 DAV
50 DAV is 28,000
|
$29.40
-2.24%
|
11/30/2018
|
$28.35
|
PP = $29.50
|
|
MB = $30.98
|
 Most Recent Note - 12/3/2018 5:32:46 PM
Y - Posted a gain today with above average volume. Highlighted in yellow with pivot point cited based on its 8/10/18 high plus 10 cents in the 11/30/18 mid-day report. Faces little resistance due to overhead supply up to the $29 level. Subsequent gains above the pivot point backed by at least +40% above average volume are needed to trigger a technical buy signal. Reported earnings +95% on +28% sales revenues for the Sep '18 quarter. Recent quarterly comparisons have been above the +25% minimum earnings guideline (C criteria) and, sequentially, showed encouraging sales revenues acceleration. Annual earnings history (A criteria) has also been good. Very small supply of only 11.4 million shares outstanding (A criteria) can contribute to greater price volatility in the event of institutional buying or selling. See the latest FSU analysis for more details and a new annotated graph.
>>> FEATURED STOCK ARTICLE : Perched Within Striking Distance of All Time High - 12/3/2018 |
View all notes |
Set NEW NOTE alert |
Company Profile |
SEC
News |
Chart |
Request a new note
C
A
S
I |
MPX
-
NYSE
Marine Products Corp
AUTOMOTIVE - Recreational Vehicles
|
$22.32
|
+0.58
2.67% |
$22.46
|
22,892
49.77% of 50 DAV
50 DAV is 46,000
|
$24.82
-10.07%
|
10/24/2018
|
$23.00
|
PP = $24.92
|
|
MB = $26.17
|
Most Recent Note - 11/30/2018 4:55:18 PM
G - Still sputtering above the recent low ($20.25 on 10/26/18) previously noted as important near-term support. A rebound above the 50 DMA line ($22.08) is needed for its outlook to improve. Subsequent gains above the pivot point backed by at least +40% above average volume may trigger a technical buy signal.
>>> FEATURED STOCK ARTICLE : Perched Within Striking Distance of Pivot Point - 11/13/2018 |
View all notes |
Set NEW NOTE alert |
Company Profile |
SEC
News |
Chart |
Request a new note
C
A
S
I |
ZBRA
-
NASDAQ
Zebra Tech Corp Cl A
COMPUTER HARDWARE - Computer Peripherals
|
$181.37
|
+1.57
0.87% |
$183.55
|
575,482
123.76% of 50 DAV
50 DAV is 465,000
|
$184.75
-1.83%
|
11/6/2018
|
$170.41
|
PP = $179.57
|
|
MB = $188.55
|
Most Recent Note - 11/28/2018 5:12:57 PM
Y - Color code is changed to yellow after rebounding above its 50 DMA line ($169). The prior lows and 200 DMA line ($154) define important near-term support to watch. See the latest FSU analysis for more details and a new annotated graph.
>>> FEATURED STOCK ARTICLE : Challenging High After Rebound Above 50-day Average - 11/28/2018 |
View all notes |
Set NEW NOTE alert |
Company Profile |
SEC
News |
Chart |
Request a new note
C
A
S
I |
CME
-
NASDAQ
C M E Group Inc
DIVERSIFIED SERVICES - Business/Management Services
|
$188.11
|
-1.97
-1.04% |
$191.96
|
2,560,442
122.22% of 50 DAV
50 DAV is 2,095,000
|
$197.08
-4.55%
|
10/4/2018
|
$179.29
|
PP = $177.45
|
|
MB = $186.32
|
Most Recent Note - 11/28/2018 5:17:11 PM
G - Encountering distributional pressure while pulling back from its all-time high. Its 50 DMA line ($182.12) defines near-term support. Strength continued after reporting earnings +22% on +2% sales revenues for the Sep '18 quarter, below the +25% minimum earnings guideline (C criteria), raising fundamental concerns.
>>> FEATURED STOCK ARTICLE : Extended From Base After More Gain With Above Average Volume - 11/15/2018 |
View all notes |
Set NEW NOTE alert |
Company Profile |
SEC
News |
Chart |
Request a new note
C
A
S
I |
GDOT
-
NYSE
Green Dot Corp Cl A
FINANCIAL SERVICES - Credit Services
|
$83.54
|
+0.20
0.24% |
$85.65
|
372,126
79.34% of 50 DAV
50 DAV is 469,000
|
$93.00
-10.17%
|
11/8/2018
|
$90.35
|
PP = $91.61
|
|
MB = $96.19
|
Most Recent Note - 11/30/2018 4:56:35 PM
G - Posted another gain above its 50 DMA line ($80.44) today with higher (above average) volume but it has not formed a sound base. Its 200 DMA line and prior low ($71.50 on 10/29/18) define important near-term support.
>>> FEATURED STOCK ARTICLE : Volume Heavy Behind Rally to New High - 11/8/2018 |
View all notes |
Set NEW NOTE alert |
Company Profile |
SEC
News |
Chart |
Request a new note
C
A
S
I |
Symbol/Exchange
Company Name
Industry Group |
PRICE |
CHANGE
(%Change) |
Day High |
Volume
(% DAV)
(% 50 day avg vol) |
52 Wk Hi
% From Hi |
Featured
Date |
Price
Featured |
Pivot Featured |
|
Max Buy |
ULTA
-
NASDAQ
Ulta Beauty Inc
SPECIALTY RETAIL - Specialty Retail, Other
|
$306.49
|
+8.70
2.92% |
$311.30
|
1,345,827
141.67% of 50 DAV
50 DAV is 950,000
|
$322.49
-4.96%
|
11/8/2018
|
$296.36
|
PP = $290.40
|
|
MB = $304.92
|
Most Recent Note - 12/3/2018 5:36:21 PM
G - Posted a big gain today with above average volume and its color code is changed to green after rising back above its "max buy" level. Prior high ($290) defines initial support to watch above its 50 DMA line ($286.73).
>>> FEATURED STOCK ARTICLE : Volume Driven Gains Indicate Institutional Buying Demand - 11/9/2018 |
View all notes |
Set NEW NOTE alert |
Company Profile |
SEC
News |
Chart |
Request a new note
C
A
S
I |
UBNT
-
NASDAQ
Ubiquiti Networks Inc
TELECOMMUNICATIONS - Diversified Communication Serv
|
$112.80
|
+3.82
3.51% |
$114.89
|
590,077
121.67% of 50 DAV
50 DAV is 485,000
|
$112.45
0.31%
|
11/9/2018
|
$108.20
|
PP = $101.43
|
|
MB = $106.50
|
Most Recent Note - 12/3/2018 5:33:59 PM
G - Posted a gain today with above average volume for a new all-time high. Prior high ($101.33 on 9/25/18) defines initial support to watch on pullbacks.
>>> FEATURED STOCK ARTICLE : Pullback Following Breakout Gain on After Latest Earnings Report - 11/12/2018 |
View all notes |
Set NEW NOTE alert |
Company Profile |
SEC
News |
Chart |
Request a new note
C
A
S
I |
PRAH
-
NASDAQ
P R A Health Sciences
HEALTH SERVICES - Medical Laboratories and Researc
|
$116.11
|
-0.63
-0.54% |
$121.98
|
745,906
150.08% of 50 DAV
50 DAV is 497,000
|
$119.03
-2.45%
|
11/30/2018
|
$117.06
|
PP = $112.98
|
|
MB = $118.63
|
Most Recent Note - 12/3/2018 1:16:43 PM
Y - Hit another new high and traded above its "max buy" level earlier in the session. Highlighted in yellow with pivot point cited based on its 9/14/18 high plus 10 cents in the 11/30/18 mid-day report. Technically, it triggered a technical buy signal on 11/29/18 with a gain backed by +103% above average volume. Early bullish action has today's session looking like a follow-through day, but a weak finish could be a sign of distributional pressure. New buying efforts in all stocks are discouraged under the fact-based investment system until a new confirmed market rally (M criteria) is noted.
>>> FEATURED STOCK ARTICLE : Streak of Gains For New Highs Marked by Increasing Volume - 11/30/2018 |
View all notes |
Set NEW NOTE alert |
Company Profile |
SEC
News |
Chart |
Request a new note
C
A
S
I |
HQY
-
NASDAQ
Healthequity Inc
COMPUTER SOFTWARE and SERVICES - Healthcare Information Service
|
$89.71
|
+1.02
1.15% |
$91.79
|
1,032,351
150.49% of 50 DAV
50 DAV is 686,000
|
$101.58
-11.69%
|
11/2/2018
|
$95.56
|
PP = $100.09
|
|
MB = $105.09
|
Most Recent Note - 11/28/2018 5:15:34 PM
G - Tallied a big gain today with higher (near average) volume. Found support near its 200 DMA line after a damaging loss violated the prior low ($80.56 on 10/24/18). A rebound above the 50 DMA line ($88.25) is needed for its outlook to improve. See the latest FSU analysis for more details and an annotated graph.
>>> FEATURED STOCK ARTICLE : Found Support at 200-Day Average But Faces Overhead Supply - 11/26/2018 |
View all notes |
Set NEW NOTE alert |
Company Profile |
SEC
News |
Chart |
Request a new note
C
A
S
I |
OLLI
-
NASDAQ
Ollie's Bargain Outlet
Retail-DiscountandVariety
|
$91.23
|
+2.53
2.85% |
$91.60
|
709,341
107.15% of 50 DAV
50 DAV is 662,000
|
$97.61
-6.54%
|
11/16/2018
|
$90.70
|
PP = $97.71
|
|
MB = $102.60
|
Most Recent Note - 11/28/2018 5:25:53 PM
G - Posted a big gain today with near average volume as it rebounded near its 50 DMA line ($90.31) helping its outlook to improve. Faces near term resistance due to overhead supply up to the $97 level.
>>> FEATURED STOCK ARTICLE : Consolidating Near 50-Day Average Forming New Base - 11/16/2018 |
View all notes |
Set NEW NOTE alert |
Company Profile |
SEC
News |
Chart |
Request a new note
C
A
S
I |
Symbol/Exchange
Company Name
Industry Group |
PRICE |
CHANGE
(%Change) |
Day High |
Volume
(% DAV)
(% 50 day avg vol) |
52 Wk Hi
% From Hi |
Featured
Date |
Price
Featured |
Pivot Featured |
|
Max Buy |
PLNT
-
NYSE
Planet Fitness Inc Cl A
Leisure-Services
|
$56.88
|
+1.66
3.01% |
$57.39
|
795,793
59.43% of 50 DAV
50 DAV is 1,339,000
|
$57.66
-1.35%
|
11/7/2018
|
$57.10
|
PP = $55.45
|
|
MB = $58.22
|
Most Recent Note - 11/29/2018 6:12:37 PM
Y - Remains perched at its all-time high. Its 50 DMA line and recent low ($48.02 on 11/20/18) define important near-term support to watch on pullbacks. See the latest FSU analysis for more details and a new annotated graph,
>>> FEATURED STOCK ARTICLE : Fitness Firm Perched Near All-Time High - 11/29/2018 |
View all notes |
Set NEW NOTE alert |
Company Profile |
SEC
News |
Chart |
Request a new note
C
A
S
I |
MEDP
-
NASDAQ
Medpace Holdings Inc
Medical-Research Eqp/Svc
|
$63.98
|
+2.07
3.34% |
$64.94
|
771,528
136.07% of 50 DAV
50 DAV is 567,000
|
$65.09
-1.71%
|
12/3/2018
|
$63.43
|
PP = $65.19
|
|
MB = $68.45
|
Most Recent Note - 12/3/2018 1:02:08 PM
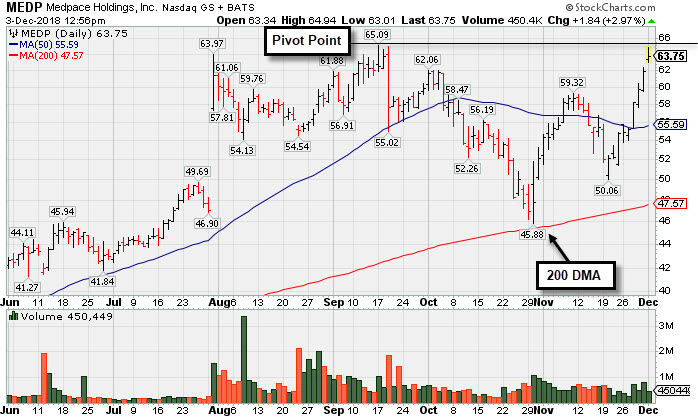
Y - Color code is changed to yellow with pivot point cited based on its 9/17/18 high plus 10 cents. Subsequent gains above the pivot point backed by a least +40% above average volume may trigger a technical buy signal. Challenging its all-time high with today's 9th consecutive gain. Reported earnings +68% on +62% sales revenues for the Sep '18 quarter marking the 3rd consecutive comparison above the +25% minimum earnings guideline (C criteria). Found support at its 200 DMA line during the consolidation since last noted in the 9/19/18 - "Proposed yet another Secondary Offering on 8/07/18. Completed Secondary Offerings on 6/12/18, 5/04/18, and 12/01/17. "
 There are no Featured Stock Updates™ available for this stock at this time. You may request one by clicking the Request a New Note link below |
View all notes |
Set NEW NOTE alert |
Company Profile |
SEC
News |
Chart |
Request a new note
C
A
S
I
There are no Featured Stock Updates™ available for this stock at this time. You may request one by clicking the Request a New Note link below |
View all notes |
Set NEW NOTE alert |
Company Profile |
SEC
News |
Chart |
Request a new note
C
A
S
I |
INVA
-
NASDAQ
Innoviva Inc
Medical-Biomed/Biotech
|
$18.12
|
-0.14
-0.77% |
$18.60
|
1,762,338
154.59% of 50 DAV
50 DAV is 1,140,000
|
$18.36
-1.32%
|
11/23/2018
|
$17.74
|
PP = $18.09
|
|
MB = $18.99
|
Most Recent Note - 11/30/2018 5:00:37 PM
Y - Posted a gain today for a new high close but volume was only +15% above average. Subsequent gain and a strong close above the pivot point backed by at least +40% above average volume may clinch a technical buy signal. However, new buying efforts in all stocks are discouraged under the fact-based investment system until a new confirmed market rally (M criteria) is noted.
>>> FEATURED STOCK ARTICLE : Bullish Action in Biotech Firm With Strong Earnings History - 11/23/2018 |
View all notes |
Set NEW NOTE alert |
Company Profile |
SEC
News |
Chart |
Request a new note
C
A
S
I |
|
|
|
THESE ARE NOT BUY RECOMMENDATIONS!
Comments contained in the body of this report are technical
opinions only. The material herein has been obtained
from sources believed to be reliable and accurate, however,
its accuracy and completeness cannot be guaranteed.
This site is not an investment advisor, hence it does
not endorse or recommend any securities or other investments.
Any recommendation contained in this report may not
be suitable for all investors and it is not to be deemed
an offer or solicitation on our part with respect to
the purchase or sale of any securities. All trademarks,
service marks and trade names appearing in this report
are the property of their respective owners, and are
likewise used for identification purposes only.
This report is a service available
only to active Paid Premium Members.
You may opt-out of receiving report notifications
at any time. Questions or comments may be submitted
by writing to Premium Membership Services 665 S.E. 10 Street, Suite 201 Deerfield Beach, FL 33441-5634 or by calling 1-800-965-8307
or 954-785-1121.
|
|
|

