You are not logged in.
This means you
CAN ONLY VIEW reports that were published prior to Monday, April 14, 2025.
You
MUST UPGRADE YOUR MEMBERSHIP if you want to see any current reports.
AFTER MARKET UPDATE - THURSDAY, DECEMBER 15TH, 2011
Previous After Market Report Next After Market Report >>>
|
|
|
|
DOW |
+45.33 |
11,868.81 |
+0.38% |
|
Volume |
869,915,330 |
-6% |
|
Volume |
1,696,655,370 |
-3% |
|
NASDAQ |
+1.70 |
2,541.01 |
+0.07% |
|
Advancers |
1,850 |
60% |
|
Advancers |
1,462 |
55% |
|
S&P 500 |
+3.94 |
1,215.76 |
+0.33% |
|
Decliners |
1,129 |
36% |
|
Decliners |
1,070 |
40% |
|
Russell 2000 |
+7.55 |
716.01 |
+1.07% |
|
52 Wk Highs |
49 |
|
|
52 Wk Highs |
23 |
|
|
S&P 600 |
+5.30 |
400.47 |
+1.34% |
|
52 Wk Lows |
64 |
|
|
52 Wk Lows |
113 |
|
|
 |
Major Averages Posted Small Gains With Lighter Volume
Kenneth J. Gruneisen - Passed the CAN SLIM® Master's Exam
The major averages finished in positive territory snapping three days of losses. The volume totals were lighter on the NYSE and on the Nasdaq exchange versus Wednesday's session totals, whereas gains on higher volume would be a more reassuring sign of buying demand from the institutional crowd. Advancers led decliners by almost 3-2 on the NYSE and by 7-5 on the Nasdaq exchange. New 52-week lows outnumbered new 52-week highs on the NYSE and on the Nasdaq exchange. There were 10 high-ranked companies from the CANSLIM.net Leaders List that made new 52-week highs and appeared on the CANSLIM.net BreakOuts Page, up from the prior session total of 4 stocks. There were gains for 13 of the 18 high-ranked companies currently included on the Featured Stocks Page.
Positive U.S. economic data drove the session’s gains as weekly jobless claims hit a three and a half year low. November PPI beat consensus estimates while the Empire Manufacturing Index and Philly Fed Index also topped expectations.
Healthcare stocks were among the session's leaders as Merck & Co (MRK +2.25%) and Pfizer inc (PFE +1.34%) posted gains. Global shipper Fedex Corp (FDX +8.0%) jumped after posting a positive earnings tally. Luxury apparel maker Michael Kors Holdings (KORS +21.00%) impressed in its debut. Shares of Green Mountain Coffee Roasters (GMCR -7.06%) continued to be under pressure on concerns of slowing demand for their Keurig brewing systems. Diamond Foods Inc (DMND -5.56%) fell after the SEC notified the company that they were planning an investigation.
Treasuries were lower on the day with the 10-year note down a tick to yield 1.91% Commodities modestly extended their recent declines. West Texas crude fell $1.45 to $93.50 per barrel and Comex gold lost $9.70 to $1,574.60 an ounce. In the FX markets, the Euro pared Wednesday's slide with the Euro-dollar cross at 1.3008.
Our monthly newsletter CANSLIM.net News will be published soon with an informative review of current market conditions, leading groups, and best buy candidates. Via the Premium Member Homepage links to all prior reports and webcasts are always available.
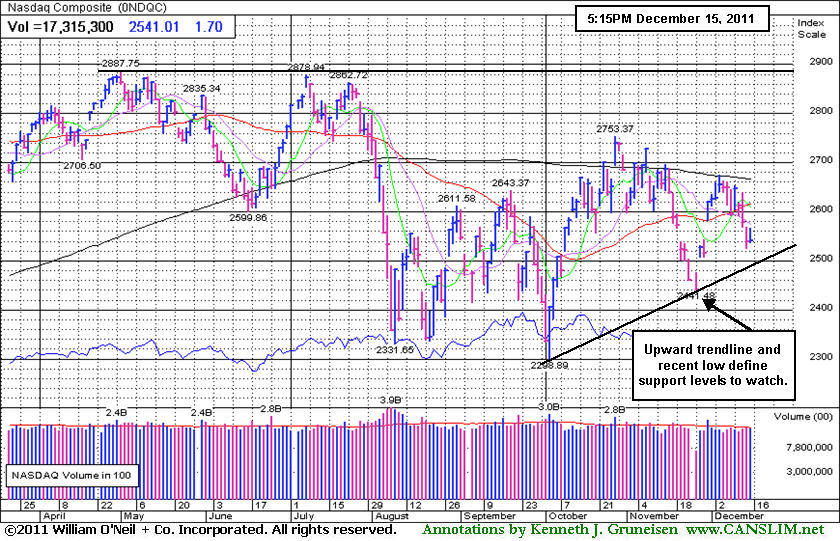
PICTURED: The Nasdaq Composite Index is slumping toward an upward trendline connecting prior lows that define support levels to watch. Deterioration below those levels obviously would bring more technical damage and hurt the market outlook.
|
 Kenneth J. Gruneisen started out as a licensed stockbroker in August 1987, a couple of months prior to the historic stock market crash that took the Dow Jones Industrial Average down -22.6% in a single day. He has published daily fact-based fundamental and technical analysis on high-ranked stocks online for two decades. Through FACTBASEDINVESTING.COM, Kenneth provides educational articles, news, market commentary, and other information regarding proven investment systems that work in good times and bad.
Comments contained in the body of this report are technical opinions only and are not necessarily those of Gruneisen Growth Corp. The material herein has been obtained from sources believed to be reliable and accurate, however, its accuracy and completeness cannot be guaranteed. Our firm, employees, and customers may effect transactions, including transactions contrary to any recommendation herein, or have positions in the securities mentioned herein or options with respect thereto. Any recommendation contained in this report may not be suitable for all investors and it is not to be deemed an offer or solicitation on our part with respect to the purchase or sale of any securities. |
|
 |
Healthcare Group Led Positive Groups With Small Gain
Kenneth J. Gruneisen - Passed the CAN SLIM® Master's Exam
The Healthcare Index ($HMO +1.13%) was Thursday's standout gainer among the industry indexes regularly followed in this commentary. The Retail Index ($RLX +0.28%) and Bank Index ($BKX +0.29%) posted small gains while the Broker/Dealer Index ($XBD -0.54%) ended lower. Energy-related shares also drifted lower as the Oil Services Index ($OSX -1.37%) fell, yet the Integrated Oil Index ($XOI -0.06%) finished flat. The tech sector also saw modest losses from the Biotechnology Index ($BTK -0.67%), Networking Index ($NWX -0.41%), and the Semiconductor Index ($SOX -0.20%) while the Internet Index ($IIX +0.35%) closed with a small gain.
Charts courtesy www.stockcharts.com
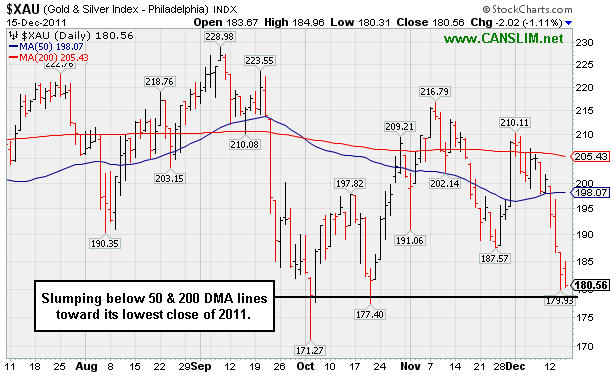
PICTURED: The Gold & Silver Index ($XAU -1.11%) is slumping well below both its 50-day and 200-day moving average lines toward its lowest close of 2011.
| Oil Services |
$OSX |
206.56 |
-2.87 |
-1.37% |
-15.73% |
| Healthcare |
$HMO |
2,191.37 |
+24.44 |
+1.13% |
+29.51% |
| Integrated Oil |
$XOI |
1,164.28 |
-0.75 |
-0.06% |
-4.03% |
| Semiconductor |
$SOX |
350.04 |
-0.69 |
-0.20% |
-15.00% |
| Networking |
$NWX |
208.77 |
-0.86 |
-0.41% |
-25.59% |
| Internet |
$IIX |
273.55 |
+0.97 |
+0.35% |
-11.11% |
| Broker/Dealer |
$XBD |
80.73 |
-0.44 |
-0.54% |
-33.56% |
| Retail |
$RLX |
516.79 |
+1.46 |
+0.28% |
+1.65% |
| Gold & Silver |
$XAU |
180.56 |
-2.02 |
-1.11% |
-20.31% |
| Bank |
$BKX |
37.50 |
+0.11 |
+0.29% |
-28.17% |
| Biotech |
$BTK |
1,015.08 |
-6.81 |
-0.67% |
-21.77% |
|
|
|
 |
Distributional Action After Making Limited Progress
Kenneth J. Gruneisen - Passed the CAN SLIM® Master's Exam
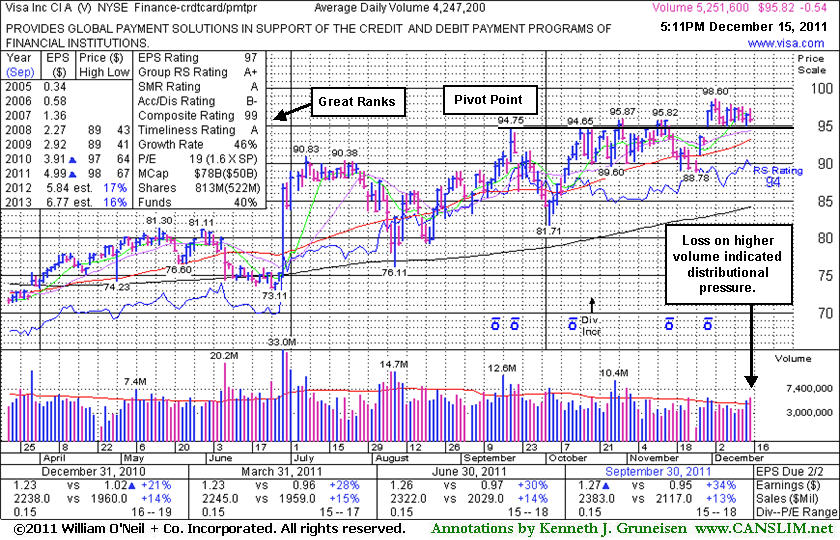
Visa Inc (V -$0.54 or -0.56% to $95.82) encountered distributional pressure today and ended the session near its low with a loss on slightly higher (above average) volume. Its last appearance in this FSU section was on 11/18/11 with an annotated graph under the headline, "Fall Leads to Testing Support Near 50-Day Moving Average." Afterward it briefly slumped below its 50-day moving average (DMA) line and prior lows triggering technical sell signals, then it soon rebounded above the 50 DMA and on to new highs. Volume conviction was not significant behind the gains, however, leaving questions as to the level of institutional buying conviction. A convincing breakout did not subsequently trigger a new technical buy signal.
Its quarterly and annual earnings history has been strong enough to satisfy the C and A criteria. The number of top-rated funds owning its shares rose from 1,635 in Dec '10 to 1,935 in Sep '11, a reassuring sign concerning the I criteria, however it is already well known by the institutional crowd. Leadership shown by at least one other well-known firm in the Finance - Credit Card Payment Processing firm (L criteria) has been a reassuring sign.
Keep in mind that the M criteria tells us that typically 3 out of 4 stocks move in the same direction of the major averages, and not a lot of examples worked out well in recent weeks while the broader market struggled. In a bullish market environment there is no shortage of action-worthy buy candidates, and many of the companies may form multiple sound base patterns throughout an ongoing advance. Disciplined investors always limit losses by selling if ever any stock falls -7% from their purchase price. Otherwise, if leaving the risk un-contained, the damage can become more severe and undisciplined investors must be prepared to suffer the painful consequences.
|
|
|
Color Codes Explained :
Y - Better candidates highlighted by our
staff of experts.
G - Previously featured
in past reports as yellow but may no longer be buyable under the
guidelines.
***Last / Change / Volume data in this table is the closing quote data***
Symbol/Exchange
Company Name
Industry Group |
PRICE |
CHANGE
(%Change) |
Day High |
Volume
(% DAV)
(% 50 day avg vol) |
52 Wk Hi
% From Hi |
Featured
Date |
Price
Featured |
Pivot Featured |
|
Max Buy |
ADS
-
NYSE
Alliance Data Sys Corp
COMPUTER SOFTWARE and SERVICES - Information and Delivery Service
|
$101.55
|
+1.49
1.49% |
$102.75
|
701,756
73.88% of 50 DAV
50 DAV is 949,900
|
$107.33
-5.39%
|
10/21/2011
|
$97.94
|
PP = $101.15
|
|
MB = $106.21
|
Most Recent Note - 12/14/2011 2:40:18 PM
Y - Quietly slumping near its 50 DMA line today with a 3rd consecutive loss on light volume. A violation of that important short-term average would raise concerns.
>>> The latest Featured Stock Update with an annotated graph appeared on 12/14/2011. Click here.
View all notes |
Alert me of new notes |
CANSLIM.net Company Profile |
SEC |
Zacks Reports |
StockTalk |
News |
Chart |
Request a new note
C
A N
S L
I M


|
ALXN
-
NASDAQ
Alexion Pharmaceuticals
DRUGS - Drug Manufacturers - Other
|
$63.67
|
+0.64
1.02% |
$63.96
|
834,759
54.87% of 50 DAV
50 DAV is 1,521,300
|
$70.42
-9.59%
|
11/30/2011
|
$68.66
|
PP = $70.52
|
|
MB = $74.05
|
Most Recent Note - 12/13/2011 7:07:58 PM
G - Loss today with near average volume while encountering resistance at its 50 DMA line. Its prior low ($62.02 on 11/21/11) defines the next important near-term support level to watch. A repair of its 50 DMA violation and volume-driven gains are needed to trigger a new (or add-on) technical buy signal. See the latest FSU analysis for more details and a new annotated graph.
>>> The latest Featured Stock Update with an annotated graph appeared on 12/12/2011. Click here.
View all notes |
Alert me of new notes |
CANSLIM.net Company Profile |
SEC |
Zacks Reports |
StockTalk |
News |
Chart |
Request a new note
C
A N
S L
I M
|
CELG
-
NASDAQ
Celgene Corp
DRUGS - Drug Manufacturers - Major
|
$63.10
|
+0.07
0.11% |
$63.60
|
3,135,774
81.62% of 50 DAV
50 DAV is 3,841,700
|
$68.25
-7.55%
|
9/16/2011
|
$61.21
|
PP = $62.59
|
|
MB = $65.72
|
 Most Recent Note - 12/15/2011 5:47:31 PM
G - Recently encountered resistance at its 50 DMA line. Gains above that short-term average would help its outlook improve, meanwhile it is -7.5% off its 52-week high. Recent lows and the 200 DMA line coincide to define the near-term chart support level near $60.
>>> The latest Featured Stock Update with an annotated graph appeared on 12/1/2011. Click here.
View all notes |
Alert me of new notes |
CANSLIM.net Company Profile |
SEC |
Zacks Reports |
StockTalk |
News |
Chart |
Request a new note
C
A N
S L
I M
|
FEIC
-
NASDAQ
F E I Co
ELECTRONICS - Diversified Electronics
|
$38.64
|
+0.88
2.33% |
$38.77
|
249,286
57.06% of 50 DAV
50 DAV is 436,900
|
$42.25
-8.54%
|
12/7/2011
|
$41.41
|
PP = $42.35
|
|
MB = $44.47
|
Most Recent Note - 12/15/2011 5:44:11 PM
Y - Posted a gain today, halting a streak of 3 consecutive losses. Its 50 DMA line defines important near-term chart support along with prior lows in the $36 area. Disciplined investors would note that a volume-driven gain above the pivot point did not trigger any recent technical buy signal.
>>> The latest Featured Stock Update with an annotated graph appeared on 11/25/2011. Click here.
View all notes |
Alert me of new notes |
CANSLIM.net Company Profile |
SEC |
Zacks Reports |
StockTalk |
News |
Chart |
Request a new note
C
A N
S L
I M
|
GNC
-
NYSE
G N C Holdings Inc
RETAIL - Drug Stores
|
$27.11
|
-0.08
-0.29% |
$28.40
|
1,671,188
130.12% of 50 DAV
50 DAV is 1,284,300
|
$28.91
-6.23%
|
10/26/2011
|
$24.60
|
PP = $24.80
|
|
MB = $26.04
|
Most Recent Note - 12/15/2011 12:46:39 PM
G - Hovering near its all-time high today, extended from its prior base pattern. Prior chart highs and its 50 DMA line coincide in the $25-26 area defining important support to watch on pullbacks.
>>> The latest Featured Stock Update with an annotated graph appeared on 11/21/2011. Click here.
View all notes |
Alert me of new notes |
CANSLIM.net Company Profile |
SEC |
Zacks Reports |
StockTalk |
News |
Chart |
Request a new note
C
A N
S L
I M
|
Symbol/Exchange
Company Name
Industry Group |
PRICE |
CHANGE
(%Change) |
Day High |
Volume
(% DAV)
(% 50 day avg vol) |
52 Wk Hi
% From Hi |
Featured
Date |
Price
Featured |
Pivot Featured |
|
Max Buy |
HMSY
-
NASDAQ
H M S Holdings Corp
COMPUTER SOFTWARE and SERVICES - Healthcare Information Service
|
$31.00
|
+0.35
1.14% |
$31.00
|
641,975
94.60% of 50 DAV
50 DAV is 678,600
|
$32.16
-3.61%
|
10/27/2011
|
$26.44
|
PP = $28.37
|
|
MB = $29.79
|
Most Recent Note - 12/9/2011 12:53:49 PM
G - Poised for a best-ever close today and challenging its all-time high. It is extended from its prior base. Prior highs in the $27-28 area acted as support during the recent pullback.
>>> The latest Featured Stock Update with an annotated graph appeared on 11/30/2011. Click here.
View all notes |
Alert me of new notes |
CANSLIM.net Company Profile |
SEC |
Zacks Reports |
StockTalk |
News |
Chart |
Request a new note
C
A N
S L
I M
|
ISRG
-
NASDAQ
Intuitive Surgical Inc
HEALTH SERVICES - Medical Appliances and Equipment
|
$428.35
|
+4.83
1.14% |
$429.61
|
350,827
85.01% of 50 DAV
50 DAV is 412,700
|
$449.06
-4.61%
|
10/19/2011
|
$424.69
|
PP = $415.29
|
|
MB = $436.05
|
Most Recent Note - 12/14/2011 5:53:19 PM
G - Sank today with volume higher (near average) while nearly testing its 50 DMA line. Prior lows in the $410 area define additional near-term support to watch. See the latest FSU analysis for more details and a new annotated graph.
>>> The latest Featured Stock Update with an annotated graph appeared on 12/13/2011. Click here.
View all notes |
Alert me of new notes |
CANSLIM.net Company Profile |
SEC |
Zacks Reports |
StockTalk |
News |
Chart |
Request a new note
C
A N
S L
I M
|
MELI
-
NASDAQ
Mercadolibre Inc
INTERNET - Internet Software and; Services
|
$84.25
|
-2.84
-3.26% |
$88.66
|
839,161
126.11% of 50 DAV
50 DAV is 665,400
|
$95.48
-11.76%
|
12/5/2011
|
$91.08
|
PP = $92.83
|
|
MB = $97.47
|
Most Recent Note - 12/15/2011 1:35:39 PM
G - Down today for a 4th consecutive loss on near average or lighter volume, slumping -11.7% off its all-time high. Color code is changed to green based on its deterioration below the pivot point cited. Disciplined investors limit losses if ever a stock falls -7% from their purchase price.
>>> The latest Featured Stock Update with an annotated graph appeared on 12/5/2011. Click here.
View all notes |
Alert me of new notes |
CANSLIM.net Company Profile |
SEC |
Zacks Reports |
StockTalk |
News |
Chart |
Request a new note
C
A N
S L
I M
|
MG
-
NYSE
Mistras Group Inc
DIVERSIFIED SERVICES - Bulding and Faci;ity Management Services
|
$24.01
|
-0.10
-0.41% |
$24.42
|
138,515
66.88% of 50 DAV
50 DAV is 207,100
|
$25.28
-5.02%
|
10/28/2011
|
$22.49
|
PP = $23.61
|
|
MB = $24.79
|
Most Recent Note - 12/15/2011 1:47:59 PM
Y - Stubbornly holding its ground since its solid gain on 12/05/11 with +55% above average volume triggered a technical buy signal. Prior highs in the $23 area define initial chart support to watch above its 50 DMA line.
>>> The latest Featured Stock Update with an annotated graph appeared on 12/8/2011. Click here.
View all notes |
Alert me of new notes |
CANSLIM.net Company Profile |
SEC |
Zacks Reports |
StockTalk |
News |
Chart |
Request a new note
C
A N
S L
I M
|
MKTX
-
NASDAQ
Marketaxess Holdings Inc
FINANCIAL SERVICES - Investment Brokerage - Nationa
|
$28.26
|
+1.31
4.86% |
$28.64
|
185,076
76.45% of 50 DAV
50 DAV is 242,100
|
$31.45
-10.14%
|
10/28/2011
|
$29.79
|
PP = $31.05
|
|
MB = $32.60
|
Most Recent Note - 12/15/2011 1:24:06 PM
Y - Considerable gain today has it rebounding above its 50 DMA line, helping its technical stance, and its color code is changed to yellow. Still facing previously stubborn resistance in the $31 area, meanwhile volume-driven gains are needed to confirm a proper buy signal.
>>> The latest Featured Stock Update with an annotated graph appeared on 11/23/2011. Click here.
View all notes |
Alert me of new notes |
CANSLIM.net Company Profile |
SEC |
Zacks Reports |
StockTalk |
News |
Chart |
Request a new note
C
A N
S L
I M
|
Symbol/Exchange
Company Name
Industry Group |
PRICE |
CHANGE
(%Change) |
Day High |
Volume
(% DAV)
(% 50 day avg vol) |
52 Wk Hi
% From Hi |
Featured
Date |
Price
Featured |
Pivot Featured |
|
Max Buy |
OSIS
-
NASDAQ
O S I Systems Inc
ELECTRONICS - Semiconductor Equipment and Mate
|
$46.19
|
+1.05
2.33% |
$46.50
|
78,382
52.82% of 50 DAV
50 DAV is 148,400
|
$49.04
-5.81%
|
11/1/2011
|
$42.07
|
PP = $45.57
|
|
MB = $47.85
|
Most Recent Note - 12/15/2011 5:50:23 PM
Y - Posted a 2nd consecutive gain today with light volume, consolidating just above its 50 DMA line defining near-term chart support. It has made no headway since its gap gain with +44% above average volume on 11/30/11 triggered a technical buy signal.
>>> The latest Featured Stock Update with an annotated graph appeared on 11/28/2011. Click here.
View all notes |
Alert me of new notes |
CANSLIM.net Company Profile |
SEC |
Zacks Reports |
StockTalk |
News |
Chart |
Request a new note
C
A N
S L
I M
|
PRGO
-
NASDAQ
Perrigo Co
DRUGS - Drug Related Products
|
$96.97
|
+1.14
1.19% |
$97.59
|
696,206
82.15% of 50 DAV
50 DAV is 847,500
|
$101.94
-4.88%
|
12/9/2011
|
$99.54
|
PP = $101.56
|
|
MB = $106.64
|
Most Recent Note - 12/14/2011 5:59:47 PM
Y - Down today with above average volume, demonstrating action indicative of distributional pressure. Color code was changed yellow since it has formed a late-stage base, while confirming gains above its pivot point are still needed to trigger a proper new technical buy signal.
>>> The latest Featured Stock Update with an annotated graph appeared on 12/9/2011. Click here.
View all notes |
Alert me of new notes |
CANSLIM.net Company Profile |
SEC |
Zacks Reports |
StockTalk |
News |
Chart |
Request a new note
C
A N
S L
I M
|
RAX
-
NYSE
Rackspace Hosting Inc
INTERNET - Internet Software and; Services
|
$43.40
|
+0.30
0.70% |
$43.95
|
1,662,089
104.49% of 50 DAV
50 DAV is 1,590,600
|
$46.50
-6.66%
|
11/8/2011
|
$44.28
|
PP = $46.27
|
|
MB = $48.58
|
Most Recent Note - 12/14/2011 12:48:35 PM
Y - Churning near its 52-week and all-time high, making limited price progress in recent weeks. Its Relative Strength line has led the way into new high territory recently, which is recognized as a positive characteristic in buy candidates. Support to watch is at its closely coinciding 50 and 200 DMA lines. Subsequent violations would trigger damaging technical sell signals.
>>> The latest Featured Stock Update with an annotated graph appeared on 12/7/2011. Click here.
View all notes |
Alert me of new notes |
CANSLIM.net Company Profile |
SEC |
Zacks Reports |
StockTalk |
News |
Chart |
Request a new note
C
A N
S L
I M
|
SWI
-
NYSE
Solarwinds Inc
COMPUTER SOFTWARE and SERVICES - Application Software
|
$29.46
|
+0.33
1.13% |
$29.68
|
973,952
83.09% of 50 DAV
50 DAV is 1,172,200
|
$33.68
-12.53%
|
10/27/2011
|
$27.78
|
PP = $25.62
|
|
MB = $26.90
|
Most Recent Note - 12/14/2011 2:30:12 PM
G - Down today for a 3rd consecutive loss with volume running at an above average pace while trading near its 50 DMA line noted as initial support to watch above prior chart highs.
>>> The latest Featured Stock Update with an annotated graph appeared on 11/22/2011. Click here.
View all notes |
Alert me of new notes |
CANSLIM.net Company Profile |
SEC |
Zacks Reports |
StockTalk |
News |
Chart |
Request a new note
C
A N
S L
I M
|
TDG
-
NYSE
Transdigm Group Inc
AEROSPACE/DEFENSE - Aerospace/Defense Products and; Services
|
$95.14
|
+0.50
0.53% |
$95.64
|
195,370
47.31% of 50 DAV
50 DAV is 413,000
|
$102.73
-7.39%
|
11/9/2011
|
$98.45
|
PP = $95.14
|
|
MB = $99.90
|
Most Recent Note - 12/15/2011 5:52:56 PM
Y - Small gain today on lighter volume halted a streak of 3 consecutive losses. Its 50 DMA line defines near-term support above recent lows where subsequent violations would trigger technical sell signals.
>>> The latest Featured Stock Update with an annotated graph appeared on 12/6/2011. Click here.
View all notes |
Alert me of new notes |
CANSLIM.net Company Profile |
SEC |
Zacks Reports |
StockTalk |
News |
Chart |
Request a new note
C
A N
S L
I M
|
Symbol/Exchange
Company Name
Industry Group |
PRICE |
CHANGE
(%Change) |
Day High |
Volume
(% DAV)
(% 50 day avg vol) |
52 Wk Hi
% From Hi |
Featured
Date |
Price
Featured |
Pivot Featured |
|
Max Buy |
UA
-
NYSE
Under Armour Inc Cl A
CONSUMER NON-DURABLES - Textile - Apparel Clothing
|
$74.13
|
+0.14
0.19% |
$75.98
|
1,371,071
103.21% of 50 DAV
50 DAV is 1,328,400
|
$87.40
-15.18%
|
10/25/2011
|
$82.43
|
PP = $80.80
|
|
MB = $84.84
|
Most Recent Note - 12/15/2011 5:58:09 PM
G - Gain today halted a streak of 3 consecutive losses, but concerns were raised by recent trading below a prior low ($73.55 on 11/21/11) while testing important chart support at its 200 DMA line.
>>> The latest Featured Stock Update with an annotated graph appeared on 11/29/2011. Click here.
View all notes |
Alert me of new notes |
CANSLIM.net Company Profile |
SEC |
Zacks Reports |
StockTalk |
News |
Chart |
Request a new note
C
A N
S L
I M
|
ULTA
-
NASDAQ
Ulta Salon Cosm & Frag
SPECIALTY RETAIL - Specialty Retail, Other
|
$66.72
|
-0.49
-0.73% |
$68.43
|
811,279
76.65% of 50 DAV
50 DAV is 1,058,400
|
$75.70
-11.86%
|
12/2/2011
|
$72.88
|
PP = $75.79
|
|
MB = $79.58
|
Most Recent Note - 12/15/2011 6:00:31 PM
G - Color code was changed to green after violating its 50 DMA line, and today it extended its losing streak with a 4th consecutive loss. Prior lows near $64 define the next important chart support level above its 200 DMA line.
>>> The latest Featured Stock Update with an annotated graph appeared on 12/2/2011. Click here.
View all notes |
Alert me of new notes |
CANSLIM.net Company Profile |
SEC |
Zacks Reports |
StockTalk |
News |
Chart |
Request a new note
C
A N
S L
I M
|
V
-
NYSE
Visa Inc Cl A
DIVERSIFIED SERVICES - Business/Management Services
|
$95.82
|
-0.54
-0.56% |
$97.32
|
5,254,914
99.05% of 50 DAV
50 DAV is 5,305,100
|
$98.60
-2.82%
|
10/24/2011
|
$94.21
|
PP = $94.85
|
|
MB = $99.59
|
Most Recent Note - 12/15/2011 5:39:22 PM
Y - Encountered distributional pressure today and ended the session near its low with a loss on slightly higher (above average) volume. See the latest FSU analysis for more details and a new annotated graph.
>>> The latest Featured Stock Update with an annotated graph appeared on 12/15/2011. Click here.
View all notes |
Alert me of new notes |
CANSLIM.net Company Profile |
SEC |
Zacks Reports |
StockTalk |
News |
Chart |
Request a new note
C
A N
S L
I M
|
|
|
|
THESE ARE NOT BUY RECOMMENDATIONS!
Comments contained in the body of this report are technical
opinions only. The material herein has been obtained
from sources believed to be reliable and accurate, however,
its accuracy and completeness cannot be guaranteed.
This site is not an investment advisor, hence it does
not endorse or recommend any securities or other investments.
Any recommendation contained in this report may not
be suitable for all investors and it is not to be deemed
an offer or solicitation on our part with respect to
the purchase or sale of any securities. All trademarks,
service marks and trade names appearing in this report
are the property of their respective owners, and are
likewise used for identification purposes only.
This report is a service available
only to active Paid Premium Members.
You may opt-out of receiving report notifications
at any time. Questions or comments may be submitted
by writing to Premium Membership Services 665 S.E. 10 Street, Suite 201 Deerfield Beach, FL 33441-5634 or by calling 1-800-965-8307
or 954-785-1121.
|
|
|

