You are not logged in.
This means you
CAN ONLY VIEW reports that were published prior to Tuesday, April 15, 2025.
You
MUST UPGRADE YOUR MEMBERSHIP if you want to see any current reports.
AFTER MARKET UPDATE - WEDNESDAY, DECEMBER 14TH, 2011
Previous After Market Report Next After Market Report >>>
|
|
|
|
DOW |
-131.46 |
11,823.48 |
-1.10% |
|
Volume |
928,865,830 |
+0% |
|
Volume |
1,740,758,950 |
+1% |
|
NASDAQ |
-39.96 |
2,539.31 |
-1.55% |
|
Advancers |
824 |
26% |
|
Advancers |
898 |
34% |
|
S&P 500 |
-13.91 |
1,211.82 |
-1.13% |
|
Decliners |
2,220 |
71% |
|
Decliners |
1,676 |
63% |
|
Russell 2000 |
-9.60 |
708.46 |
-1.34% |
|
52 Wk Highs |
59 |
|
|
52 Wk Highs |
13 |
|
|
S&P 600 |
-5.88 |
395.17 |
-1.47% |
|
52 Wk Lows |
108 |
|
|
52 Wk Lows |
148 |
|
|
 |
Damage Mounting as Major Averages Fall Again
Kenneth J. Gruneisen - Passed the CAN SLIM® Master's Exam
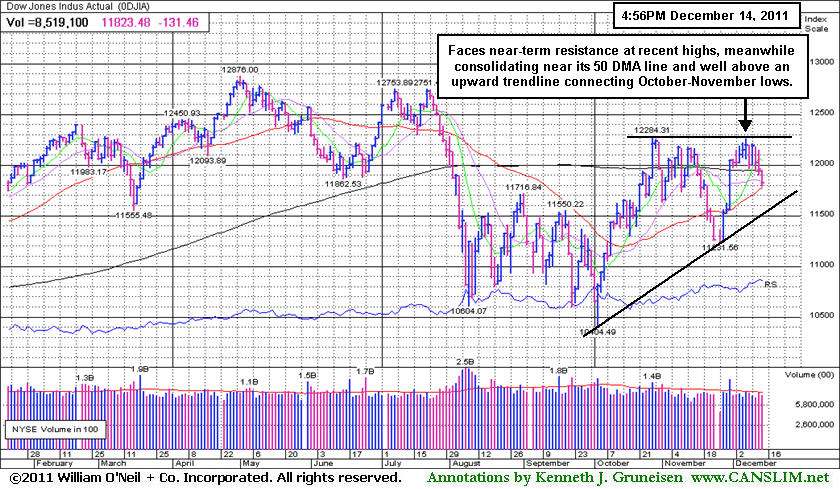
Volume totals were reported slightly higher on the NYSE and on the Nasdaq exchange versus Tuesday's session totals as damage continued to mount for the major averages. The benchmark S&P 500 Index has fallen more than -3% percent so far this week. Decliners led advancers by almost 3-1 on the NYSE and by almost 2-1 on the Nasdaq exchange. New 52-week lows outnumbered new 52-week highs on the NYSE and on the Nasdaq exchange. There were only 4 high-ranked companies from the CANSLIM.net Leaders List that made new 52-week highs and appeared on the CANSLIM.net BreakOuts Page, down sharply from the prior session total of 29 stocks. There were gains for only 3 of the 18 high-ranked companies currently included on the Featured Stocks Page.
European markets closed at session lows with the FTSE in London falling -2.25%, the German DAX giving up -1.7%, and the CAC in France lower by -3.3%. With the euro zone debt crisis showing no signs of abating as Europe slides into recession, the outlook for the world economy is growing bleaker. Italy's borrowing costs rose to a euro-era record after an auction of five-year debt, while the euro fell to an 11-month low against the dollar.
U.S. January crude fell $5.19 to settle at $94.95 a barrel, and the slump in oil prices hit energy stocks, Chevron Corp (CVX -2.98%) was the biggest loser on the Dow behind industrial machine maker Caterpillar Inc (CAT -4.4%), whose global operations are sensitive to the economy. Federal prosecutors in the Brazilian state of Rio de Janeiro filed a lawsuit on Wednesday against Chevron and rig contractor Transocean Ltd (RIG -3.94%) over an oil spill off Brazil's coast last month, seeking 20 billion reais ($10.6 billion) in damages.
An index of home builder stocks after the National Association of Realtors said data on sales of previously owned homes will be revised downward because of double counting. Some traders were also disappointed the U.S. Federal Reserve made no mention of possible new stimulus measures after its Tuesday meeting.
Gold dropped to its lowest level since early October as the weak euro and a shortage of dollar funding near the year-end prompted investors to sell aggressively. Commodity-related shares were further pressured by the stronger U.S. dollar. The price of copper fell near a three-week low, the price of aluminum hit its lowest level in 17 months, and tin hit a three-month low.
Our monthly newsletter CANSLIM.net News will be published soon with an informative review of current market conditions, leading groups, and best buy candidates. Via the Premium Member Homepage links to all prior reports and webcasts are always available.
PICTURED: The Dow Jones Industrial Average faces near-term resistance at prior highs, meanwhile it is consolidating near its 50-day moving average line and well above an upward trendline connecting its October-November lows.
|
 Kenneth J. Gruneisen started out as a licensed stockbroker in August 1987, a couple of months prior to the historic stock market crash that took the Dow Jones Industrial Average down -22.6% in a single day. He has published daily fact-based fundamental and technical analysis on high-ranked stocks online for two decades. Through FACTBASEDINVESTING.COM, Kenneth provides educational articles, news, market commentary, and other information regarding proven investment systems that work in good times and bad.
Comments contained in the body of this report are technical opinions only and are not necessarily those of Gruneisen Growth Corp. The material herein has been obtained from sources believed to be reliable and accurate, however, its accuracy and completeness cannot be guaranteed. Our firm, employees, and customers may effect transactions, including transactions contrary to any recommendation herein, or have positions in the securities mentioned herein or options with respect thereto. Any recommendation contained in this report may not be suitable for all investors and it is not to be deemed an offer or solicitation on our part with respect to the purchase or sale of any securities. |
|
 |
Commodity-Linked Groups and the Tech Sector Led Losses
Kenneth J. Gruneisen - Passed the CAN SLIM® Master's Exam
Commodity-linked groups were hardest hit on Wednesday as the Oil Services Index ($OSX -3.96%), Integrated Oil Index ($XOI -2.54%), and the Gold & Silver Index ($XAU -2.79%) suffered big losses. The tech sector saw unanimous losses from the Networking Index ($NWX -2.24%), Internet Index ($IIX -1.91%), Semiconductor Index ($SOX -1.63%), with a smaller loss for the Biotechnology Index ($BTK -0.53%). The Healthcare Index ($HMO -1.26%) fell. The major averages were also influenced by a loss from the Retail Index ($RLX -0.76%) and weak action in financial shares again pressuring the Broker/Dealer Index ($XBD -2.03%) and Bank Index ($BKX -0.51%).
Charts courtesy www.stockcharts.com
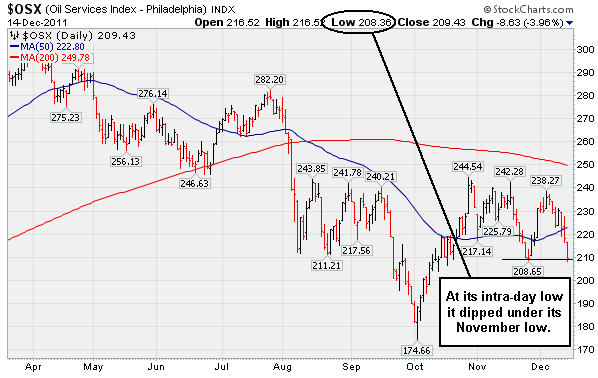
PICTURED: The Oil Services Index ($OSX -3.96%) fell hard and was the largest decliner today of the industry group indexes routinely cited in this section of the report. It dipped under its November low intra-day.
| Oil Services |
$OSX |
209.43 |
-8.63 |
-3.96% |
-14.56% |
| Healthcare |
$HMO |
2,166.94 |
-27.68 |
-1.26% |
+28.07% |
| Integrated Oil |
$XOI |
1,165.02 |
-30.39 |
-2.54% |
-3.97% |
| Semiconductor |
$SOX |
350.73 |
-5.80 |
-1.63% |
-14.83% |
| Networking |
$NWX |
209.64 |
-4.79 |
-2.23% |
-25.28% |
| Internet |
$IIX |
272.59 |
-5.30 |
-1.91% |
-11.42% |
| Broker/Dealer |
$XBD |
81.17 |
-1.68 |
-2.03% |
-33.20% |
| Retail |
$RLX |
515.33 |
-3.96 |
-0.76% |
+1.37% |
| Gold & Silver |
$XAU |
182.58 |
-5.24 |
-2.79% |
-19.42% |
| Bank |
$BKX |
37.39 |
-0.19 |
-0.51% |
-28.39% |
| Biotech |
$BTK |
1,021.92 |
-5.40 |
-0.53% |
-21.25% |
|
|
|
 |
Recent Low and 200 DMA Line Define Support Below Short-Term Average
Kenneth J. Gruneisen - Passed the CAN SLIM® Master's Exam
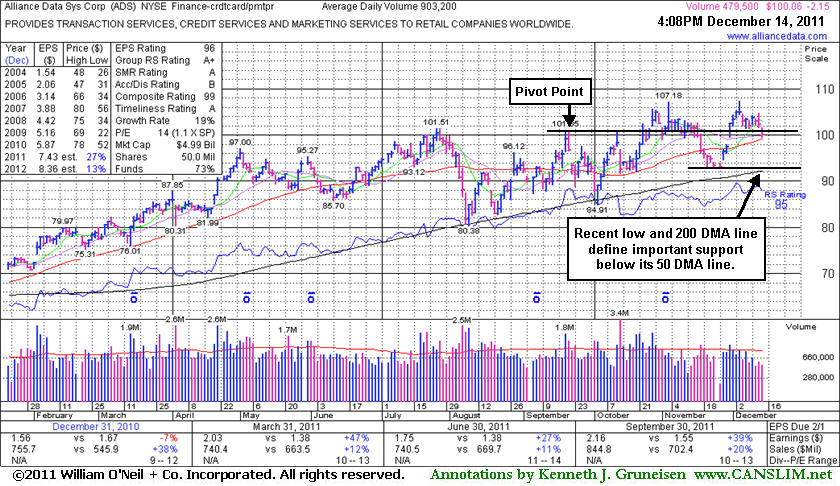
Alliance Data Systems Corporation (ADS -$2.14 or -2.09% to $100.07) quietly slumped near its 50-day moving average (DMA) line today with a 3rd consecutive loss on light volume. While slumping below its pivot point and prior chart highs in the $101 area again now, a subsequent violation of its 50 DMA line would raise greater concerns. Its last appearance in this FSU section with an annotated graph was on 11/17/11 with an annotated graph under the headline, "Slump Into Prior Base Raises Concerns While Testing 50-Day Average," as a damaging loss led to deterioration back into its prior base. The recent low and its 200 DMA line closely coincide now as the next important chart support level to watch below its short-term average. After ADS was featured in yellow in the 10/21/11 mid-day report it initially powered to new high territory with volume-driven gains, but it stalled and made limited progress. As always, protect your capital buy selling if any stock falls 7-8% your purchase price.
A much earlier appearance in this FSU section with an annotated graph was way back on 1/23/07 with an annotated graph under the headline, "High Ranked Leader Perched Near Highs". It has maintained a good annual earnings (A criteria) history, even through challenging economic times in recent years which created flaws in the A criteria for many growth stocks. Its past 3 quarterly comparisons (Mar, Jun, and Sep '11) showed earnings per share increases greater than the +25% minimum guideline (C criteria). Current leadership from other companies in the Finance - Credit Card/Payment Processing group (L criteria) is a favorable characteristic. Ownership by top-rated funds also rose from 616 in Dec '10 to 762 in Sep '11, a reassuring sign concerning the I criteria.
|
|
|
Color Codes Explained :
Y - Better candidates highlighted by our
staff of experts.
G - Previously featured
in past reports as yellow but may no longer be buyable under the
guidelines.
***Last / Change / Volume data in this table is the closing quote data***
Symbol/Exchange
Company Name
Industry Group |
PRICE |
CHANGE
(%Change) |
Day High |
Volume
(% DAV)
(% 50 day avg vol) |
52 Wk Hi
% From Hi |
Featured
Date |
Price
Featured |
Pivot Featured |
|
Max Buy |
ADS
-
NYSE
Alliance Data Sys Corp
COMPUTER SOFTWARE and SERVICES - Information and Delivery Service
|
$100.06
|
-2.15
-2.10% |
$101.54
|
490,683
51.66% of 50 DAV
50 DAV is 949,900
|
$107.33
-6.77%
|
10/21/2011
|
$97.94
|
PP = $101.15
|
|
MB = $106.21
|
 Most Recent Note - 12/14/2011 2:40:18 PM
Y - Quietly slumping near its 50 DMA line today with a 3rd consecutive loss on light volume. A violation of that important short-term average would raise concerns.
>>> The latest Featured Stock Update with an annotated graph appeared on 12/14/2011. Click here.
View all notes |
Alert me of new notes |
CANSLIM.net Company Profile |
SEC |
Zacks Reports |
StockTalk |
News |
Chart |
Request a new note
C
A N
S L
I M


|
ALXN
-
NASDAQ
Alexion Pharmaceuticals
DRUGS - Drug Manufacturers - Other
|
$63.03
|
-0.79
-1.24% |
$64.16
|
854,040
56.14% of 50 DAV
50 DAV is 1,521,300
|
$70.42
-10.49%
|
11/30/2011
|
$68.66
|
PP = $70.52
|
|
MB = $74.05
|
Most Recent Note - 12/13/2011 7:07:58 PM
G - Loss today with near average volume while encountering resistance at its 50 DMA line. Its prior low ($62.02 on 11/21/11) defines the next important near-term support level to watch. A repair of its 50 DMA violation and volume-driven gains are needed to trigger a new (or add-on) technical buy signal. See the latest FSU analysis for more details and a new annotated graph.
>>> The latest Featured Stock Update with an annotated graph appeared on 12/12/2011. Click here.
View all notes |
Alert me of new notes |
CANSLIM.net Company Profile |
SEC |
Zacks Reports |
StockTalk |
News |
Chart |
Request a new note
C
A N
S L
I M
|
CELG
-
NASDAQ
Celgene Corp
DRUGS - Drug Manufacturers - Major
|
$63.03
|
-0.93
-1.45% |
$64.61
|
3,713,179
96.65% of 50 DAV
50 DAV is 3,841,700
|
$68.25
-7.65%
|
9/16/2011
|
$61.21
|
PP = $62.59
|
|
MB = $65.72
|
Most Recent Note - 12/9/2011 2:18:03 PM
G - Solid gain today, rising within close range of its 50 DMA line. Gains above that short-term average would help its outlook improve, meanwhile it is -7.3% off its 52-week high. Its Relative Strength (RS) Rating has slumped to 81, down from 93 when shown in an 10/14/11 FSU analysis.
>>> The latest Featured Stock Update with an annotated graph appeared on 12/1/2011. Click here.
View all notes |
Alert me of new notes |
CANSLIM.net Company Profile |
SEC |
Zacks Reports |
StockTalk |
News |
Chart |
Request a new note
C
A N
S L
I M
|
FEIC
-
NASDAQ
F E I Co
ELECTRONICS - Diversified Electronics
|
$37.76
|
-1.04
-2.68% |
$38.76
|
260,208
59.56% of 50 DAV
50 DAV is 436,900
|
$42.25
-10.63%
|
12/7/2011
|
$41.41
|
PP = $42.35
|
|
MB = $44.47
|
Most Recent Note - 12/14/2011 5:23:29 PM
Y - Slumped today for a 3rd consecutive loss with below average volume amid widespread market weakness. Its 50 DMA line defines important near-term chart support along with prior lows in the $36 area. Disciplined investors would note that a volume-driven gain above the pivot point did not trigger any recent technical buy signal.
>>> The latest Featured Stock Update with an annotated graph appeared on 11/25/2011. Click here.
View all notes |
Alert me of new notes |
CANSLIM.net Company Profile |
SEC |
Zacks Reports |
StockTalk |
News |
Chart |
Request a new note
C
A N
S L
I M
|
GNC
-
NYSE
G N C Holdings Inc
RETAIL - Drug Stores
|
$27.19
|
-0.68
-2.44% |
$28.03
|
1,923,299
149.75% of 50 DAV
50 DAV is 1,284,300
|
$28.91
-5.95%
|
10/26/2011
|
$24.60
|
PP = $24.80
|
|
MB = $26.04
|
Most Recent Note - 12/13/2011 7:06:15 PM
G - Touched a new all-time high today and then reversed into the red for a loss with above average volume, a sign of distributional pressure. Prior chart highs and its 50 DMA line coincide in the $25-26 area defining important support to watch on pullbacks.
>>> The latest Featured Stock Update with an annotated graph appeared on 11/21/2011. Click here.
View all notes |
Alert me of new notes |
CANSLIM.net Company Profile |
SEC |
Zacks Reports |
StockTalk |
News |
Chart |
Request a new note
C
A N
S L
I M
|
Symbol/Exchange
Company Name
Industry Group |
PRICE |
CHANGE
(%Change) |
Day High |
Volume
(% DAV)
(% 50 day avg vol) |
52 Wk Hi
% From Hi |
Featured
Date |
Price
Featured |
Pivot Featured |
|
Max Buy |
HMSY
-
NASDAQ
H M S Holdings Corp
COMPUTER SOFTWARE and SERVICES - Healthcare Information Service
|
$30.65
|
-0.17
-0.55% |
$31.00
|
700,343
103.20% of 50 DAV
50 DAV is 678,600
|
$32.16
-4.70%
|
10/27/2011
|
$26.44
|
PP = $28.37
|
|
MB = $29.79
|
Most Recent Note - 12/9/2011 12:53:49 PM
G - Poised for a best-ever close today and challenging its all-time high. It is extended from its prior base. Prior highs in the $27-28 area acted as support during the recent pullback.
>>> The latest Featured Stock Update with an annotated graph appeared on 11/30/2011. Click here.
View all notes |
Alert me of new notes |
CANSLIM.net Company Profile |
SEC |
Zacks Reports |
StockTalk |
News |
Chart |
Request a new note
C
A N
S L
I M
|
ISRG
-
NASDAQ
Intuitive Surgical Inc
HEALTH SERVICES - Medical Appliances and Equipment
|
$423.52
|
-10.87
-2.50% |
$433.93
|
381,861
92.53% of 50 DAV
50 DAV is 412,700
|
$449.06
-5.69%
|
10/19/2011
|
$424.69
|
PP = $415.29
|
|
MB = $436.05
|
Most Recent Note - 12/14/2011 5:53:19 PM
G - Sank today with volume higher (near average) while nearly testing its 50 DMA line. Prior lows in the $410 area define additional near-term support to watch. See the latest FSU analysis for more details and a new annotated graph.
>>> The latest Featured Stock Update with an annotated graph appeared on 12/13/2011. Click here.
View all notes |
Alert me of new notes |
CANSLIM.net Company Profile |
SEC |
Zacks Reports |
StockTalk |
News |
Chart |
Request a new note
C
A N
S L
I M
|
MELI
-
NASDAQ
Mercadolibre Inc
INTERNET - Internet Software and; Services
|
$87.09
|
-2.07
-2.32% |
$88.57
|
577,084
86.73% of 50 DAV
50 DAV is 665,400
|
$95.48
-8.79%
|
12/5/2011
|
$91.08
|
PP = $92.83
|
|
MB = $97.47
|
Most Recent Note - 12/14/2011 5:56:55 PM
Y - Quietly pulled back today for a 3rd consecutive loss on near average or lighter volume, closing -8.8% off its all-time high. Disciplined investors limit losses if ever a stock falls -7% from their purchase price.
>>> The latest Featured Stock Update with an annotated graph appeared on 12/5/2011. Click here.
View all notes |
Alert me of new notes |
CANSLIM.net Company Profile |
SEC |
Zacks Reports |
StockTalk |
News |
Chart |
Request a new note
C
A N
S L
I M
|
MG
-
NYSE
Mistras Group Inc
DIVERSIFIED SERVICES - Bulding and Faci;ity Management Services
|
$24.11
|
+0.21
0.88% |
$24.30
|
176,552
85.25% of 50 DAV
50 DAV is 207,100
|
$25.28
-4.63%
|
10/28/2011
|
$22.49
|
PP = $23.61
|
|
MB = $24.79
|
Most Recent Note - 12/9/2011 2:22:40 PM
Y - Up today on very light volume, rising back above its pivot point. A solid gain and strong close on 12/05/11 with +55% above average volume triggered a technical buy signal. Prior highs in the $23 area define initial chart support to watch. See the latest FSU analysis for more details and a new annotated graph.
>>> The latest Featured Stock Update with an annotated graph appeared on 12/8/2011. Click here.
View all notes |
Alert me of new notes |
CANSLIM.net Company Profile |
SEC |
Zacks Reports |
StockTalk |
News |
Chart |
Request a new note
C
A N
S L
I M
|
MKTX
-
NASDAQ
Marketaxess Holdings Inc
FINANCIAL SERVICES - Investment Brokerage - Nationa
|
$26.95
|
-0.68
-2.46% |
$27.56
|
184,393
76.16% of 50 DAV
50 DAV is 242,100
|
$31.45
-14.31%
|
10/28/2011
|
$29.79
|
PP = $31.05
|
|
MB = $32.60
|
Most Recent Note - 12/13/2011 6:51:44 PM
G - Pulled back on below average volume today and closed near the session low finishing just below its 50 DMA line. It still faces previously stubborn resistance in the $31 area.
>>> The latest Featured Stock Update with an annotated graph appeared on 11/23/2011. Click here.
View all notes |
Alert me of new notes |
CANSLIM.net Company Profile |
SEC |
Zacks Reports |
StockTalk |
News |
Chart |
Request a new note
C
A N
S L
I M
|
Symbol/Exchange
Company Name
Industry Group |
PRICE |
CHANGE
(%Change) |
Day High |
Volume
(% DAV)
(% 50 day avg vol) |
52 Wk Hi
% From Hi |
Featured
Date |
Price
Featured |
Pivot Featured |
|
Max Buy |
OSIS
-
NASDAQ
O S I Systems Inc
ELECTRONICS - Semiconductor Equipment and Mate
|
$45.14
|
+0.06
0.13% |
$46.09
|
108,200
72.91% of 50 DAV
50 DAV is 148,400
|
$49.04
-7.95%
|
11/1/2011
|
$42.07
|
PP = $45.57
|
|
MB = $47.85
|
Most Recent Note - 12/13/2011 2:05:12 PM
Y - Reversed into the red today after a positive start had it poised for a best-ever close. Its gap gain with +44% above average volume on 11/30/11 triggered a technical buy signal. Its 50 DMA line defines important support to watch.
>>> The latest Featured Stock Update with an annotated graph appeared on 11/28/2011. Click here.
View all notes |
Alert me of new notes |
CANSLIM.net Company Profile |
SEC |
Zacks Reports |
StockTalk |
News |
Chart |
Request a new note
C
A N
S L
I M
|
PRGO
-
NASDAQ
Perrigo Co
DRUGS - Drug Related Products
|
$95.83
|
-1.39
-1.43% |
$96.96
|
1,208,781
142.63% of 50 DAV
50 DAV is 847,500
|
$101.94
-5.99%
|
12/9/2011
|
$99.54
|
PP = $101.56
|
|
MB = $106.64
|
Most Recent Note - 12/14/2011 5:59:47 PM
Y - Down today with above average volume, demonstrating action indicative of distributional pressure. Color code was changed yellow since it has formed a late-stage base, while confirming gains above its pivot point are still needed to trigger a proper new technical buy signal.
>>> The latest Featured Stock Update with an annotated graph appeared on 12/9/2011. Click here.
View all notes |
Alert me of new notes |
CANSLIM.net Company Profile |
SEC |
Zacks Reports |
StockTalk |
News |
Chart |
Request a new note
C
A N
S L
I M
|
RAX
-
NYSE
Rackspace Hosting Inc
INTERNET - Internet Software and; Services
|
$43.10
|
-0.70
-1.60% |
$43.83
|
2,464,809
154.96% of 50 DAV
50 DAV is 1,590,600
|
$46.50
-7.30%
|
11/8/2011
|
$44.28
|
PP = $46.27
|
|
MB = $48.58
|
Most Recent Note - 12/14/2011 12:48:35 PM
Y - Churning near its 52-week and all-time high, making limited price progress in recent weeks. Its Relative Strength line has led the way into new high territory recently, which is recognized as a positive characteristic in buy candidates. Support to watch is at its closely coinciding 50 and 200 DMA lines. Subsequent violations would trigger damaging technical sell signals.
>>> The latest Featured Stock Update with an annotated graph appeared on 12/7/2011. Click here.
View all notes |
Alert me of new notes |
CANSLIM.net Company Profile |
SEC |
Zacks Reports |
StockTalk |
News |
Chart |
Request a new note
C
A N
S L
I M
|
SWI
-
NYSE
Solarwinds Inc
COMPUTER SOFTWARE and SERVICES - Application Software
|
$29.13
|
-1.54
-5.02% |
$30.67
|
1,870,795
159.60% of 50 DAV
50 DAV is 1,172,200
|
$33.68
-13.51%
|
10/27/2011
|
$27.78
|
PP = $25.62
|
|
MB = $26.90
|
Most Recent Note - 12/14/2011 2:30:12 PM
G - Down today for a 3rd consecutive loss with volume running at an above average pace while trading near its 50 DMA line noted as initial support to watch above prior chart highs.
>>> The latest Featured Stock Update with an annotated graph appeared on 11/22/2011. Click here.
View all notes |
Alert me of new notes |
CANSLIM.net Company Profile |
SEC |
Zacks Reports |
StockTalk |
News |
Chart |
Request a new note
C
A N
S L
I M
|
TDG
-
NYSE
Transdigm Group Inc
AEROSPACE/DEFENSE - Aerospace/Defense Products and; Services
|
$94.64
|
-0.10
-0.11% |
$95.08
|
453,038
109.69% of 50 DAV
50 DAV is 413,000
|
$102.73
-7.88%
|
11/9/2011
|
$98.45
|
PP = $95.14
|
|
MB = $99.90
|
Most Recent Note - 12/9/2011 3:44:06 PM
Y - Up today on light volume, trading within close striking distance of its best-ever close. A subsequent slump below the recent low and its 50 DMA line would trigger technical sell signals. See the latest FSU analysis for more details and a new annotated graph.
>>> The latest Featured Stock Update with an annotated graph appeared on 12/6/2011. Click here.
View all notes |
Alert me of new notes |
CANSLIM.net Company Profile |
SEC |
Zacks Reports |
StockTalk |
News |
Chart |
Request a new note
C
A N
S L
I M
|
Symbol/Exchange
Company Name
Industry Group |
PRICE |
CHANGE
(%Change) |
Day High |
Volume
(% DAV)
(% 50 day avg vol) |
52 Wk Hi
% From Hi |
Featured
Date |
Price
Featured |
Pivot Featured |
|
Max Buy |
UA
-
NYSE
Under Armour Inc Cl A
CONSUMER NON-DURABLES - Textile - Apparel Clothing
|
$73.99
|
-0.49
-0.66% |
$75.10
|
1,340,954
100.95% of 50 DAV
50 DAV is 1,328,400
|
$87.40
-15.34%
|
10/25/2011
|
$82.43
|
PP = $80.80
|
|
MB = $84.84
|
Most Recent Note - 12/13/2011 1:30:01 PM
G - Down again today, slumping further below its 50 DMA line as a 2nd consecutive loss with above average volume raises more concerns. The recent low ($73.55 on 11/21/11) defines important chart support to watch above its 200 DMA line.
>>> The latest Featured Stock Update with an annotated graph appeared on 11/29/2011. Click here.
View all notes |
Alert me of new notes |
CANSLIM.net Company Profile |
SEC |
Zacks Reports |
StockTalk |
News |
Chart |
Request a new note
C
A N
S L
I M
|
ULTA
-
NASDAQ
Ulta Salon Cosm & Frag
SPECIALTY RETAIL - Specialty Retail, Other
|
$67.21
|
-3.41
-4.83% |
$70.14
|
1,321,824
124.89% of 50 DAV
50 DAV is 1,058,400
|
$75.70
-11.22%
|
12/2/2011
|
$72.88
|
PP = $75.79
|
|
MB = $79.58
|
Most Recent Note - 12/14/2011 1:46:55 PM
G - Color code is changed to green after violating its 50 DMA line while today's loss raises concerns. It has not triggered a buy signal with a volume-driven gain above its pivot point since its late-stage base was identified in recent reports.
>>> The latest Featured Stock Update with an annotated graph appeared on 12/2/2011. Click here.
View all notes |
Alert me of new notes |
CANSLIM.net Company Profile |
SEC |
Zacks Reports |
StockTalk |
News |
Chart |
Request a new note
C
A N
S L
I M
|
V
-
NYSE
Visa Inc Cl A
DIVERSIFIED SERVICES - Business/Management Services
|
$96.36
|
+0.45
0.47% |
$96.74
|
4,787,635
90.25% of 50 DAV
50 DAV is 5,305,100
|
$98.60
-2.27%
|
10/24/2011
|
$94.21
|
PP = $94.85
|
|
MB = $99.59
|
Most Recent Note - 12/14/2011 6:03:42 PM
Y - Posted a small gain today with higher (near average) volume, bucking the mostly negative broader market. Still hovering near its 52-week high with volume totals recently cooling. Proof of serious institutional demand requires at least +50% heavier than average volume behind a meaningful gain.
>>> The latest Featured Stock Update with an annotated graph appeared on 11/18/2011. Click here.
View all notes |
Alert me of new notes |
CANSLIM.net Company Profile |
SEC |
Zacks Reports |
StockTalk |
News |
Chart |
Request a new note
C
A N
S L
I M
|
|
|
|
THESE ARE NOT BUY RECOMMENDATIONS!
Comments contained in the body of this report are technical
opinions only. The material herein has been obtained
from sources believed to be reliable and accurate, however,
its accuracy and completeness cannot be guaranteed.
This site is not an investment advisor, hence it does
not endorse or recommend any securities or other investments.
Any recommendation contained in this report may not
be suitable for all investors and it is not to be deemed
an offer or solicitation on our part with respect to
the purchase or sale of any securities. All trademarks,
service marks and trade names appearing in this report
are the property of their respective owners, and are
likewise used for identification purposes only.
This report is a service available
only to active Paid Premium Members.
You may opt-out of receiving report notifications
at any time. Questions or comments may be submitted
by writing to Premium Membership Services 665 S.E. 10 Street, Suite 201 Deerfield Beach, FL 33441-5634 or by calling 1-800-965-8307
or 954-785-1121.
|
|
|

