***Last / Change / Volume data in this table is the closing quote data***
Symbol/Exchange
Company Name
Industry Group |
PRICE |
CHANGE
(%Change) |
Day High |
Volume
(% DAV)
(% 50 day avg vol) |
52 Wk Hi
% From Hi |
Featured
Date |
Price
Featured |
Pivot Featured |
|
Max Buy |
ABV
-
NYSE
Comp De Bebidas Adr
FOOD and BEVERAGE - Beverages - Brewers
|
$144.40
|
+1.45
1.01% |
$146.62
|
593,644
95.38% of 50 DAV
50 DAV is 622,400
|
$145.36
-0.66%
|
12/10/2010
|
$139.87
|
PP = $145.46
|
|
MB = $152.73
|
 Most Recent Note - 12/15/2010 4:40:42 PM
Y - Gain today with near average volume for a new high and best-ever close. As previously noted - "A gain into new high territory with great volume conviction may trigger a new (or add-on) buy signal. Recent lows in the $133 area define important chart support to watch."
>>> The latest Featured Stock Update with an annotated graph appeared on 12/3/2010. Click here.
View all notes |
Alert me of new notes |
CANSLIM.net Company Profile |
SEC |
Zacks Reports |
StockTalk |
News |
Chart |
Request a new note
C
A N
S L
I M


|
ARUN
-
NASDAQ
Aruba Networks Inc
COMPUTER HARDWARE - Networking andamp; Communication Dev
|
$22.35
|
+0.08
0.36% |
$22.66
|
1,723,156
64.63% of 50 DAV
50 DAV is 2,666,300
|
$24.28
-7.95%
|
8/30/2010
|
$18.12
|
PP = $18.51
|
|
MB = $19.44
|
Most Recent Note - 12/14/2010 7:19:36 PM
G - Perched -8.3% off its 52-week high, consolidating near its 50 DMA line and an upward trendline. See the latest FSU analysis for more details and an annotated graph.
>>> The latest Featured Stock Update with an annotated graph appeared on 12/14/2010. Click here.
View all notes |
Alert me of new notes |
CANSLIM.net Company Profile |
SEC |
Zacks Reports |
StockTalk |
News |
Chart |
Request a new note
C
A N
S L
I M
|
BIDU
-
NASDAQ
Baidu Inc Ads
INTERNET - Internet Information Providers
|
$100.20
|
-6.42
-6.02% |
$107.44
|
21,062,784
192.70% of 50 DAV
50 DAV is 10,930,500
|
$115.04
-12.90%
|
12/10/2010
|
$108.00
|
PP = $115.14
|
|
MB = $120.90
|
Most Recent Note - 12/15/2010 5:57:32 PM
G - Color code was changed to green as its considerable loss today on nearly twice average volume indicated distributional pressure while violating its 50 DMA line and the recent chart low ( $103.11 on 11/16/10) triggering technical sell signals.
>>> The latest Featured Stock Update with an annotated graph appeared on 11/30/2010. Click here.
View all notes |
Alert me of new notes |
CANSLIM.net Company Profile |
SEC |
Zacks Reports |
StockTalk |
News |
Chart |
Request a new note
C
A N
S L
I M
|
CACC
-
NASDAQ
Credit Acceptance Corp
FINANCIAL SERVICES - Credit Services
|
$61.52
|
-0.13
-0.21% |
$61.95
|
31,525
142.00% of 50 DAV
50 DAV is 22,200
|
$63.45
-3.04%
|
11/22/2010
|
$59.97
|
PP = $62.00
|
|
MB = $65.10
|
Most Recent Note - 12/15/2010 12:27:17 PM
Y - Still hovering in a very tight range only -2.5% off its 52-week high. Its Relative Strength line has been slumping while stubbornly holding its ground since the 11/29/10 gain with +69% above average volume triggered a technical buy signal. Additional volume-driven gains into new high territory would be a reassuring sign.
>>> The latest Featured Stock Update with an annotated graph appeared on 10/29/2010. Click here.
View all notes |
Alert me of new notes |
CANSLIM.net Company Profile |
SEC |
Zacks Reports |
StockTalk |
News |
Chart |
Request a new note
C
A N
S L
I M
|
CIS
-
NYSE
Camelot Info Systems Ads
COMPUTER SOFTWARE andamp; SERVICES - Information Technology Service
|
$20.31
|
+0.06
0.30% |
$20.66
|
280,625
74.06% of 50 DAV
50 DAV is 378,900
|
$24.89
-18.40%
|
11/26/2010
|
$18.93
|
PP = $19.72
|
|
MB = $20.71
|
Most Recent Note - 12/14/2010 4:31:38 PM
G - Consolidating above its 50 DMA line since it priced a Secondary Offering on 12/10/10 in which the company received no proceeds from the sale by existing shareholders. Following a couple of damaging distribution days, it found support near prior highs in the $19.50 area previously noted as chart support to watch.
>>> The latest Featured Stock Update with an annotated graph appeared on 11/26/2010. Click here.
View all notes |
Alert me of new notes |
CANSLIM.net Company Profile |
SEC |
Zacks Reports |
StockTalk |
News |
Chart |
Request a new note
C
A N
S L
I M
|
Symbol/Exchange
Company Name
Industry Group |
PRICE |
CHANGE
(%Change) |
Day High |
Volume
(% DAV)
(% 50 day avg vol) |
52 Wk Hi
% From Hi |
Featured
Date |
Price
Featured |
Pivot Featured |
|
Max Buy |
CMG
-
NYSE
Chipotle Mexican Grill
LEISURE - Restaurants
|
$226.79
|
-1.11
-0.49% |
$234.85
|
1,096,335
104.17% of 50 DAV
50 DAV is 1,052,400
|
$262.78
-13.69%
|
9/1/2010
|
$158.31
|
PP = $155.52
|
|
MB = $163.30
|
Most Recent Note - 12/13/2010 3:41:48 PM
G - Higher volume is behind today's considerable loss following a small gain on very light volume. It is slumping toward its 50 DMA line previously noted as a chart support level to watch
>>> The latest Featured Stock Update with an annotated graph appeared on 10/28/2010. Click here.
View all notes |
Alert me of new notes |
CANSLIM.net Company Profile |
SEC |
Zacks Reports |
StockTalk |
News |
Chart |
Request a new note
C
A N
S L
I M
|
DECK
-
NASDAQ
Deckers Outdoor Corp
CONSUMER NON-DURABLES - Textile - Apparel Footwear
|
$81.78
|
+1.86
2.33% |
$83.31
|
2,196,119
122.31% of 50 DAV
50 DAV is 1,795,500
|
$85.00
-3.79%
|
10/27/2010
|
$54.16
|
PP = $54.86
|
|
MB = $57.60
|
Most Recent Note - 12/15/2010 12:31:17 PM
G - Stubbornly held its ground for the past 2 weeks near its all-time high. It has been noted as very extended from any sound base, while its 50 DMA line defines the nearest chart support.
>>> The latest Featured Stock Update with an annotated graph appeared on 10/27/2010. Click here.
View all notes |
Alert me of new notes |
CANSLIM.net Company Profile |
SEC |
Zacks Reports |
StockTalk |
News |
Chart |
Request a new note
C
A N
S L
I M
|
EZCH
-
NASDAQ
Ezchip Semiconductor Ltd
ELECTRONICS - Semiconductor - Specialized
|
$27.46
|
+0.05
0.18% |
$27.80
|
425,234
150.95% of 50 DAV
50 DAV is 281,700
|
$29.73
-7.64%
|
12/2/2010
|
$27.53
|
PP = $26.00
|
|
MB = $27.30
|
Most Recent Note - 12/14/2010 4:28:46 PM
G - Loss today with slightly above average volume, slumping toward prior chart highs in the $26 area that define an important technical support level to watch.
>>> The latest Featured Stock Update with an annotated graph appeared on 12/2/2010. Click here.
View all notes |
Alert me of new notes |
CANSLIM.net Company Profile |
SEC |
Zacks Reports |
StockTalk |
News |
Chart |
Request a new note
C
A N
S L
I M
|
EZPW
-
NASDAQ
Ezcorp Inc Cl A
SPECIALTY RETAIL - Specialty Retail, Other
|
$27.46
|
-0.13
-0.47% |
$27.89
|
307,881
92.46% of 50 DAV
50 DAV is 333,000
|
$28.27
-2.87%
|
11/5/2010
|
$24.02
|
PP = $23.85
|
|
MB = $25.04
|
Most Recent Note - 12/15/2010 4:37:14 PM
G - Perched near an all-time high, stubbornly holding its ground after recent volume-driven gains, extended from any sound base pattern. Its 50 DMA line defines support above prior highs in the $22-23 area.
>>> The latest Featured Stock Update with an annotated graph appeared on 11/6/2010. Click here.
View all notes |
Alert me of new notes |
CANSLIM.net Company Profile |
SEC |
Zacks Reports |
StockTalk |
News |
Chart |
Request a new note
C
A N
S L
I M
|
FFIV
-
NASDAQ
F 5 Networks Inc
INTERNET - Internet Software and Services
|
$130.38
|
-3.27
-2.45% |
$135.99
|
3,767,024
126.16% of 50 DAV
50 DAV is 2,985,800
|
$143.75
-9.30%
|
6/16/2010
|
$74.50
|
PP = $74.10
|
|
MB = $77.81
|
Most Recent Note - 12/15/2010 4:27:38 PM
G - Closed near the session low with a loss on higher volume. Repeatedly noted as extended from any sound base pattern. Its 50 DMA line (now $118)defines chart support to watch.
>>> The latest Featured Stock Update with an annotated graph appeared on 11/15/2010. Click here.
View all notes |
Alert me of new notes |
CANSLIM.net Company Profile |
SEC |
Zacks Reports |
StockTalk |
News |
Chart |
Request a new note
C
A N
S L
I M
|
Symbol/Exchange
Company Name
Industry Group |
PRICE |
CHANGE
(%Change) |
Day High |
Volume
(% DAV)
(% 50 day avg vol) |
52 Wk Hi
% From Hi |
Featured
Date |
Price
Featured |
Pivot Featured |
|
Max Buy |
FOSL
-
NASDAQ
Fossil Inc
CONSUMER DURABLES - Recreational Goods, Other
|
$71.36
|
-1.43
-1.96% |
$73.36
|
625,289
77.17% of 50 DAV
50 DAV is 810,300
|
$74.34
-4.01%
|
11/26/2010
|
$69.10
|
PP = $70.17
|
|
MB = $73.68
|
Most Recent Note - 12/15/2010 4:31:13 PM
Y - Consolidating above prior highs after a technical breakout on 12/02/10 from an advanced "3-weeks tight" pattern.
>>> The latest Featured Stock Update with an annotated graph appeared on 11/29/2010. Click here.
View all notes |
Alert me of new notes |
CANSLIM.net Company Profile |
SEC |
Zacks Reports |
StockTalk |
News |
Chart |
Request a new note
C
A N
S L
I M
|
HMSY
-
NASDAQ
H M S Holdings Corp
COMPUTER SOFTWARE and SERVICES - Healthcare Information Service
|
$64.14
|
-1.03
-1.58% |
$65.00
|
235,214
117.78% of 50 DAV
50 DAV is 199,700
|
$67.01
-4.28%
|
11/19/2010
|
$61.89
|
PP = $63.01
|
|
MB = $66.16
|
Most Recent Note - 12/15/2010 4:33:56 PM
G - Loss today with above average volume indicates distributional pressure, closing near the session low. Prior highs near $62 define initial chart support to watch above its 50 DMA line. Its Relative Strength rank has slumped to 77, below the 80+ guideline.
>>> The latest Featured Stock Update with an annotated graph appeared on 11/19/2010. Click here.
View all notes |
Alert me of new notes |
CANSLIM.net Company Profile |
SEC |
Zacks Reports |
StockTalk |
News |
Chart |
Request a new note
C
A N
S L
I M
|
HS
-
NYSE
Healthspring Inc
HEALTH SERVICES - Health Care Plans
|
$27.41
|
-0.52
-1.86% |
$27.99
|
606,934
108.87% of 50 DAV
50 DAV is 557,500
|
$29.80
-8.02%
|
8/27/2010
|
$19.91
|
PP = $19.75
|
|
MB = $20.74
|
Most Recent Note - 12/13/2010 3:46:33 PM
G - Higher volume is behind today's considerable loss following a small gain on very light volume. It is slumping toward its 50 DMA line previously noted as a chart support level to watch. A violation of its recent low ($26.47 on 11/29/10) would raise greater concerns and trigger a technical sell signal. See the latest FSU analysis for more details and an annotated graph.
>>> The latest Featured Stock Update with an annotated graph appeared on 12/10/2010. Click here.
View all notes |
Alert me of new notes |
CANSLIM.net Company Profile |
SEC |
Zacks Reports |
StockTalk |
News |
Chart |
Request a new note
C
A N
S L
I M
|
JOBS
-
NASDAQ
Fifty One Job Inc Ads
DIVERSIFIED SERVICES - Staffing and; Outsourcing Service
|
$49.60
|
-0.70
-1.39% |
$49.86
|
184,893
95.90% of 50 DAV
50 DAV is 192,800
|
$55.50
-10.63%
|
10/13/2010
|
$42.07
|
PP = $40.60
|
|
MB = $42.63
|
Most Recent Note - 12/13/2010 1:48:40 PM
G - Pulling back today after recently challenging its all-time high near $55 from 2004. It is extended from any sound base, and a steep upward trendline defines initial support to watch above its 50 DMA line.
>>> The latest Featured Stock Update with an annotated graph appeared on 11/16/2010. Click here.
View all notes |
Alert me of new notes |
CANSLIM.net Company Profile |
SEC |
Zacks Reports |
StockTalk |
News |
Chart |
Request a new note
C
A N
S L
I M
|
LULU
-
NASDAQ
Lululemon Athletica
MANUFACTURING - Textile Manufacturing
|
$68.64
|
+0.84
1.24% |
$70.25
|
3,104,332
197.48% of 50 DAV
50 DAV is 1,572,000
|
$73.48
-6.59%
|
10/8/2010
|
$47.66
|
PP = $46.67
|
|
MB = $49.00
|
Most Recent Note - 12/15/2010 4:43:47 PM
G - Holding its ground stubbornly after a streak of 3 consecutive gap up gains to new all-time highs. Since blasting above its 2007 high it has gotten very extended from any sound base.
>>> The latest Featured Stock Update with an annotated graph appeared on 12/1/2010. Click here.
View all notes |
Alert me of new notes |
CANSLIM.net Company Profile |
SEC |
Zacks Reports |
StockTalk |
News |
Chart |
Request a new note
C
A N
S L
I M
|
Symbol/Exchange
Company Name
Industry Group |
PRICE |
CHANGE
(%Change) |
Day High |
Volume
(% DAV)
(% 50 day avg vol) |
52 Wk Hi
% From Hi |
Featured
Date |
Price
Featured |
Pivot Featured |
|
Max Buy |
MWIV
-
NASDAQ
M W I Veterinary Supply
HEALTH SERVICES - Medical Instruments and; Supplies
|
$61.81
|
+0.31
0.50% |
$61.74
|
65,645
117.64% of 50 DAV
50 DAV is 55,800
|
$63.94
-3.33%
|
11/4/2010
|
$61.79
|
PP = $59.60
|
|
MB = $62.58
|
Most Recent Note - 12/14/2010 4:45:05 PM
Y - Rising from support at its 50 DMA line, now -3.8% off its 52-week high. Volume totals have been drying up since hitting its all-time high on 11/04/10. Its short-term average and an upward trendline connecting its May - August lows define chart support levels to watch.
>>> The latest Featured Stock Update with an annotated graph appeared on 11/2/2010. Click here.
View all notes |
Alert me of new notes |
CANSLIM.net Company Profile |
SEC |
Zacks Reports |
StockTalk |
News |
Chart |
Request a new note
C
A N
S L
I M
|
NEOG
-
NASDAQ
Neogen Corp
DRUGS - Diagnostic Substances
|
$41.35
|
+1.38
3.45% |
$40.00
|
162,607
221.54% of 50 DAV
50 DAV is 73,400
|
$40.27
2.68%
|
9/1/2010
|
$30.79
|
PP = $30.49
|
|
MB = $32.01
|
Most Recent Note - 12/15/2010 12:48:23 PM
G - Considerable gain today with above average volume for another new all-time high. Extended from any sound base after steadily advancing. Its 50 DMA line has been a reliable support level.
>>> The latest Featured Stock Update with an annotated graph appeared on 12/6/2010. Click here.
View all notes |
Alert me of new notes |
CANSLIM.net Company Profile |
SEC |
Zacks Reports |
StockTalk |
News |
Chart |
Request a new note
C
A N
S L
I M
|
NFLX
-
NASDAQ
Netflix Inc
SPECIALTY RETAIL - Music and Video Stores
|
$178.50
|
+0.05
0.03% |
$182.70
|
6,338,533
105.94% of 50 DAV
50 DAV is 5,983,100
|
$206.80
-13.68%
|
11/9/2010
|
$173.10
|
PP = $184.84
|
|
MB = $194.08
|
Most Recent Note - 12/13/2010 1:49:45 PM
G - Holding its ground above prior highs in the $184 area after recent negative reversals and distributional pressure raised concerns. An upward trendline connecting its July - November lows defines initial support to watch above its 50 DMA line.
>>> The latest Featured Stock Update with an annotated graph appeared on 11/24/2010. Click here.
View all notes |
Alert me of new notes |
CANSLIM.net Company Profile |
SEC |
Zacks Reports |
StockTalk |
News |
Chart |
Request a new note
C
A N
S L
I M
|
NTAP
-
NASDAQ
Netapp Inc
COMPUTER HARDWARE - Data Storage Devices
|
$52.67
|
-0.82
-1.53% |
$55.51
|
5,690,644
85.57% of 50 DAV
50 DAV is 6,650,000
|
$57.96
-9.13%
|
9/8/2010
|
$46.98
|
PP = $44.99
|
|
MB = $47.24
|
Most Recent Note - 12/14/2010 4:34:13 PM
G - Consolidating above its 50 DMA line, working on a new base.
>>> The latest Featured Stock Update with an annotated graph appeared on 11/3/2010. Click here.
View all notes |
Alert me of new notes |
CANSLIM.net Company Profile |
SEC |
Zacks Reports |
StockTalk |
News |
Chart |
Request a new note
C
A N
S L
I M
|
ORCL
-
NASDAQ
Oracle Corp
COMPUTER SOFTWARE and SERVICES - Application Software
|
$30.49
|
-0.02
-0.07% |
$30.75
|
30,519,306
96.46% of 50 DAV
50 DAV is 31,638,400
|
$30.75
-0.85%
|
12/7/2010
|
$29.05
|
PP = $29.92
|
|
MB = $31.42
|
Most Recent Note - 12/14/2010 4:37:06 PM
Y - Up today on lighter volume, while +42% above average volume was behind the prior session's gain for a new 52-week high above the new pivot point recently cited. Volume should be at least +40-50% above average behind gains, preferably even greater, to trigger a convincing new (or add-on) technical buy signal.
>>> The latest Featured Stock Update with an annotated graph appeared on 11/18/2010. Click here.
View all notes |
Alert me of new notes |
CANSLIM.net Company Profile |
SEC |
Zacks Reports |
StockTalk |
News |
Chart |
Request a new note
C
A N
S L
I M
|
Symbol/Exchange
Company Name
Industry Group |
PRICE |
CHANGE
(%Change) |
Day High |
Volume
(% DAV)
(% 50 day avg vol) |
52 Wk Hi
% From Hi |
Featured
Date |
Price
Featured |
Pivot Featured |
|
Max Buy |
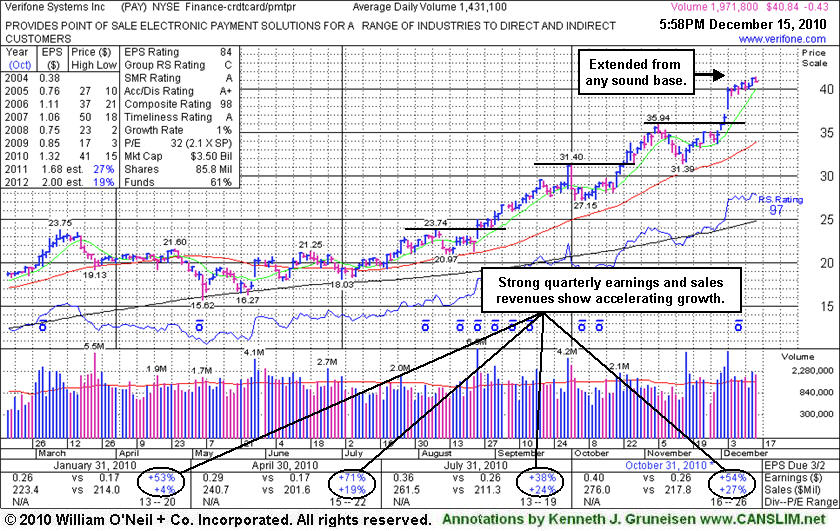
PAY
-
NYSE
Verifone Systems Inc
COMPUTER HARDWARE - Transaction Automation Systems
|
$40.84
|
-0.43
-1.04% |
$41.33
|
1,972,724
137.85% of 50 DAV
50 DAV is 1,431,100
|
$41.33
-1.19%
|
11/29/2010
|
$33.96
|
PP = $36.04
|
|
MB = $37.84
|
Most Recent Note - 12/14/2010 4:43:27 PM
G - Gain today with above average volume for a new high, getting more extended from a sound base. Prior high in the $36 area defines initial chart support to watch above its 50 DMA line.
>>> The latest Featured Stock Update with an annotated graph appeared on 12/15/2010. Click here.
View all notes |
Alert me of new notes |
CANSLIM.net Company Profile |
SEC |
Zacks Reports |
StockTalk |
News |
Chart |
Request a new note
C
A N
S L
I M
|
RAX
-
NYSE
Rackspace Hosting Inc
INTERNET - Internet Software and; Services
|
$31.12
|
-0.37
-1.17% |
$32.15
|
1,294,474
61.29% of 50 DAV
50 DAV is 2,112,200
|
$32.69
-4.80%
|
9/21/2010
|
$22.84
|
PP = $23.61
|
|
MB = $24.79
|
Most Recent Note - 12/13/2010 3:53:24 PM
G - Volume was almost 3 times its average daily volume total on the prior session as it hit a new all-time high, and it is poised for another new high close today. No resistance remains due to overhead supply, but it is extended from any sound base.
>>> The latest Featured Stock Update with an annotated graph appeared on 11/17/2010. Click here.
View all notes |
Alert me of new notes |
CANSLIM.net Company Profile |
SEC |
Zacks Reports |
StockTalk |
News |
Chart |
Request a new note
C
A N
S L
I M
|
ROVI
-
NASDAQ
Rovi Corp
COMPUTER SOFTWARE andamp; SERVICES - Security Software andamp; Services
|
$56.94
|
+0.78
1.39% |
$57.35
|
1,444,235
133.45% of 50 DAV
50 DAV is 1,082,200
|
$58.68
-2.97%
|
10/29/2010
|
$49.99
|
PP = $53.10
|
|
MB = $55.76
|
Most Recent Note - 12/13/2010 5:58:32 PM
G - Extended from its latest base after wedging to highs without great volume conviction. Prior chart highs and its 50 DMA line define important support to watch. See the latest FSU analysis for more details and an annotated graph.
>>> The latest Featured Stock Update with an annotated graph appeared on 12/13/2010. Click here.
View all notes |
Alert me of new notes |
CANSLIM.net Company Profile |
SEC |
Zacks Reports |
StockTalk |
News |
Chart |
Request a new note
C
A N
S L
I M
|
SHOO
-
NASDAQ
Steven Madden Limited
CONSUMER NON-DURABLES - Textile - Apparel Footwear
|
$43.77
|
-1.56
-3.44% |
$46.04
|
732,083
196.22% of 50 DAV
50 DAV is 373,100
|
$47.69
-8.22%
|
11/23/2010
|
$44.61
|
PP = $44.95
|
|
MB = $47.20
|
Most Recent Note - 12/15/2010 4:12:13 PM
G - Considerable loss on heavier volume today raised concerns as it finished below its old high close, completely negating the latest breakout. It sank near its 50 DMA line which acted as a support level recently.
>>> The latest Featured Stock Update with an annotated graph appeared on 11/23/2010. Click here.
View all notes |
Alert me of new notes |
CANSLIM.net Company Profile |
SEC |
Zacks Reports |
StockTalk |
News |
Chart |
Request a new note
C
A N
S L
I M
|
SLW
-
NYSE
Silver Wheaton Corp
METALS and; MINING - Silver
|
$37.91
|
-1.25
-3.19% |
$39.71
|
9,233,750
90.87% of 50 DAV
50 DAV is 10,161,700
|
$42.34
-10.46%
|
8/25/2010
|
$21.40
|
PP = $21.99
|
|
MB = $23.09
|
Most Recent Note - 12/15/2010 4:15:07 PM
G - Extended from any sound base, consolidating after a negative reversal at an all-time high on 12/07/10. Prior chart highs in the $36-37 area that define initial support well above its 50 DMA line.
>>> The latest Featured Stock Update with an annotated graph appeared on 12/8/2010. Click here.
View all notes |
Alert me of new notes |
CANSLIM.net Company Profile |
SEC |
Zacks Reports |
StockTalk |
News |
Chart |
Request a new note
C
A N
S L
I M
|
Symbol/Exchange
Company Name
Industry Group |
PRICE |
CHANGE
(%Change) |
Day High |
Volume
(% DAV)
(% 50 day avg vol) |
52 Wk Hi
% From Hi |
Featured
Date |
Price
Featured |
Pivot Featured |
|
Max Buy |
UA
-
NYSE
Under Armour Inc Cl A
CONSUMER NON-DURABLES - Textile - Apparel Clothing
|
$54.78
|
-1.97
-3.47% |
$59.84
|
2,452,975
339.09% of 50 DAV
50 DAV is 723,400
|
$60.14
-8.91%
|
9/9/2010
|
$39.99
|
PP = $40.10
|
|
MB = $42.11
|
Most Recent Note - 12/15/2010 1:31:22 PM
G - Considerable loss today with even heavier volume marks its 3rd straight day of distributional pressure. The high-ranked Apparel - Clothing firm was repeatedly noted as extended from any sound base and well above support at its 50 DMA line.
>>> The latest Featured Stock Update with an annotated graph appeared on 11/4/2010. Click here.
View all notes |
Alert me of new notes |
CANSLIM.net Company Profile |
SEC |
Zacks Reports |
StockTalk |
News |
Chart |
Request a new note
C
A N
S L
I M
|
ULTA
-
NASDAQ
Ulta Salon Cosm & Frag
SPECIALTY RETAIL - Specialty Retail, Other
|
$32.79
|
-0.37
-1.12% |
$34.21
|
857,455
165.69% of 50 DAV
50 DAV is 517,500
|
$37.24
-11.95%
|
9/3/2010
|
$26.36
|
PP = $25.89
|
|
MB = $27.18
|
Most Recent Note - 12/15/2010 4:24:42 PM
G - Today's 4th consecutive loss was marked by heavier volume, indicative of distributional pressure while slumping toward its 50 DMA line which defines initial support to watch.
>>> The latest Featured Stock Update with an annotated graph appeared on 11/1/2010. Click here.
View all notes |
Alert me of new notes |
CANSLIM.net Company Profile |
SEC |
Zacks Reports |
StockTalk |
News |
Chart |
Request a new note
C
A N
S L
I M
|
VIT
-
NYSE
Vanceinfo Tech Inc Ads
COMPUTER SOFTWARE and SERVICES - Business Software and Services
|
$34.13
|
-0.88
-2.51% |
$36.44
|
1,337,069
203.85% of 50 DAV
50 DAV is 655,900
|
$41.06
-16.88%
|
7/8/2010
|
$25.20
|
PP = $26.58
|
|
MB = $27.91
|
Most Recent Note - 12/15/2010 4:19:20 PM
G - Loss with above average volume today raised concerns while slumping further below its 50 DMA line, a sign of more worrisome distributional pressure. Relative Strength has slumped since it completed a Public Offering on 11/23/10.
>>> The latest Featured Stock Update with an annotated graph appeared on 12/9/2010. Click here.
View all notes |
Alert me of new notes |
CANSLIM.net Company Profile |
SEC |
Zacks Reports |
StockTalk |
News |
Chart |
Request a new note
C
A N
S L
I M
|