You are not logged in.
This means you
CAN ONLY VIEW reports that were published prior to Tuesday, April 15, 2025.
You
MUST UPGRADE YOUR MEMBERSHIP if you want to see any current reports.
AFTER MARKET UPDATE - THURSDAY, DECEMBER 16TH, 2010
Previous After Market Report Next After Market Report >>>
|
|
|
|
DOW |
+41.78 |
11,499.25 |
+0.36% |
|
Volume |
1,011,610,861 |
-10% |
|
Volume |
1,754,358,806 |
-7% |
|
NASDAQ |
+20.09 |
2,637.31 |
+0.77% |
|
Advancers |
2,053 |
66% |
|
Advancers |
1,810 |
65% |
|
S&P 500 |
+7.64 |
1,242.87 |
+0.62% |
|
Decliners |
971 |
31% |
|
Decliners |
824 |
30% |
|
Russell 2000 |
+8.20 |
776.56 |
+1.07% |
|
52 Wk Highs |
126 |
|
|
52 Wk Highs |
169 |
|
|
S&P 600 |
+4.44 |
412.79 |
+1.09% |
|
52 Wk Lows |
26 |
|
|
52 Wk Lows |
21 |
|
|
 |
Major Averages Rose But Volume And New Highs Totals Did Not
Kenneth J. Gruneisen - Passed the CAN SLIM® Master's Exam
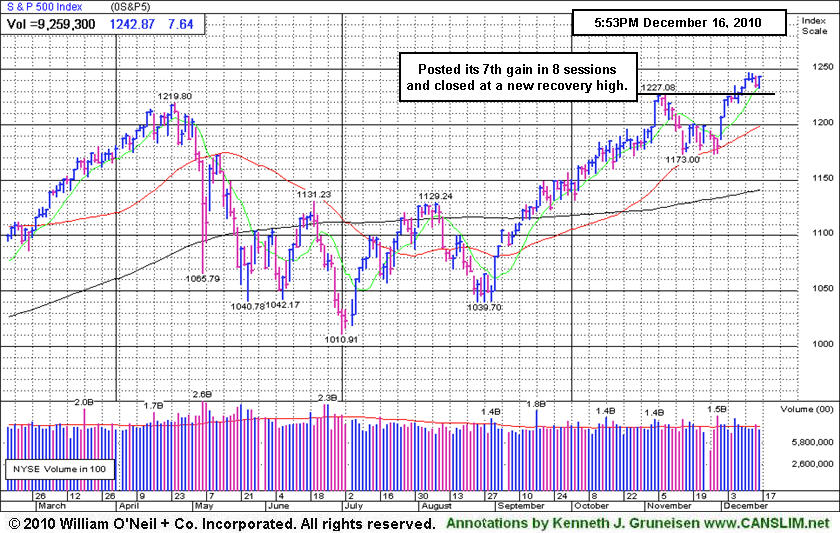
The major averages rose on Thursday while volume totals cooled on the Nasdaq exchange and NYSE. Lighter volume suggested that institutional investors were not aggressively buying shares, yet advancing issues led decliners by more than a 2-1 on the NYSE and on the Nasdaq exchange. Leadership did not expand meaningfully as the total of 33 high-ranked companies from the CANSLIM.net Leaders List made new 52-week highs and appeared on the CANSLIM.net BreakOuts Page, down from the total of 35 issues on the prior session. New 52-week highs solidly outnumbered new 52-week lows on the NYSE and on the Nasdaq exchange, however the new highs totals on both exchanges have generally been cooling in recent weeks. Of the 28 high-ranked leaders currently listed on the Featured Stocks Page, the best gainer was Ulta Salon Cosm & Frag (ULTA +3.96%).
Positive economic data helped the markets shrug off weak commodity prices. Reports on the labor market, mid-Atlantic factory activity and the housing industry were all better than expected. Housing starts increased for the first time in three months, while a surprise decline in initial jobless claims continued a recent trend. Energy and mining stocks were weak as commodity prices dropped. Gold was under pressure as some investors sold to take advantage of the metal’s rally this year. The U.S. market had many on edge and eyeing Europe, where leaders discussed the debt crisis on the continent.
FedEx Corp (FDX +2%) hiked its full year outlook on strong holiday volume, and it rose even though quarterly results missed expectations. The shipping company's encouraging forecast had a positive impact on shares of Amazon.com (AMZN +1.4%). Bank of America Corp (BAC +1.87%) rose following news that it started settlement talks with mortgage investors. Credit card companies were a drag on financial stocks. Visa Inc (V -12.7%) and MasterCard Inc (MA -10.3%) became targets in the war on the productive class as the Federal Reserve staff proposed rules that could cut debit card interchange fees by 90%.
PICTURED: The S&P 500 Index rose for the seventh time in eight sessions and closed at a new recovery high.
|
 Kenneth J. Gruneisen started out as a licensed stockbroker in August 1987, a couple of months prior to the historic stock market crash that took the Dow Jones Industrial Average down -22.6% in a single day. He has published daily fact-based fundamental and technical analysis on high-ranked stocks online for two decades. Through FACTBASEDINVESTING.COM, Kenneth provides educational articles, news, market commentary, and other information regarding proven investment systems that work in good times and bad.
Comments contained in the body of this report are technical opinions only and are not necessarily those of Gruneisen Growth Corp. The material herein has been obtained from sources believed to be reliable and accurate, however, its accuracy and completeness cannot be guaranteed. Our firm, employees, and customers may effect transactions, including transactions contrary to any recommendation herein, or have positions in the securities mentioned herein or options with respect thereto. Any recommendation contained in this report may not be suitable for all investors and it is not to be deemed an offer or solicitation on our part with respect to the purchase or sale of any securities. |
|
 |
Tech, Retail, and Healthcare Groups Rise
Kenneth J. Gruneisen - Passed the CAN SLIM® Master's Exam
Strength in the tech sector helped the Nasdaq Composite Index lead its peers as the Networking Index ($NWX +2.15%) and Biotechnology Index ($BTK +1.59%) outpaced the Internet Index ($IIX +0.95%) and the Semiconductor Index ($SOX +0.66%). The energy-related indices posted modest gains as the Oil Services Index ($OSX +0.41%) and Integrated Oil Index ($XOI +0.61%) rose. The Retail Index ($RLX +1.04%) also had a positive influence on the major averages and modest gains fromn the Bank Index ($BKX +0.18%) and Broker/Dealer Index ($XBD +0.31%) helped underpin the market's gains. The Gold & Silver Index ($XAU -1.32%) was a standout laggard.
Charts courtesy www.stockcharts.com
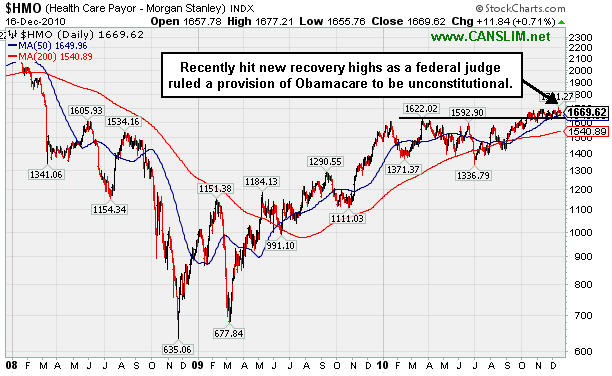
PICTURED: The Healthcare Index ($HMO +0.71%) recently hit new recovery highs as a federal judge ruled a provision of Obamacare to be unconstitutional.
| Oil Services |
$OSX |
237.28 |
+0.97 |
+0.41% |
+21.73% |
| Healthcare |
$HMO |
1,669.62 |
+11.83 |
+0.71% |
+13.35% |
| Integrated Oil |
$XOI |
1,170.07 |
+7.07 |
+0.61% |
+9.54% |
| Semiconductor |
$SOX |
408.71 |
+2.68 |
+0.66% |
+13.56% |
| Networking |
$NWX |
280.07 |
+5.90 |
+2.15% |
+21.21% |
| Internet |
$IIX |
310.85 |
+2.93 |
+0.95% |
+32.92% |
| Broker/Dealer |
$XBD |
118.11 |
+0.37 |
+0.31% |
+2.66% |
| Retail |
$RLX |
507.94 |
+5.24 |
+1.04% |
+23.55% |
| Gold & Silver |
$XAU |
218.29 |
-2.91 |
-1.32% |
+29.74% |
| Bank |
$BKX |
49.48 |
+0.09 |
+0.18% |
+15.85% |
| Biotech |
$BTK |
1,208.97 |
+18.93 |
+1.59% |
+28.32% |
|
|
|
 |
Recent Consolidation May Be A New Advanced "3-Weeks Tight" Type Pattern
Kenneth J. Gruneisen - Passed the CAN SLIM® Master's Exam
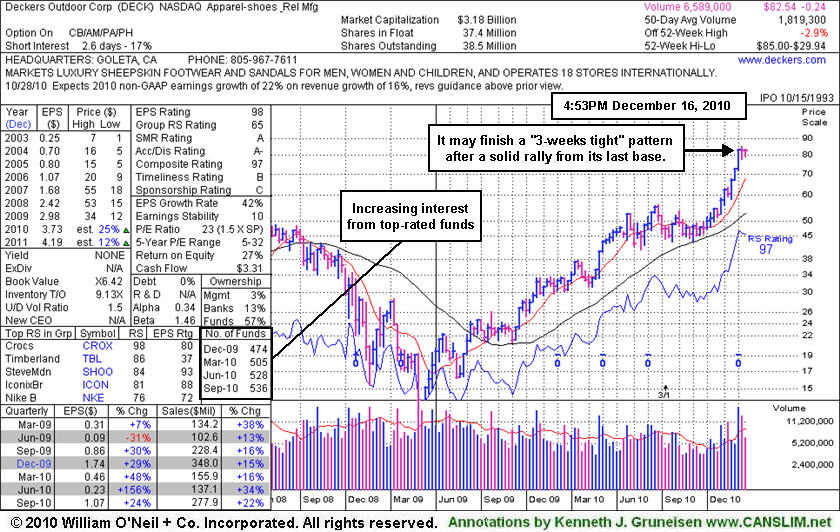
Deckers Outdoor Corp (DECK +$0.80 or +0.98% to $82.58) has been stubbornly holding its ground for the past 2 weeks near its all-time high. Volume totals have been cooling while it may be forming a "3-weeks tight" type pattern. Its 50-day moving average (DMA) line defines the nearest chart support level. The number of top-rated funds owning its shares rose from 474 in Dec '09 to 536 as of Sep '10, a reassuring sign concerning the investment system's I criteria.
At its last appearance in this FSU section on 10/2710 under the headline "Bullish Action Ahead Of Earnings News Pending" it was perched within close striking distance of its 52-week high. It had been featured in yellow in the mid-day report (read here) while pulling back while noted - "Technically, it broke out from a saucer-with-handle pattern with above average volume on the prior session. The pivot point cited is based upon its 10/15/10 high plus ten cents. No overhead supply remains to hinder its progress. Confirming gains into new all-time high ground with above average volume would be a very reassuring sign."
Earnings were above the +25% minimum guideline in the 5 latest comparisons versus the year ago periods, satisfying the C criteria. This apparel firm has a great annual earnings history (A criteria). Even after a 3:1 split earlier this year, it still has a small supply of only 38.5 million shares outstanding (S criteria), which makes it prone to be a volatile stock in the event of institutional accumulation or distribution. The small supply is favorable, provided proper discipline is used. Disciplined investors avoid chasing extended stocks more than +5% above prior chart highs, and always limit losses by selling if a stock falls -7% from their purchase price to prevent a more damaging loss.
|
|
|
Color Codes Explained :
Y - Better candidates highlighted by our
staff of experts.
G - Previously featured
in past reports as yellow but may no longer be buyable under the
guidelines.
***Last / Change / Volume data in this table is the closing quote data***
|
|
|
THESE ARE NOT BUY RECOMMENDATIONS!
Comments contained in the body of this report are technical
opinions only. The material herein has been obtained
from sources believed to be reliable and accurate, however,
its accuracy and completeness cannot be guaranteed.
This site is not an investment advisor, hence it does
not endorse or recommend any securities or other investments.
Any recommendation contained in this report may not
be suitable for all investors and it is not to be deemed
an offer or solicitation on our part with respect to
the purchase or sale of any securities. All trademarks,
service marks and trade names appearing in this report
are the property of their respective owners, and are
likewise used for identification purposes only.
This report is a service available
only to active Paid Premium Members.
You may opt-out of receiving report notifications
at any time. Questions or comments may be submitted
by writing to Premium Membership Services 665 S.E. 10 Street, Suite 201 Deerfield Beach, FL 33441-5634 or by calling 1-800-965-8307
or 954-785-1121.
|
|
|

