You are not logged in.
This means you
CAN ONLY VIEW reports that were published prior to Monday, April 14, 2025.
You
MUST UPGRADE YOUR MEMBERSHIP if you want to see any current reports.
AFTER MARKET UPDATE - TUESDAY, DECEMBER 13TH, 2011
Previous After Market Report Next After Market Report >>>
|
|
|
|
DOW |
-66.45 |
11,954.94 |
-0.55% |
|
Volume |
926,529,090 |
+19% |
|
Volume |
1,718,036,390 |
+14% |
|
NASDAQ |
-32.99 |
2,579.27 |
-1.26% |
|
Advancers |
668 |
21% |
|
Advancers |
576 |
22% |
|
S&P 500 |
-10.74 |
1,225.73 |
-0.87% |
|
Decliners |
2,337 |
75% |
|
Decliners |
1,959 |
74% |
|
Russell 2000 |
-15.09 |
718.06 |
-2.06% |
|
52 Wk Highs |
64 |
|
|
52 Wk Highs |
43 |
|
|
S&P 600 |
-7.35 |
401.05 |
-1.80% |
|
52 Wk Lows |
63 |
|
|
52 Wk Lows |
84 |
|
|
 |
Major Averages Erased Early Gains and Ended Lower
Kenneth J. Gruneisen - Passed the CAN SLIM® Master's Exam
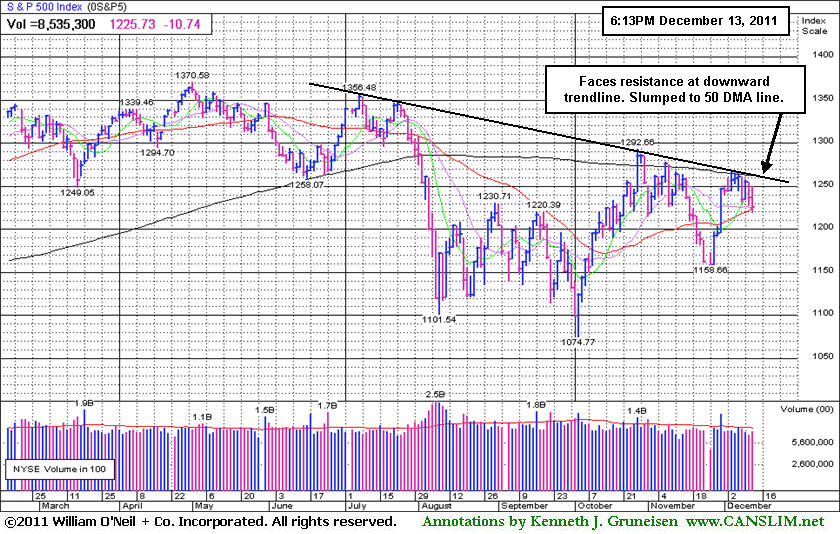
It appeared that institutional selling picked up as Tuesday's early gains for the major averages were erased and turned into losses. Volume totals were reported higher on the NYSE and on the Nasdaq exchange versus Monday's session totals. Decliners led advancers by more than 3-1 on the NYSE and on the Nasdaq exchange. New 52-week highs essentially matched new 52-week lows on the NYSE, and new lows easily led new highs on the Nasdaq exchange. There were 29 high-ranked companies from the CANSLIM.net Leaders List that made new 52-week highs and appeared on the CANSLIM.net BreakOuts Page, up from the prior session total of 12 stocks. At the session close there were gains for only 2 of the 18 high-ranked companies currently included on the Featured Stocks Page.
Stocks rallied early despite mixed economic data, but gradually lost ground following comments out of Berlin. On the economic front, November retail sales rose 0.2%, missing expectations by 0.3%. Additionally, small business confidence improved as the National Federation of Independent survey rose to 92. Business inventory numbers also hit the tape, rising 0.8%. Stocks lost steam following German Chancellor Angela Merkel's refusal to extend the euro bailout fund. Separately, comments from the Fed had no positive impact in the day's trading activity as the Fed indicated no further quantitative easing measures were planned.
Energy stocks posted small gains as oil rose to $99.65 per barrel on Iran's plans to conduct naval drills through a heavily trafficked oil waterway. Consumer stocks were pinched following the disappointing retail sales figures, with Amazon.com Inc (AMZN -4.75%) and Macy's Inc (M -4.98%) falling. Best Buy Co Inc (BBY -15.46%) tumbled after posting earnings well below consensus expectations. Jive Software Inc (JIVE +25.42%) rallied in its debut.
Our monthly newsletter CANSLIM.net News will be published soon with an informative review of current market conditions, leading groups, and best buy candidates. Via the Premium Member Homepage links to all prior reports and webcasts are always available.
PICTURED: The S&P 500 Index slumped near its 50-day moving average line. It faces near-term resistance at a downward trendline connecting prior chart highs.
|
 Kenneth J. Gruneisen started out as a licensed stockbroker in August 1987, a couple of months prior to the historic stock market crash that took the Dow Jones Industrial Average down -22.6% in a single day. He has published daily fact-based fundamental and technical analysis on high-ranked stocks online for two decades. Through FACTBASEDINVESTING.COM, Kenneth provides educational articles, news, market commentary, and other information regarding proven investment systems that work in good times and bad.
Comments contained in the body of this report are technical opinions only and are not necessarily those of Gruneisen Growth Corp. The material herein has been obtained from sources believed to be reliable and accurate, however, its accuracy and completeness cannot be guaranteed. Our firm, employees, and customers may effect transactions, including transactions contrary to any recommendation herein, or have positions in the securities mentioned herein or options with respect thereto. Any recommendation contained in this report may not be suitable for all investors and it is not to be deemed an offer or solicitation on our part with respect to the purchase or sale of any securities. |
|
 |
Tech, Retail, Financial, and Defensive Groups Fell
Kenneth J. Gruneisen - Passed the CAN SLIM® Master's Exam
The Gold & Silver Index ($XAU -3.08%) led declining groups on Tuesday, and the Healthcare Index ($HMO -1.22%) also ended lower as defensive groups gave investors nothing to brag about. The Retail Index ($RLX -2.66%) and the tech sector faced pressure as the Semiconductor Index ($SOX -2.36%), Networking Index ($NWX -2.33%), Biotechnology Index ($BTK -1.42%), and Internet Index ($IIX -1.93%) suffered unanimous losses. Financial shares also weighed on the major averages as the Broker/Dealer Index ($XBD -1.56%) and Bank Index ($BKX -1.55%) sagged. The Oil Services Index ($OSX -1.94%) ended lower and the Integrated Oil Index ($XOI -0.32%) also finished with a small loss.
Charts courtesy www.stockcharts.com

PICTURED: The Retail Index ($RLX -2.66%) violated its 50-day moving average (DMA) line and fell toward an upward trendline connecting prior low closes.
| Oil Services |
$OSX |
218.06 |
-4.32 |
-1.94% |
-11.04% |
| Healthcare |
$HMO |
2,194.61 |
-27.16 |
-1.22% |
+29.71% |
| Integrated Oil |
$XOI |
1,195.42 |
-3.81 |
-0.32% |
-1.46% |
| Semiconductor |
$SOX |
356.53 |
-8.62 |
-2.36% |
-13.43% |
| Networking |
$NWX |
214.43 |
-5.11 |
-2.33% |
-23.57% |
| Internet |
$IIX |
277.89 |
-5.47 |
-1.93% |
-9.70% |
| Broker/Dealer |
$XBD |
82.85 |
-1.31 |
-1.56% |
-31.82% |
| Retail |
$RLX |
519.29 |
-14.19 |
-2.66% |
+2.15% |
| Gold & Silver |
$XAU |
187.82 |
-5.96 |
-3.08% |
-17.11% |
| Bank |
$BKX |
37.58 |
-0.59 |
-1.55% |
-28.02% |
| Biotech |
$BTK |
1,027.32 |
-14.78 |
-1.42% |
-20.83% |
|
|
|
 |
Possible Base-On Base Pattern Forming
Kenneth J. Gruneisen - Passed the CAN SLIM® Master's Exam
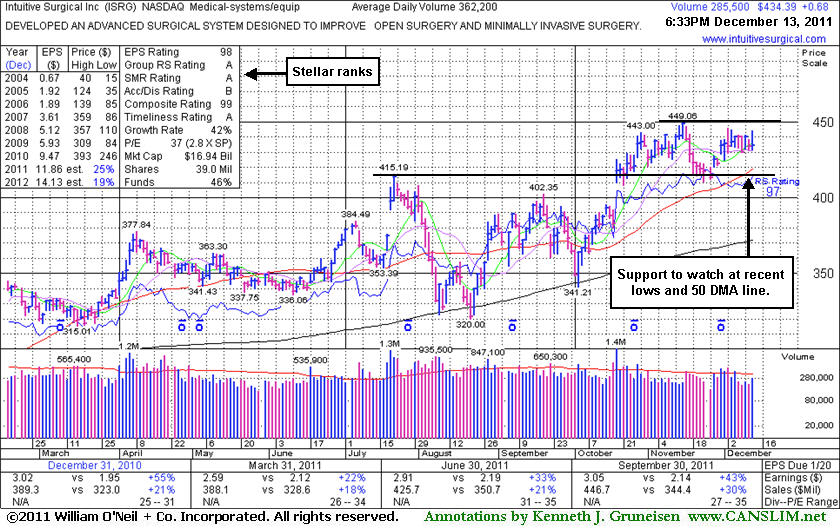
Intuitive Surgical Inc (ISRG +$0.68 or +0.16% to $434.39) is consolidating within close striking distance of its all-time high. It may be forming a base-on-base type pattern, but the latest consolidation has been on the brief side so a new pivot point is not being cited. Market conditions (M criteria) also are a concern until a more robust rally is confirmed. It found support recently well above its 50-day moving average (DMA) line near prior chart highs. Those levels define important chart support to watch now.
It marked its all-time high with its last appearance in this FSU section on 11/15/11 with an annotated graph included under the headline, "Volume Totals Cooling Following Recent Breakout." It reported earnings +43% on +30% sales revenues for the quarter ended September 30, 2011 versus the year ago period. Accelerating sales revenues and earnings increases in recent quarterly comparisons are a reassuring sign, and it has a great annual earnings (A criteria) history. This company's small supply (S criteria) of only 39 million shares outstanding can lead to greater volatility in the event of any abrupt institutional buying or selling. The number of top-rated funds owning its shares increased from 918 in Dec '10 to 1,075 in Sep '11. Its annual earnings history (the A criteria) has been very impressive.
An earlier appearance in this FSU section was on 5/03/10 with an annotated graph included under the headline, "Sales Revenues And Earnings Showed Acceleration In Latest Quarter". That report stated - "Subsequent violations of its recent chart low or 50-day moving average (DMA) line could raise more serious concerns and trigger sell signals." Soon afterward those violations occurred, and based on the weak action it was dropped from the Featured Stocks list on 5/07/10. It went through a long deep consolidation before rebounding impressively. It has continued to show impressive sales revenues and earnings growth. Long time members may recall that ISRG was first featured in yellow in CANSLIM.net reports in the summer of 2004 and it traded up more than 13-fold within a three and a half year time span after that initial appearance as a noteworthy buy candidate.
|
|
|
Color Codes Explained :
Y - Better candidates highlighted by our
staff of experts.
G - Previously featured
in past reports as yellow but may no longer be buyable under the
guidelines.
***Last / Change / Volume data in this table is the closing quote data***
Symbol/Exchange
Company Name
Industry Group |
PRICE |
CHANGE
(%Change) |
Day High |
Volume
(% DAV)
(% 50 day avg vol) |
52 Wk Hi
% From Hi |
Featured
Date |
Price
Featured |
Pivot Featured |
|
Max Buy |
ADS
-
NYSE
Alliance Data Sys Corp
COMPUTER SOFTWARE and SERVICES - Information and Delivery Service
|
$102.21
|
-0.81
-0.79% |
$104.74
|
559,204
58.87% of 50 DAV
50 DAV is 949,900
|
$107.33
-4.77%
|
10/21/2011
|
$97.94
|
PP = $101.15
|
|
MB = $106.21
|
Most Recent Note - 12/9/2011 2:34:51 PM
Y - Quietly perched within close striking distance of its all-time high today. Holding its ground stubbornly after a spurt of gains helped it rally back above its 50 DMA line helping its technical stance improve.
>>> The latest Featured Stock Update with an annotated graph appeared on 11/17/2011. Click here.
View all notes |
Alert me of new notes |
CANSLIM.net Company Profile |
SEC |
Zacks Reports |
StockTalk |
News |
Chart |
Request a new note
C
A N
S L
I M


|
ALXN
-
NASDAQ
Alexion Pharmaceuticals
DRUGS - Drug Manufacturers - Other
|
$63.82
|
-1.29
-1.98% |
$65.92
|
1,333,824
87.68% of 50 DAV
50 DAV is 1,521,300
|
$70.42
-9.37%
|
11/30/2011
|
$68.66
|
PP = $70.52
|
|
MB = $74.05
|
 Most Recent Note - 12/13/2011 7:07:58 PM
G - Loss today with near average volume while encountering resistance at its 50 DMA line. Its prior low ($62.02 on 11/21/11) defines the next important near-term support level to watch. A repair of its 50 DMA violation and volume-driven gains are needed to trigger a new (or add-on) technical buy signal. See the latest FSU analysis for more details and a new annotated graph.
>>> The latest Featured Stock Update with an annotated graph appeared on 12/12/2011. Click here.
View all notes |
Alert me of new notes |
CANSLIM.net Company Profile |
SEC |
Zacks Reports |
StockTalk |
News |
Chart |
Request a new note
C
A N
S L
I M
|
CELG
-
NASDAQ
Celgene Corp
DRUGS - Drug Manufacturers - Major
|
$63.96
|
+0.30
0.47% |
$64.71
|
4,324,222
112.56% of 50 DAV
50 DAV is 3,841,700
|
$68.25
-6.29%
|
9/16/2011
|
$61.21
|
PP = $62.59
|
|
MB = $65.72
|
Most Recent Note - 12/9/2011 2:18:03 PM
G - Solid gain today, rising within close range of its 50 DMA line. Gains above that short-term average would help its outlook improve, meanwhile it is -7.3% off its 52-week high. Its Relative Strength (RS) Rating has slumped to 81, down from 93 when shown in an 10/14/11 FSU analysis.
>>> The latest Featured Stock Update with an annotated graph appeared on 12/1/2011. Click here.
View all notes |
Alert me of new notes |
CANSLIM.net Company Profile |
SEC |
Zacks Reports |
StockTalk |
News |
Chart |
Request a new note
C
A N
S L
I M
|
FEIC
-
NASDAQ
F E I Co
ELECTRONICS - Diversified Electronics
|
$38.80
|
-0.69
-1.75% |
$40.18
|
230,570
52.77% of 50 DAV
50 DAV is 436,900
|
$42.25
-8.17%
|
12/7/2011
|
$41.41
|
PP = $42.35
|
|
MB = $44.47
|
Most Recent Note - 12/12/2011 12:44:06 PM
Y - Slumping today on light volume amid widespread market weakness. Little resistance remains due to overhead supply. A volume-driven gain above the pivot point may trigger a technical buy signal.
>>> The latest Featured Stock Update with an annotated graph appeared on 11/25/2011. Click here.
View all notes |
Alert me of new notes |
CANSLIM.net Company Profile |
SEC |
Zacks Reports |
StockTalk |
News |
Chart |
Request a new note
C
A N
S L
I M
|
GNC
-
NYSE
G N C Holdings Inc
RETAIL - Drug Stores
|
$27.87
|
-0.34
-1.21% |
$28.91
|
2,056,682
160.14% of 50 DAV
50 DAV is 1,284,300
|
$28.50
-2.21%
|
10/26/2011
|
$24.60
|
PP = $24.80
|
|
MB = $26.04
|
Most Recent Note - 12/13/2011 7:06:15 PM
G - Touched a new all-time high today and then reversed into the red for a loss with above average volume, a sign of distributional pressure. Prior chart highs and its 50 DMA line coincide in the $25-26 area defining important support to watch on pullbacks.
>>> The latest Featured Stock Update with an annotated graph appeared on 11/21/2011. Click here.
View all notes |
Alert me of new notes |
CANSLIM.net Company Profile |
SEC |
Zacks Reports |
StockTalk |
News |
Chart |
Request a new note
C
A N
S L
I M
|
Symbol/Exchange
Company Name
Industry Group |
PRICE |
CHANGE
(%Change) |
Day High |
Volume
(% DAV)
(% 50 day avg vol) |
52 Wk Hi
% From Hi |
Featured
Date |
Price
Featured |
Pivot Featured |
|
Max Buy |
HMSY
-
NASDAQ
H M S Holdings Corp
COMPUTER SOFTWARE and SERVICES - Healthcare Information Service
|
$30.82
|
-0.41
-1.31% |
$31.79
|
947,845
139.68% of 50 DAV
50 DAV is 678,600
|
$32.16
-4.17%
|
10/27/2011
|
$26.44
|
PP = $28.37
|
|
MB = $29.79
|
Most Recent Note - 12/9/2011 12:53:49 PM
G - Poised for a best-ever close today and challenging its all-time high. It is extended from its prior base. Prior highs in the $27-28 area acted as support during the recent pullback.
>>> The latest Featured Stock Update with an annotated graph appeared on 11/30/2011. Click here.
View all notes |
Alert me of new notes |
CANSLIM.net Company Profile |
SEC |
Zacks Reports |
StockTalk |
News |
Chart |
Request a new note
C
A N
S L
I M
|
ISRG
-
NASDAQ
Intuitive Surgical Inc
HEALTH SERVICES - Medical Appliances and Equipment
|
$434.39
|
+0.68
0.16% |
$443.99
|
287,811
69.74% of 50 DAV
50 DAV is 412,700
|
$449.06
-3.27%
|
10/19/2011
|
$424.69
|
PP = $415.29
|
|
MB = $436.05
|
Most Recent Note - 12/13/2011 7:10:54 PM
G - Perched within close striking distance of its all-time high. Its 50 DMA line and prior lows define near-term support to watch. See the latest FSU analysis for more details and a new annotated graph.
>>> The latest Featured Stock Update with an annotated graph appeared on 12/13/2011. Click here.
View all notes |
Alert me of new notes |
CANSLIM.net Company Profile |
SEC |
Zacks Reports |
StockTalk |
News |
Chart |
Request a new note
C
A N
S L
I M
|
MELI
-
NASDAQ
Mercadolibre Inc
INTERNET - Internet Software and; Services
|
$89.16
|
-1.49
-1.64% |
$92.85
|
712,047
107.01% of 50 DAV
50 DAV is 665,400
|
$95.48
-6.62%
|
12/5/2011
|
$91.08
|
PP = $92.83
|
|
MB = $97.47
|
Most Recent Note - 12/12/2011 12:49:08 PM
Y - Quietly pulling back today amid widespread market weakness, yet still perched within -6% of its all-time high. Disciplined investors limit losses if ever a stock falls -7% from their purchase price.
>>> The latest Featured Stock Update with an annotated graph appeared on 12/5/2011. Click here.
View all notes |
Alert me of new notes |
CANSLIM.net Company Profile |
SEC |
Zacks Reports |
StockTalk |
News |
Chart |
Request a new note
C
A N
S L
I M
|
MG
-
NYSE
Mistras Group Inc
DIVERSIFIED SERVICES - Bulding and Faci;ity Management Services
|
$23.90
|
-0.27
-1.12% |
$24.75
|
185,200
89.43% of 50 DAV
50 DAV is 207,100
|
$25.28
-5.46%
|
10/28/2011
|
$22.49
|
PP = $23.61
|
|
MB = $24.79
|
Most Recent Note - 12/9/2011 2:22:40 PM
Y - Up today on very light volume, rising back above its pivot point. A solid gain and strong close on 12/05/11 with +55% above average volume triggered a technical buy signal. Prior highs in the $23 area define initial chart support to watch. See the latest FSU analysis for more details and a new annotated graph.
>>> The latest Featured Stock Update with an annotated graph appeared on 12/8/2011. Click here.
View all notes |
Alert me of new notes |
CANSLIM.net Company Profile |
SEC |
Zacks Reports |
StockTalk |
News |
Chart |
Request a new note
C
A N
S L
I M
|
MKTX
-
NASDAQ
Marketaxess Holdings Inc
FINANCIAL SERVICES - Investment Brokerage - Nationa
|
$27.63
|
-0.97
-3.39% |
$29.19
|
127,969
52.86% of 50 DAV
50 DAV is 242,100
|
$31.45
-12.15%
|
10/28/2011
|
$29.79
|
PP = $31.05
|
|
MB = $32.60
|
Most Recent Note - 12/13/2011 6:51:44 PM
G - Pulled back on below average volume today and closed near the session low finishing just below its 50 DMA line. It still faces previously stubborn resistance in the $31 area.
>>> The latest Featured Stock Update with an annotated graph appeared on 11/23/2011. Click here.
View all notes |
Alert me of new notes |
CANSLIM.net Company Profile |
SEC |
Zacks Reports |
StockTalk |
News |
Chart |
Request a new note
C
A N
S L
I M
|
Symbol/Exchange
Company Name
Industry Group |
PRICE |
CHANGE
(%Change) |
Day High |
Volume
(% DAV)
(% 50 day avg vol) |
52 Wk Hi
% From Hi |
Featured
Date |
Price
Featured |
Pivot Featured |
|
Max Buy |
OSIS
-
NASDAQ
O S I Systems Inc
ELECTRONICS - Semiconductor Equipment and Mate
|
$45.08
|
-2.44
-5.13% |
$48.34
|
125,161
84.34% of 50 DAV
50 DAV is 148,400
|
$49.04
-8.08%
|
11/1/2011
|
$42.07
|
PP = $45.57
|
|
MB = $47.85
|
Most Recent Note - 12/13/2011 2:05:12 PM
Y - Reversed into the red today after a positive start had it poised for a best-ever close. Its gap gain with +44% above average volume on 11/30/11 triggered a technical buy signal. Its 50 DMA line defines important support to watch.
>>> The latest Featured Stock Update with an annotated graph appeared on 11/28/2011. Click here.
View all notes |
Alert me of new notes |
CANSLIM.net Company Profile |
SEC |
Zacks Reports |
StockTalk |
News |
Chart |
Request a new note
C
A N
S L
I M
|
PRGO
-
NASDAQ
Perrigo Co
DRUGS - Drug Related Products
|
$97.22
|
-1.16
-1.18% |
$99.96
|
689,394
81.34% of 50 DAV
50 DAV is 847,500
|
$101.94
-4.63%
|
12/9/2011
|
$99.54
|
PP = $101.56
|
|
MB = $106.64
|
Most Recent Note - 12/9/2011 1:08:20 PM
Y - Reported earnings +26% on +13% sales revenues for the quarter ended September 30, 2011 versus the year ago period. Color code is changed yellow since it has formed a late-stage base, while confirming gains above its pivot point are still needed to trigger a proper new technical buy signal. It found prompt support at its 200 DMA line during the latest consolidation from new all-time highs that were hit since it was last noted in the 10/04/11 mid-day report.
>>> The latest Featured Stock Update with an annotated graph appeared on 12/9/2011. Click here.
View all notes |
Alert me of new notes |
CANSLIM.net Company Profile |
SEC |
Zacks Reports |
StockTalk |
News |
Chart |
Request a new note
C
A N
S L
I M
|
RAX
-
NYSE
Rackspace Hosting Inc
INTERNET - Internet Software and; Services
|
$43.80
|
-0.15
-0.34% |
$44.48
|
2,155,241
135.50% of 50 DAV
50 DAV is 1,590,600
|
$46.50
-5.80%
|
11/8/2011
|
$44.28
|
PP = $46.27
|
|
MB = $48.58
|
Most Recent Note - 12/9/2011 2:28:58 PM
Y - Up today, quietly rising within close striking distance of its 52-week and all-time high. Support to watch is at its closely coinciding 50 and 200 DMA lines. Subsequent violations would trigger damaging technical sell signals. See the latest FSU analysis for more details and a new annotated daily graph.
>>> The latest Featured Stock Update with an annotated graph appeared on 12/7/2011. Click here.
View all notes |
Alert me of new notes |
CANSLIM.net Company Profile |
SEC |
Zacks Reports |
StockTalk |
News |
Chart |
Request a new note
C
A N
S L
I M
|
SWI
-
NYSE
Solarwinds Inc
COMPUTER SOFTWARE and SERVICES - Application Software
|
$30.67
|
-1.26
-3.95% |
$32.64
|
1,207,899
103.05% of 50 DAV
50 DAV is 1,172,200
|
$33.68
-8.94%
|
10/27/2011
|
$27.78
|
PP = $25.62
|
|
MB = $26.90
|
Most Recent Note - 12/13/2011 6:56:19 PM
G - Pulled back today for a 2nd consecutive loss with near average volume. It is still extended from its prior base, and its 50 DMA line defines initial chart support to watch on pullbacks.
>>> The latest Featured Stock Update with an annotated graph appeared on 11/22/2011. Click here.
View all notes |
Alert me of new notes |
CANSLIM.net Company Profile |
SEC |
Zacks Reports |
StockTalk |
News |
Chart |
Request a new note
C
A N
S L
I M
|
TDG
-
NYSE
Transdigm Group Inc
AEROSPACE/DEFENSE - Aerospace/Defense Products and; Services
|
$94.74
|
-1.26
-1.31% |
$97.44
|
305,829
74.05% of 50 DAV
50 DAV is 413,000
|
$102.73
-7.78%
|
11/9/2011
|
$98.45
|
PP = $95.14
|
|
MB = $99.90
|
Most Recent Note - 12/9/2011 3:44:06 PM
Y - Up today on light volume, trading within close striking distance of its best-ever close. A subsequent slump below the recent low and its 50 DMA line would trigger technical sell signals. See the latest FSU analysis for more details and a new annotated graph.
>>> The latest Featured Stock Update with an annotated graph appeared on 12/6/2011. Click here.
View all notes |
Alert me of new notes |
CANSLIM.net Company Profile |
SEC |
Zacks Reports |
StockTalk |
News |
Chart |
Request a new note
C
A N
S L
I M
|
Symbol/Exchange
Company Name
Industry Group |
PRICE |
CHANGE
(%Change) |
Day High |
Volume
(% DAV)
(% 50 day avg vol) |
52 Wk Hi
% From Hi |
Featured
Date |
Price
Featured |
Pivot Featured |
|
Max Buy |
UA
-
NYSE
Under Armour Inc Cl A
CONSUMER NON-DURABLES - Textile - Apparel Clothing
|
$74.48
|
-4.64
-5.86% |
$80.18
|
2,028,250
152.68% of 50 DAV
50 DAV is 1,328,400
|
$87.40
-14.78%
|
10/25/2011
|
$82.43
|
PP = $80.80
|
|
MB = $84.84
|
Most Recent Note - 12/13/2011 1:30:01 PM
G - Down again today, slumping further below its 50 DMA line as a 2nd consecutive loss with above average volume raises more concerns. The recent low ($73.55 on 11/21/11) defines important chart support to watch above its 200 DMA line.
>>> The latest Featured Stock Update with an annotated graph appeared on 11/29/2011. Click here.
View all notes |
Alert me of new notes |
CANSLIM.net Company Profile |
SEC |
Zacks Reports |
StockTalk |
News |
Chart |
Request a new note
C
A N
S L
I M
|
ULTA
-
NASDAQ
Ulta Salon Cosm & Frag
SPECIALTY RETAIL - Specialty Retail, Other
|
$70.62
|
-2.14
-2.94% |
$73.75
|
775,637
73.28% of 50 DAV
50 DAV is 1,058,400
|
$75.70
-6.71%
|
12/2/2011
|
$72.88
|
PP = $75.79
|
|
MB = $79.58
|
Most Recent Note - 12/13/2011 7:03:25 PM
Y - Quietly consolidating above its 50 DMA line with volume totals cooling. It has not triggered a buy signal with a volume-driven gain above its pivot point since its late-stage base was identified in recent reports.
>>> The latest Featured Stock Update with an annotated graph appeared on 12/2/2011. Click here.
View all notes |
Alert me of new notes |
CANSLIM.net Company Profile |
SEC |
Zacks Reports |
StockTalk |
News |
Chart |
Request a new note
C
A N
S L
I M
|
V
-
NYSE
Visa Inc Cl A
DIVERSIFIED SERVICES - Business/Management Services
|
$95.91
|
-1.01
-1.04% |
$97.54
|
3,391,161
63.92% of 50 DAV
50 DAV is 5,305,100
|
$98.60
-2.73%
|
10/24/2011
|
$94.21
|
PP = $94.85
|
|
MB = $99.59
|
Most Recent Note - 12/9/2011 3:48:47 PM
Y - Still hovering near its 52-week high with volume totals recently cooling. Proof of serious institutional demand requires at least +50% heavier than average volume behind a meaningful gain.
>>> The latest Featured Stock Update with an annotated graph appeared on 11/18/2011. Click here.
View all notes |
Alert me of new notes |
CANSLIM.net Company Profile |
SEC |
Zacks Reports |
StockTalk |
News |
Chart |
Request a new note
C
A N
S L
I M
|
|
|
|
THESE ARE NOT BUY RECOMMENDATIONS!
Comments contained in the body of this report are technical
opinions only. The material herein has been obtained
from sources believed to be reliable and accurate, however,
its accuracy and completeness cannot be guaranteed.
This site is not an investment advisor, hence it does
not endorse or recommend any securities or other investments.
Any recommendation contained in this report may not
be suitable for all investors and it is not to be deemed
an offer or solicitation on our part with respect to
the purchase or sale of any securities. All trademarks,
service marks and trade names appearing in this report
are the property of their respective owners, and are
likewise used for identification purposes only.
This report is a service available
only to active Paid Premium Members.
You may opt-out of receiving report notifications
at any time. Questions or comments may be submitted
by writing to Premium Membership Services 665 S.E. 10 Street, Suite 201 Deerfield Beach, FL 33441-5634 or by calling 1-800-965-8307
or 954-785-1121.
|
|
|

