You are not logged in.
This means you
CAN ONLY VIEW reports that were published prior to Tuesday, April 15, 2025.
You
MUST UPGRADE YOUR MEMBERSHIP if you want to see any current reports.
AFTER MARKET UPDATE - MONDAY, DECEMBER 12TH, 2011
Previous After Market Report Next After Market Report >>>
|
|
|
|
DOW |
-162.87 |
12,021.39 |
-1.34% |
|
Volume |
777,586,930 |
-5% |
|
Volume |
1,501,761,870 |
-7% |
|
NASDAQ |
-34.59 |
2,612.26 |
-1.31% |
|
Advancers |
567 |
18% |
|
Advancers |
642 |
24% |
|
S&P 500 |
-18.72 |
1,236.47 |
-1.49% |
|
Decliners |
2,471 |
79% |
|
Decliners |
1,925 |
72% |
|
Russell 2000 |
-12.25 |
733.15 |
-1.64% |
|
52 Wk Highs |
64 |
|
|
52 Wk Highs |
16 |
|
|
S&P 600 |
-6.11 |
408.40 |
-1.47% |
|
52 Wk Lows |
48 |
|
|
52 Wk Lows |
73 |
|
|
 |
Negative Breadth As Major Averages Slump Even More
Kenneth J. Gruneisen - Passed the CAN SLIM® Master's Exam
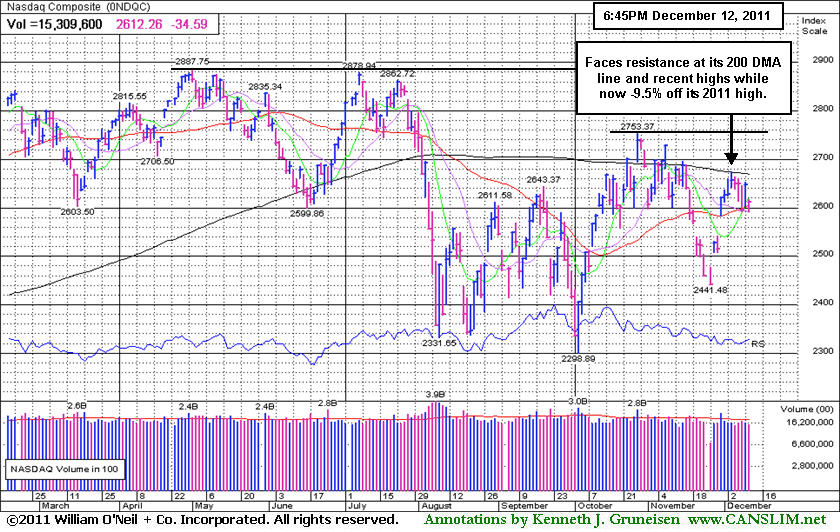
Renewed concerns over the European debt crisis led to widespread losses on Monday. Volume totals were reported lighter on the NYSE and on the Nasdaq exchange versus Friday's session totals, so at least institutional selling did not intensify. Decliners led advancers by mre than 4-1 on the NYSE and by more than 3-1 on the Nasdaq exchange. New 52-week highs outnumbered new 52-week lows on the NYSE while new lows easily led new highs on the Nasdaq exchange. There were 12 high-ranked companies from the CANSLIM.net Leaders List that made new 52-week highs and appeared on the CANSLIM.net BreakOuts Page, down from the prior session total of 29 stocks. There were gains for 5 of the 18 high-ranked companies currently included on the Featured Stocks Page.
The lack of a significant agreement caused ratings agency Moody's to reiterate their intent to review the European Union's credit rating in the first-quarter of 2012. Adding to the uncertainty was the lack of commitment from the European Central Bank in joining the bloc's plans to resolve the debt crisis.
Stocks extended their losses after the world's largest semiconductor maker, Intel Corp (INTC -4.04%), cut its revenue forecasts for the fourth-quarter on supply constraints. All major averages finished lower, albeit well off of session lows on a last minute rally. Tech stocks led the losses.
Financial shares also gave up more ground while the EU debt crisis concerns lingered. Bank of America Corp (BAC -4.72%) and Citigroup Inc (C -5.39%) fell. Energy stocks Exxon Mobile Corp (XOM -1.59%) and Chevron Corp (CVX -1.13%) followed crude oil's decline to $98.19 per barrel.
Our monthly newsletter CANSLIM.net News will be published soon with an informative review of current market conditions, leading groups, and best buy candidates. Via the Premium Member Homepage links to all prior reports and webcasts are always available.
PICTURED: The Nasdaq Composite Index faces resistance at its 200-day moving average (DMA) line and recent highs while now consolidating -9.5% off its 2011 high
|
 Kenneth J. Gruneisen started out as a licensed stockbroker in August 1987, a couple of months prior to the historic stock market crash that took the Dow Jones Industrial Average down -22.6% in a single day. He has published daily fact-based fundamental and technical analysis on high-ranked stocks online for two decades. Through FACTBASEDINVESTING.COM, Kenneth provides educational articles, news, market commentary, and other information regarding proven investment systems that work in good times and bad.
Comments contained in the body of this report are technical opinions only and are not necessarily those of Gruneisen Growth Corp. The material herein has been obtained from sources believed to be reliable and accurate, however, its accuracy and completeness cannot be guaranteed. Our firm, employees, and customers may effect transactions, including transactions contrary to any recommendation herein, or have positions in the securities mentioned herein or options with respect thereto. Any recommendation contained in this report may not be suitable for all investors and it is not to be deemed an offer or solicitation on our part with respect to the purchase or sale of any securities. |
|
 |
Commodity-Linked Groups, Financial, and Tech Shares Fell
Kenneth J. Gruneisen - Passed the CAN SLIM® Master's Exam
Commodity-linked groups were among Monday's worst losers as the Gold & Silver Index ($XAU -3.42%),Oil Services Index ($OSX -3.34%), and Integrated Oil Index ($XOI -2.30%) fell. Financial shares also created a drag on the major averages as the Broker/Dealer Index ($XBD -2.47%) and the Bank Index ($BKX -2.45%) slumped. The tech sector saw unanimous losses from the Semiconductor Index ($SOX -2.80%), Networking Index ($NWX -2.21%), Internet Index ($IIX -1.47%), and Biotechnology Index ($BTK -0.86%). The Healthcare Index ($HMO -1.75%) also fell, meanwhile the Retail Index ($RLX -0.58%) did a better job of avoiding damage but still ended with a modest loss.
Charts courtesy www.stockcharts.com
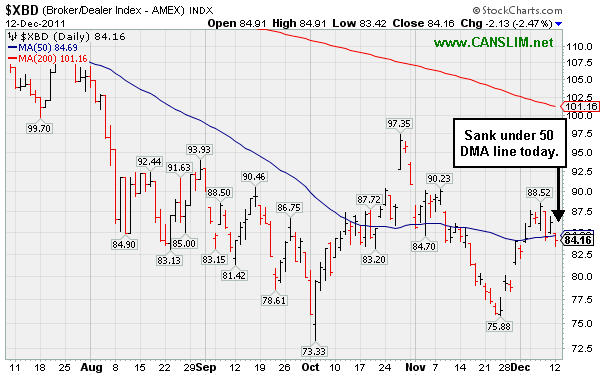
PICTURED: The Broker/Dealer Index ($XBD -2.47%) sank under its 50-day moving average (DMA) line today.
| Oil Services |
$OSX |
222.38 |
-7.68 |
-3.34% |
-9.28% |
| Healthcare |
$HMO |
2,221.78 |
-39.66 |
-1.75% |
+31.31% |
| Integrated Oil |
$XOI |
1,199.23 |
-28.27 |
-2.30% |
-1.15% |
| Semiconductor |
$SOX |
365.15 |
-10.52 |
-2.80% |
-11.33% |
| Networking |
$NWX |
219.54 |
-4.96 |
-2.21% |
-21.75% |
| Internet |
$IIX |
283.36 |
-4.23 |
-1.47% |
-7.92% |
| Broker/Dealer |
$XBD |
84.16 |
-2.13 |
-2.47% |
-30.74% |
| Retail |
$RLX |
533.48 |
-3.13 |
-0.58% |
+4.94% |
| Gold & Silver |
$XAU |
193.78 |
-6.86 |
-3.42% |
-14.48% |
| Bank |
$BKX |
38.17 |
-0.96 |
-2.45% |
-26.89% |
| Biotech |
$BTK |
1,042.10 |
-9.05 |
-0.86% |
-19.69% |
|
|
|
 |
Prior Low Defines Near-Term Support Level
Kenneth J. Gruneisen - Passed the CAN SLIM® Master's Exam
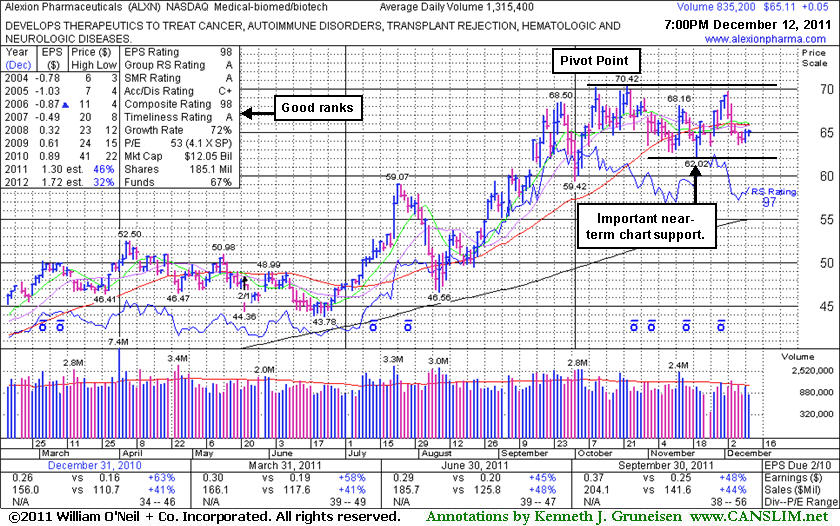
Alexion Pharmaceuticals (ALXN +$0.05 or +0.08% to $65.11) has recently been sputtering below its 50-day moving average (DMA) line. Its prior low ($62.02 on 11/21/11) defines the next important near-term support level to watch. Any subsequent violation of its recent chart lows would trigger a more worrisome technical sell signal. Disciplined investors always limit losses by selling if a stock falls more than -7% from their buy point. Meanwhile, a repair of its 50 DMA violation and volume-driven gains are needed to trigger a new (or add-on) technical buy signal.
It was last shown in this FSU section on 11/14/11 with an annotated graph under the headline, "Support Found at 50-Day Moving Average; Secondary Buy Point," as it was finding good support near its 50-day moving average (DMA) line. It had been weeks since volume indicated any great decisiveness in direction. Its Relative Strength Rank (97) remains high, however the Relative Strength line (jagged blue line) has been recently slumping. When buying stocks, it is preferred to see the Relative Strength rank hitting new highs prior to the share price hitting new highs. ALXN has good ranks, and its strong quarterly and annual earnings history satisfies the C and A criteria. In prior months it found support well above its 200 DMA line. It rose from a previously noted "cup-with-high-handle" pattern as it gapped up on 9/15/11 and hit a new all-time high. The number of top-rated funds owning its shares rose from 843 in Mar '11 to 1,003 in Sep '11, a reassuring sign concerning the I criteria of the fact-based investment system.
 |
|
|
Color Codes Explained :
Y - Better candidates highlighted by our
staff of experts.
G - Previously featured
in past reports as yellow but may no longer be buyable under the
guidelines.
***Last / Change / Volume data in this table is the closing quote data***
Symbol/Exchange
Company Name
Industry Group |
PRICE |
CHANGE
(%Change) |
Day High |
Volume
(% DAV)
(% 50 day avg vol) |
52 Wk Hi
% From Hi |
Featured
Date |
Price
Featured |
Pivot Featured |
|
Max Buy |
ADS
-
NYSE
Alliance Data Sys Corp
COMPUTER SOFTWARE and SERVICES - Information and Delivery Service
|
$103.02
|
-0.68
-0.66% |
$103.51
|
470,371
49.52% of 50 DAV
50 DAV is 949,900
|
$107.33
-4.02%
|
10/21/2011
|
$97.94
|
PP = $101.15
|
|
MB = $106.21
|
Most Recent Note - 12/9/2011 2:34:51 PM
Y - Quietly perched within close striking distance of its all-time high today. Holding its ground stubbornly after a spurt of gains helped it rally back above its 50 DMA line helping its technical stance improve.
>>> The latest Featured Stock Update with an annotated graph appeared on 11/17/2011. Click here.
View all notes |
Alert me of new notes |
CANSLIM.net Company Profile |
SEC |
Zacks Reports |
StockTalk |
News |
Chart |
Request a new note
C
A N
S L
I M


|
ALXN
-
NASDAQ
Alexion Pharmaceuticals
DRUGS - Drug Manufacturers - Other
|
$65.11
|
+0.05
0.08% |
$65.28
|
840,256
55.23% of 50 DAV
50 DAV is 1,521,300
|
$70.42
-7.54%
|
11/30/2011
|
$68.66
|
PP = $70.52
|
|
MB = $74.05
|
 Most Recent Note - 12/12/2011 7:16:09 PM
G - Still sputtering below its 50 DMA line today, and its prior low ($62.02 on 11/21/11) defines the next important near-term support level to watch. A repair of its 50 DMA violation and volume-driven gains are needed to trigger a new (or add-on) technical buy signal. See the latest FSU analysis for more details and a new annotated graph.
>>> The latest Featured Stock Update with an annotated graph appeared on 12/12/2011. Click here.
View all notes |
Alert me of new notes |
CANSLIM.net Company Profile |
SEC |
Zacks Reports |
StockTalk |
News |
Chart |
Request a new note
C
A N
S L
I M
|
CELG
-
NASDAQ
Celgene Corp
DRUGS - Drug Manufacturers - Major
|
$63.66
|
+0.08
0.13% |
$64.47
|
5,148,378
134.01% of 50 DAV
50 DAV is 3,841,700
|
$68.25
-6.73%
|
9/16/2011
|
$61.21
|
PP = $62.59
|
|
MB = $65.72
|
Most Recent Note - 12/9/2011 2:18:03 PM
G - Solid gain today, rising within close range of its 50 DMA line. Gains above that short-term average would help its outlook improve, meanwhile it is -7.3% off its 52-week high. Its Relative Strength (RS) Rating has slumped to 81, down from 93 when shown in an 10/14/11 FSU analysis.
>>> The latest Featured Stock Update with an annotated graph appeared on 12/1/2011. Click here.
View all notes |
Alert me of new notes |
CANSLIM.net Company Profile |
SEC |
Zacks Reports |
StockTalk |
News |
Chart |
Request a new note
C
A N
S L
I M
|
FEIC
-
NASDAQ
F E I Co
ELECTRONICS - Diversified Electronics
|
$39.49
|
-1.61
-3.92% |
$41.27
|
213,986
48.98% of 50 DAV
50 DAV is 436,900
|
$42.25
-6.53%
|
12/7/2011
|
$41.41
|
PP = $42.35
|
|
MB = $44.47
|
Most Recent Note - 12/12/2011 12:44:06 PM
Y - Slumping today on light volume amid widespread market weakness. Little resistance remains due to overhead supply. A volume-driven gain above the pivot point may trigger a technical buy signal.
>>> The latest Featured Stock Update with an annotated graph appeared on 11/25/2011. Click here.
View all notes |
Alert me of new notes |
CANSLIM.net Company Profile |
SEC |
Zacks Reports |
StockTalk |
News |
Chart |
Request a new note
C
A N
S L
I M
|
GNC
-
NYSE
G N C Holdings Inc
RETAIL - Drug Stores
|
$28.21
|
+0.51
1.84% |
$28.33
|
1,243,720
96.84% of 50 DAV
50 DAV is 1,284,300
|
$28.50
-1.02%
|
10/26/2011
|
$24.60
|
PP = $24.80
|
|
MB = $26.04
|
Most Recent Note - 12/9/2011 1:58:08 PM
G - Up today, trading within -3.1% of its all-time high and perched near a best-ever close. Prior chart highs and its 50 DMA line coincide in the $25-26 area defining important support to watch on pullbacks.
>>> The latest Featured Stock Update with an annotated graph appeared on 11/21/2011. Click here.
View all notes |
Alert me of new notes |
CANSLIM.net Company Profile |
SEC |
Zacks Reports |
StockTalk |
News |
Chart |
Request a new note
C
A N
S L
I M
|
Symbol/Exchange
Company Name
Industry Group |
PRICE |
CHANGE
(%Change) |
Day High |
Volume
(% DAV)
(% 50 day avg vol) |
52 Wk Hi
% From Hi |
Featured
Date |
Price
Featured |
Pivot Featured |
|
Max Buy |
HMSY
-
NASDAQ
H M S Holdings Corp
COMPUTER SOFTWARE and SERVICES - Healthcare Information Service
|
$31.23
|
-0.43
-1.36% |
$31.64
|
957,684
141.13% of 50 DAV
50 DAV is 678,600
|
$32.16
-2.89%
|
10/27/2011
|
$26.44
|
PP = $28.37
|
|
MB = $29.79
|
Most Recent Note - 12/9/2011 12:53:49 PM
G - Poised for a best-ever close today and challenging its all-time high. It is extended from its prior base. Prior highs in the $27-28 area acted as support during the recent pullback.
>>> The latest Featured Stock Update with an annotated graph appeared on 11/30/2011. Click here.
View all notes |
Alert me of new notes |
CANSLIM.net Company Profile |
SEC |
Zacks Reports |
StockTalk |
News |
Chart |
Request a new note
C
A N
S L
I M
|
ISRG
-
NASDAQ
Intuitive Surgical Inc
HEALTH SERVICES - Medical Appliances and Equipment
|
$433.71
|
-6.69
-1.52% |
$438.54
|
204,471
49.54% of 50 DAV
50 DAV is 412,700
|
$449.06
-3.42%
|
10/19/2011
|
$424.69
|
PP = $415.29
|
|
MB = $436.05
|
Most Recent Note - 12/9/2011 3:50:36 PM
G - Up today on light volume, its color code is changed to green while rising back above its "max buy" level within close striking distance of its all-time high. Found support recently well above its 50 DMA line near prior chart highs.
>>> The latest Featured Stock Update with an annotated graph appeared on 11/15/2011. Click here.
View all notes |
Alert me of new notes |
CANSLIM.net Company Profile |
SEC |
Zacks Reports |
StockTalk |
News |
Chart |
Request a new note
C
A N
S L
I M
|
MELI
-
NASDAQ
Mercadolibre Inc
INTERNET - Internet Software and; Services
|
$90.65
|
-2.00
-2.16% |
$91.95
|
594,905
89.41% of 50 DAV
50 DAV is 665,400
|
$95.48
-5.06%
|
12/5/2011
|
$91.08
|
PP = $92.83
|
|
MB = $97.47
|
Most Recent Note - 12/12/2011 12:49:08 PM
Y - Quietly pulling back today amid widespread market weakness, yet still perched within -6% of its all-time high. Disciplined investors limit losses if ever a stock falls -7% from their purchase price.
>>> The latest Featured Stock Update with an annotated graph appeared on 12/5/2011. Click here.
View all notes |
Alert me of new notes |
CANSLIM.net Company Profile |
SEC |
Zacks Reports |
StockTalk |
News |
Chart |
Request a new note
C
A N
S L
I M
|
MG
-
NYSE
Mistras Group Inc
DIVERSIFIED SERVICES - Bulding and Faci;ity Management Services
|
$24.17
|
-0.20
-0.82% |
$24.20
|
97,399
47.03% of 50 DAV
50 DAV is 207,100
|
$25.28
-4.39%
|
10/28/2011
|
$22.49
|
PP = $23.61
|
|
MB = $24.79
|
Most Recent Note - 12/9/2011 2:22:40 PM
Y - Up today on very light volume, rising back above its pivot point. A solid gain and strong close on 12/05/11 with +55% above average volume triggered a technical buy signal. Prior highs in the $23 area define initial chart support to watch. See the latest FSU analysis for more details and a new annotated graph.
>>> The latest Featured Stock Update with an annotated graph appeared on 12/8/2011. Click here.
View all notes |
Alert me of new notes |
CANSLIM.net Company Profile |
SEC |
Zacks Reports |
StockTalk |
News |
Chart |
Request a new note
C
A N
S L
I M
|
MKTX
-
NASDAQ
Marketaxess Holdings Inc
FINANCIAL SERVICES - Investment Brokerage - Nationa
|
$28.60
|
+0.15
0.53% |
$28.67
|
220,228
90.97% of 50 DAV
50 DAV is 242,100
|
$31.45
-9.06%
|
10/28/2011
|
$29.79
|
PP = $31.05
|
|
MB = $32.60
|
Most Recent Note - 12/9/2011 4:19:35 PM
G - Consolidating just above its 50 DMA line today. It still faces previously stubborn resistance in the $31 area.
>>> The latest Featured Stock Update with an annotated graph appeared on 11/23/2011. Click here.
View all notes |
Alert me of new notes |
CANSLIM.net Company Profile |
SEC |
Zacks Reports |
StockTalk |
News |
Chart |
Request a new note
C
A N
S L
I M
|
Symbol/Exchange
Company Name
Industry Group |
PRICE |
CHANGE
(%Change) |
Day High |
Volume
(% DAV)
(% 50 day avg vol) |
52 Wk Hi
% From Hi |
Featured
Date |
Price
Featured |
Pivot Featured |
|
Max Buy |
OSIS
-
NASDAQ
O S I Systems Inc
ELECTRONICS - Semiconductor Equipment and Mate
|
$47.52
|
+0.16
0.34% |
$47.53
|
69,662
46.94% of 50 DAV
50 DAV is 148,400
|
$49.04
-3.10%
|
11/1/2011
|
$42.07
|
PP = $45.57
|
|
MB = $47.85
|
Most Recent Note - 12/9/2011 2:25:22 PM
Y - Up today without great volume conviction following a mild bout of distributional pressure. Its gap gain with +44% above average volume on 11/30/11 triggered a technical buy signal. Its 50 DMA line defines important support to watch.
>>> The latest Featured Stock Update with an annotated graph appeared on 11/28/2011. Click here.
View all notes |
Alert me of new notes |
CANSLIM.net Company Profile |
SEC |
Zacks Reports |
StockTalk |
News |
Chart |
Request a new note
C
A N
S L
I M
|
PRGO
-
NASDAQ
Perrigo Co
DRUGS - Drug Related Products
|
$98.38
|
-1.25
-1.25% |
$99.10
|
755,917
89.19% of 50 DAV
50 DAV is 847,500
|
$101.94
-3.49%
|
12/9/2011
|
$99.54
|
PP = $101.56
|
|
MB = $106.64
|
Most Recent Note - 12/9/2011 1:08:20 PM
Y - Reported earnings +26% on +13% sales revenues for the quarter ended September 30, 2011 versus the year ago period. Color code is changed yellow since it has formed a late-stage base, while confirming gains above its pivot point are still needed to trigger a proper new technical buy signal. It found prompt support at its 200 DMA line during the latest consolidation from new all-time highs that were hit since it was last noted in the 10/04/11 mid-day report.
>>> The latest Featured Stock Update with an annotated graph appeared on 12/9/2011. Click here.
View all notes |
Alert me of new notes |
CANSLIM.net Company Profile |
SEC |
Zacks Reports |
StockTalk |
News |
Chart |
Request a new note
C
A N
S L
I M
|
RAX
-
NYSE
Rackspace Hosting Inc
INTERNET - Internet Software and; Services
|
$43.95
|
-0.07
-0.16% |
$43.97
|
1,385,271
87.09% of 50 DAV
50 DAV is 1,590,600
|
$46.50
-5.47%
|
11/8/2011
|
$44.28
|
PP = $46.27
|
|
MB = $48.58
|
Most Recent Note - 12/9/2011 2:28:58 PM
Y - Up today, quietly rising within close striking distance of its 52-week and all-time high. Support to watch is at its closely coinciding 50 and 200 DMA lines. Subsequent violations would trigger damaging technical sell signals. See the latest FSU analysis for more details and a new annotated daily graph.
>>> The latest Featured Stock Update with an annotated graph appeared on 12/7/2011. Click here.
View all notes |
Alert me of new notes |
CANSLIM.net Company Profile |
SEC |
Zacks Reports |
StockTalk |
News |
Chart |
Request a new note
C
A N
S L
I M
|
SWI
-
NYSE
Solarwinds Inc
COMPUTER SOFTWARE and SERVICES - Application Software
|
$31.93
|
-1.35
-4.06% |
$32.99
|
1,000,257
85.33% of 50 DAV
50 DAV is 1,172,200
|
$33.68
-5.20%
|
10/27/2011
|
$27.78
|
PP = $25.62
|
|
MB = $26.90
|
Most Recent Note - 12/12/2011 12:46:39 PM
G - Pulling back today amid widespread market weakness, yet still perched within -5% of its all-time high. Extended from its prior base, its prior highs in the $25-26 area define initial chart support to watch on pullbacks.
>>> The latest Featured Stock Update with an annotated graph appeared on 11/22/2011. Click here.
View all notes |
Alert me of new notes |
CANSLIM.net Company Profile |
SEC |
Zacks Reports |
StockTalk |
News |
Chart |
Request a new note
C
A N
S L
I M
|
TDG
-
NYSE
Transdigm Group Inc
AEROSPACE/DEFENSE - Aerospace/Defense Products and; Services
|
$96.00
|
-1.35
-1.39% |
$96.86
|
240,404
58.21% of 50 DAV
50 DAV is 413,000
|
$102.73
-6.55%
|
11/9/2011
|
$98.45
|
PP = $95.14
|
|
MB = $99.90
|
Most Recent Note - 12/9/2011 3:44:06 PM
Y - Up today on light volume, trading within close striking distance of its best-ever close. A subsequent slump below the recent low and its 50 DMA line would trigger technical sell signals. See the latest FSU analysis for more details and a new annotated graph.
>>> The latest Featured Stock Update with an annotated graph appeared on 12/6/2011. Click here.
View all notes |
Alert me of new notes |
CANSLIM.net Company Profile |
SEC |
Zacks Reports |
StockTalk |
News |
Chart |
Request a new note
C
A N
S L
I M
|
Symbol/Exchange
Company Name
Industry Group |
PRICE |
CHANGE
(%Change) |
Day High |
Volume
(% DAV)
(% 50 day avg vol) |
52 Wk Hi
% From Hi |
Featured
Date |
Price
Featured |
Pivot Featured |
|
Max Buy |
UA
-
NYSE
Under Armour Inc Cl A
CONSUMER NON-DURABLES - Textile - Apparel Clothing
|
$79.12
|
-3.58
-4.33% |
$81.45
|
1,634,573
123.05% of 50 DAV
50 DAV is 1,328,400
|
$87.40
-9.47%
|
10/25/2011
|
$82.43
|
PP = $80.80
|
|
MB = $84.84
|
Most Recent Note - 12/12/2011 12:41:51 PM
G - Gapped down today and violated its 50 DMA line raising some concerns amid widespread market weakness. The recent low ($73.55 on 11/21/11) defines important chart support to watch.
>>> The latest Featured Stock Update with an annotated graph appeared on 11/29/2011. Click here.
View all notes |
Alert me of new notes |
CANSLIM.net Company Profile |
SEC |
Zacks Reports |
StockTalk |
News |
Chart |
Request a new note
C
A N
S L
I M
|
ULTA
-
NASDAQ
Ulta Salon Cosm & Frag
SPECIALTY RETAIL - Specialty Retail, Other
|
$72.76
|
-1.30
-1.76% |
$73.54
|
714,171
67.48% of 50 DAV
50 DAV is 1,058,400
|
$75.70
-3.88%
|
12/2/2011
|
$72.88
|
PP = $75.79
|
|
MB = $79.58
|
Most Recent Note - 12/12/2011 12:51:26 PM
Y - Holding its ground stubbornly near its all-time high with volume totals cooling. Prior lows near $64 define initial chart support below its 50 DMA line.
>>> The latest Featured Stock Update with an annotated graph appeared on 12/2/2011. Click here.
View all notes |
Alert me of new notes |
CANSLIM.net Company Profile |
SEC |
Zacks Reports |
StockTalk |
News |
Chart |
Request a new note
C
A N
S L
I M
|
V
-
NYSE
Visa Inc Cl A
DIVERSIFIED SERVICES - Business/Management Services
|
$96.92
|
-0.27
-0.28% |
$97.40
|
3,411,007
64.30% of 50 DAV
50 DAV is 5,305,100
|
$98.60
-1.70%
|
10/24/2011
|
$94.21
|
PP = $94.85
|
|
MB = $99.59
|
Most Recent Note - 12/9/2011 3:48:47 PM
Y - Still hovering near its 52-week high with volume totals recently cooling. Proof of serious institutional demand requires at least +50% heavier than average volume behind a meaningful gain.
>>> The latest Featured Stock Update with an annotated graph appeared on 11/18/2011. Click here.
View all notes |
Alert me of new notes |
CANSLIM.net Company Profile |
SEC |
Zacks Reports |
StockTalk |
News |
Chart |
Request a new note
C
A N
S L
I M
|
|
|
|
THESE ARE NOT BUY RECOMMENDATIONS!
Comments contained in the body of this report are technical
opinions only. The material herein has been obtained
from sources believed to be reliable and accurate, however,
its accuracy and completeness cannot be guaranteed.
This site is not an investment advisor, hence it does
not endorse or recommend any securities or other investments.
Any recommendation contained in this report may not
be suitable for all investors and it is not to be deemed
an offer or solicitation on our part with respect to
the purchase or sale of any securities. All trademarks,
service marks and trade names appearing in this report
are the property of their respective owners, and are
likewise used for identification purposes only.
This report is a service available
only to active Paid Premium Members.
You may opt-out of receiving report notifications
at any time. Questions or comments may be submitted
by writing to Premium Membership Services 665 S.E. 10 Street, Suite 201 Deerfield Beach, FL 33441-5634 or by calling 1-800-965-8307
or 954-785-1121.
|
|
|

