You are not logged in.
This means you
CAN ONLY VIEW reports that were published prior to Thursday, April 24, 2025.
You
MUST UPGRADE YOUR MEMBERSHIP if you want to see any current reports.
AFTER MARKET UPDATE - FRIDAY, DECEMBER 9TH, 2011
Previous After Market Report Next After Market Report >>>
|
|
|
|
DOW |
+186.56 |
12,184.26 |
+1.55% |
|
Volume |
819,184,700 |
-12% |
|
Volume |
1,609,736,340 |
-9% |
|
NASDAQ |
+50.47 |
2,646.85 |
+1.94% |
|
Advancers |
2,576 |
83% |
|
Advancers |
2,094 |
79% |
|
S&P 500 |
+20.84 |
1,255.19 |
+1.69% |
|
Decliners |
444 |
14% |
|
Decliners |
461 |
17% |
|
Russell 2000 |
+22.72 |
745.40 |
+3.14% |
|
52 Wk Highs |
84 |
|
|
52 Wk Highs |
47 |
|
|
S&P 600 |
+13.00 |
414.51 |
+3.24% |
|
52 Wk Lows |
18 |
|
|
52 Wk Lows |
49 |
|
|
 |
Major Averages' Big Gains Friday Helped Them End Week Higher
Kenneth J. Gruneisen - Passed the CAN SLIM® Master's Exam
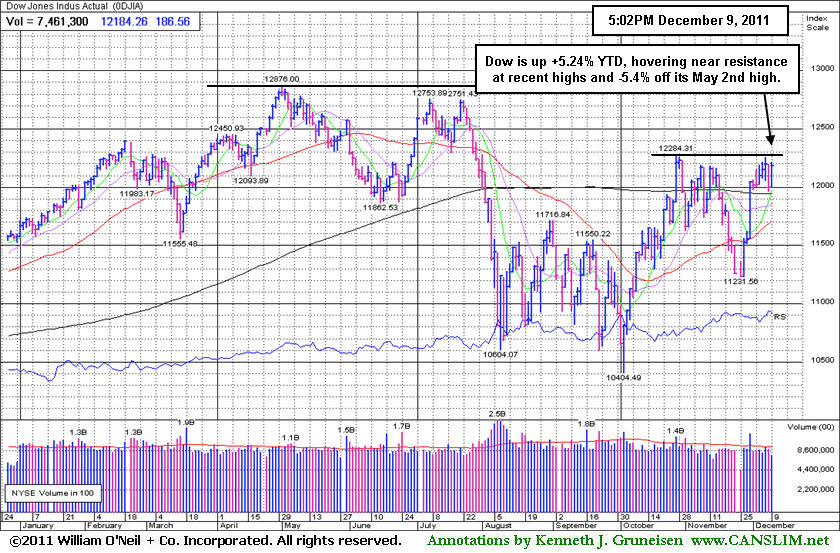
Markets closed Friday's trading near session highs with solid gains. Volume totals were reported lighter on the NYSE and on the Nasdaq exchange versus Thursday's session totals. For the week, the Dow Jones Industrial Average was up +1.4%, the S&P 500 Index rose +0.9%, and the Nasdaq Composite Index gained +0.8%. On the NYSE Friday advancing issues led decliners by nearly 6-1 and advancing issues led decliners by more than 4-1 on the Nasdaq exchange. New 52-week highs outnumbered new 52-week lows on the NYSE while new lows still narrowly led new highs on the Nasdaq exchange. There were 29 high-ranked companies from the CANSLIM.net Leaders List that made new 52-week highs and appeared on the CANSLIM.net BreakOuts Page, up from the prior session total of 7 stocks. There were gains for all of the 18 high-ranked companies currently included on the Featured Stocks Page.
Markets extended gains following positive results from the two-day European Union (EU) summit in Brussels and positive U.S. economic data. Specifically, 26 of the 27 EU leaders, all European Union nations except the United Kingdom, supported re-writing the union's treaty to adopt tighter budget regulations among the common currency region. Additionally, the leaders extended the bailout fund by 200 billion euros. A preliminary December U.S. consumer sentiment from the University of Michigan of 67.7 topped consensus expectations and the U.S. trade deficit narrowed by 1.6%. Separately, Moody's downgrade of three French banks had little effect in cooling the rally. European markets closed near session highs with the FTSE in London closing +0.8% higher, Germany's DAX gained +1.9% and the CAC in France finished +2.5% in the green.
Financial stocks were largely higher on EU optimism, and gains for Morgan Stanley (MS +3.15%) and Citigroup Inc (C +3.68%) helped repair part of the prior session's large losses. On the earnings front, Pall Corp. (PLL +7.92%) surged after topping expectations in first-quarter earnings. The Cooper Companies Inc (COO +16.59%) jumped after forecasting fiscal 2012 earnings above analysts' estimates. Energy stocks including Exxon Mobil Corp (XOM +1.84%) gained ground. Shares of General Electric (GE +3.25%) finished the day up after the conglomerate boosted its dividend to 17 cents a share. Chemical maker E. I. du Pont de Nemours and Company (DD -3.18%) fell after the company cut its full year earnings estimates.
Our monthly newsletter CANSLIM.net News will be published soon with an informative review of current market conditions, leading groups, and best buy candidates. Via the Premium Member Homepage links to all prior reports and webcasts are always available.
PICTURED: The Dow Jones Industrial Average is up +5.24% year-to-date (YTD), hovering near resistance at recent highs and -5.4% off its May 2nd high.
|
 Kenneth J. Gruneisen started out as a licensed stockbroker in August 1987, a couple of months prior to the historic stock market crash that took the Dow Jones Industrial Average down -22.6% in a single day. He has published daily fact-based fundamental and technical analysis on high-ranked stocks online for two decades. Through FACTBASEDINVESTING.COM, Kenneth provides educational articles, news, market commentary, and other information regarding proven investment systems that work in good times and bad.
Comments contained in the body of this report are technical opinions only and are not necessarily those of Gruneisen Growth Corp. The material herein has been obtained from sources believed to be reliable and accurate, however, its accuracy and completeness cannot be guaranteed. Our firm, employees, and customers may effect transactions, including transactions contrary to any recommendation herein, or have positions in the securities mentioned herein or options with respect thereto. Any recommendation contained in this report may not be suitable for all investors and it is not to be deemed an offer or solicitation on our part with respect to the purchase or sale of any securities. |
|
 |
Financial, Tech, and Energy-Linked Groups Led Gainers
Kenneth J. Gruneisen - Passed the CAN SLIM® Master's Exam
The Networking Index ($NWX +2.84%) led the tech sector higher on Friday while the Semiconductor Index ($SOX +1.22%), Biotechnology Index ($BTK +1.66%), and Internet Index ($IIX +1.93%) also posted solid gains. Financial shares were a positive influence as the Broker/Dealer Index ($XBD +2.13%) and Bank Index ($BKX +2.73%) helped underpin the major averages' gains, and the Retail Index ($RLX +1.00%) rose. Defensive groups including the Gold & Silver Index ($XAU +1.21%) and Healthcare Index ($HMO +1.69%) also got a lift, and strength in energy-related shares boosted the Oil Services Index ($OSX +2.77%) and the Integrated Oil Index ($XOI +2.23%).
Charts courtesy www.stockcharts.com
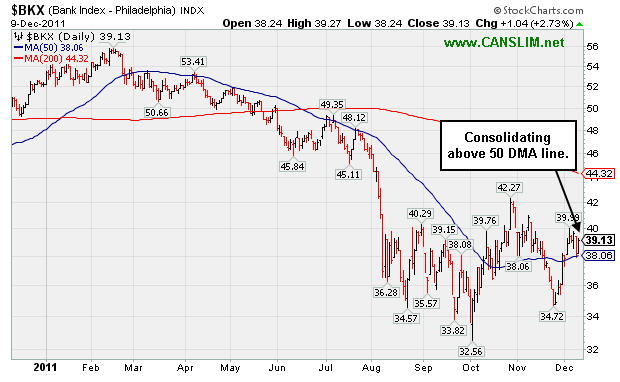
PICTURED: The Bank Index ($BKX +2.73%) is consolidating above its 50-day moving average (DMA) line.
| Oil Services |
$OSX |
230.06 |
+6.20 |
+2.77% |
-6.14% |
| Healthcare |
$HMO |
2,261.44 |
+37.52 |
+1.69% |
+33.66% |
| Integrated Oil |
$XOI |
1,227.50 |
+26.73 |
+2.23% |
+1.18% |
| Semiconductor |
$SOX |
375.67 |
+4.54 |
+1.22% |
-8.78% |
| Networking |
$NWX |
224.50 |
+6.19 |
+2.84% |
-19.98% |
| Internet |
$IIX |
287.60 |
+5.44 |
+1.93% |
-6.54% |
| Broker/Dealer |
$XBD |
86.29 |
+1.80 |
+2.13% |
-28.99% |
| Retail |
$RLX |
536.61 |
+5.33 |
+1.00% |
+5.55% |
| Gold & Silver |
$XAU |
200.64 |
+2.40 |
+1.21% |
-11.45% |
| Bank |
$BKX |
39.13 |
+1.04 |
+2.73% |
-25.05% |
| Biotech |
$BTK |
1,051.15 |
+17.13 |
+1.66% |
-18.99% |
|
|
|
 |
No Resistance Remains While Forming Late-Stage Base
Kenneth J. Gruneisen - Passed the CAN SLIM® Master's Exam
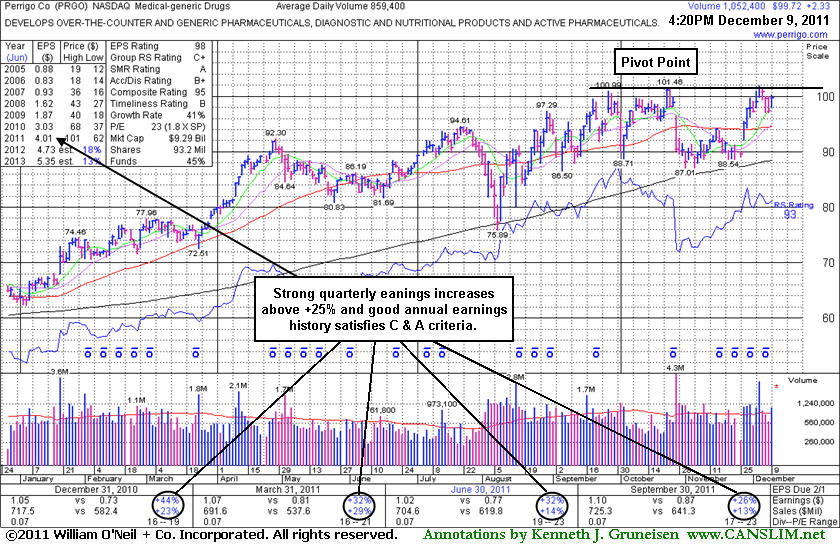
Perrigo Co (PRGO +$2.24 or +2.30% to $99.63) was featured in yellow in the mid-day report earlier today with a new pivot point cited based on its 10/25/11 high plus 10 cents. It has formed a late-stage base, while confirming gains above its pivot point are still needed to trigger a proper new technical buy signal.
It reported earnings +26% on +13% sales revenues for the quarter ended September 30, 2011 versus the year ago period. Strong quarterly and annual earnings history satisfies the C & A criteria of the investment system. Ownership by top-rated funds rose from 647 in Dec '10 to 703 in Sep '11, which is a reassuring trend concerning the I criteria. It found prompt support at its 200 DMA line during the latest consolidation from new all-time highs that were hit since it was last noted in the 10/04/11 mid-day report. Following its last appearance in this FSU section with an annotated graph on 7/13/11 under the headline, "New Orderly Base And Better Earnings Increases", it slumped its 200-day moving average (DMA) line and was dropped from the Featured Stocks list. Now it is considered a riskier late-stage setup. It faces no resistance due to overhead supply, but disciplined investors would watch for additional confirming gains with heavy volume.
|
|
|
Color Codes Explained :
Y - Better candidates highlighted by our
staff of experts.
G - Previously featured
in past reports as yellow but may no longer be buyable under the
guidelines.
***Last / Change / Volume data in this table is the closing quote data***
Symbol/Exchange
Company Name
Industry Group |
PRICE |
CHANGE
(%Change) |
Day High |
Volume
(% DAV)
(% 50 day avg vol) |
52 Wk Hi
% From Hi |
Featured
Date |
Price
Featured |
Pivot Featured |
|
Max Buy |
ADS
-
NYSE
Alliance Data Sys Corp
COMPUTER SOFTWARE and SERVICES - Information and Delivery Service
|
$103.70
|
+1.68
1.65% |
$104.23
|
651,012
68.53% of 50 DAV
50 DAV is 949,900
|
$107.33
-3.38%
|
10/21/2011
|
$97.94
|
PP = $101.15
|
|
MB = $106.21
|
 Most Recent Note - 12/9/2011 2:34:51 PM
Y - Quietly perched within close striking distance of its all-time high today. Holding its ground stubbornly after a spurt of gains helped it rally back above its 50 DMA line helping its technical stance improve.
>>> The latest Featured Stock Update with an annotated graph appeared on 11/17/2011. Click here.
View all notes |
Alert me of new notes |
CANSLIM.net Company Profile |
SEC |
Zacks Reports |
StockTalk |
News |
Chart |
Request a new note
C
A N
S L
I M


|
ALXN
-
NASDAQ
Alexion Pharmaceuticals
DRUGS - Drug Manufacturers - Other
|
$65.06
|
+0.88
1.37% |
$65.34
|
1,212,050
79.67% of 50 DAV
50 DAV is 1,521,300
|
$70.42
-7.61%
|
11/30/2011
|
$68.66
|
PP = $70.52
|
|
MB = $74.05
|
Most Recent Note - 12/9/2011 2:38:15 PM
G - Still sputtering below its 50 DMA line today, and its prior low ($62.02 on 11/21/11) defines the next important near-term support level to watch. A repair of its 50 DMA violation and volume-driven gains are needed to trigger a new (or add-on) technical buy signal.
>>> The latest Featured Stock Update with an annotated graph appeared on 11/14/2011. Click here.
View all notes |
Alert me of new notes |
CANSLIM.net Company Profile |
SEC |
Zacks Reports |
StockTalk |
News |
Chart |
Request a new note
C
A N
S L
I M
|
CELG
-
NASDAQ
Celgene Corp
DRUGS - Drug Manufacturers - Major
|
$63.58
|
+2.29
3.74% |
$63.71
|
3,986,010
103.76% of 50 DAV
50 DAV is 3,841,700
|
$68.25
-6.84%
|
9/16/2011
|
$61.21
|
PP = $62.59
|
|
MB = $65.72
|
Most Recent Note - 12/9/2011 2:18:03 PM
G - Solid gain today, rising within close range of its 50 DMA line. Gains above that short-term average would help its outlook improve, meanwhile it is -7.3% off its 52-week high. Its Relative Strength (RS) Rating has slumped to 81, down from 93 when shown in an 10/14/11 FSU analysis.
>>> The latest Featured Stock Update with an annotated graph appeared on 12/1/2011. Click here.
View all notes |
Alert me of new notes |
CANSLIM.net Company Profile |
SEC |
Zacks Reports |
StockTalk |
News |
Chart |
Request a new note
C
A N
S L
I M
|
FEIC
-
NASDAQ
F E I Co
ELECTRONICS - Diversified Electronics
|
$41.10
|
+1.22
3.06% |
$41.52
|
235,665
53.94% of 50 DAV
50 DAV is 436,900
|
$42.25
-2.72%
|
12/7/2011
|
$41.41
|
PP = $42.35
|
|
MB = $44.47
|
Most Recent Note - 12/9/2011 4:16:10 PM
Y - Up today on light volume, finishing within 50 cents of its best-ever close. Little resistance remains due to overhead supply. Color code was changed to yellow with new pivot point cited based on its 52-week high plus 10 cents. A volume-driven gain above the pivot point may trigger a technical buy signal.
>>> The latest Featured Stock Update with an annotated graph appeared on 11/25/2011. Click here.
View all notes |
Alert me of new notes |
CANSLIM.net Company Profile |
SEC |
Zacks Reports |
StockTalk |
News |
Chart |
Request a new note
C
A N
S L
I M
|
GNC
-
NYSE
G N C Holdings Inc
RETAIL - Drug Stores
|
$27.70
|
+1.25
4.73% |
$28.01
|
1,154,890
89.92% of 50 DAV
50 DAV is 1,284,300
|
$28.50
-2.81%
|
10/26/2011
|
$24.60
|
PP = $24.80
|
|
MB = $26.04
|
Most Recent Note - 12/9/2011 1:58:08 PM
G - Up today, trading within -3.1% of its all-time high and perched near a best-ever close. Prior chart highs and its 50 DMA line coincide in the $25-26 area defining important support to watch on pullbacks.
>>> The latest Featured Stock Update with an annotated graph appeared on 11/21/2011. Click here.
View all notes |
Alert me of new notes |
CANSLIM.net Company Profile |
SEC |
Zacks Reports |
StockTalk |
News |
Chart |
Request a new note
C
A N
S L
I M
|
Symbol/Exchange
Company Name
Industry Group |
PRICE |
CHANGE
(%Change) |
Day High |
Volume
(% DAV)
(% 50 day avg vol) |
52 Wk Hi
% From Hi |
Featured
Date |
Price
Featured |
Pivot Featured |
|
Max Buy |
HMSY
-
NASDAQ
H M S Holdings Corp
COMPUTER SOFTWARE and SERVICES - Healthcare Information Service
|
$31.66
|
+1.43
4.73% |
$32.16
|
1,182,051
174.19% of 50 DAV
50 DAV is 678,600
|
$31.99
-1.03%
|
10/27/2011
|
$26.44
|
PP = $28.37
|
|
MB = $29.79
|
Most Recent Note - 12/9/2011 12:53:49 PM
G - Poised for a best-ever close today and challenging its all-time high. It is extended from its prior base. Prior highs in the $27-28 area acted as support during the recent pullback.
>>> The latest Featured Stock Update with an annotated graph appeared on 11/30/2011. Click here.
View all notes |
Alert me of new notes |
CANSLIM.net Company Profile |
SEC |
Zacks Reports |
StockTalk |
News |
Chart |
Request a new note
C
A N
S L
I M
|
ISRG
-
NASDAQ
Intuitive Surgical Inc
HEALTH SERVICES - Medical Appliances and Equipment
|
$440.40
|
+10.40
2.42% |
$441.10
|
236,316
57.26% of 50 DAV
50 DAV is 412,700
|
$449.06
-1.93%
|
10/19/2011
|
$424.69
|
PP = $415.29
|
|
MB = $436.05
|
Most Recent Note - 12/9/2011 3:50:36 PM
G - Up today on light volume, its color code is changed to green while rising back above its "max buy" level within close striking distance of its all-time high. Found support recently well above its 50 DMA line near prior chart highs.
>>> The latest Featured Stock Update with an annotated graph appeared on 11/15/2011. Click here.
View all notes |
Alert me of new notes |
CANSLIM.net Company Profile |
SEC |
Zacks Reports |
StockTalk |
News |
Chart |
Request a new note
C
A N
S L
I M
|
MELI
-
NASDAQ
Mercadolibre Inc
INTERNET - Internet Software and; Services
|
$92.65
|
+3.34
3.74% |
$93.48
|
332,394
49.95% of 50 DAV
50 DAV is 665,400
|
$95.48
-2.96%
|
12/5/2011
|
$91.08
|
PP = $92.83
|
|
MB = $97.47
|
Most Recent Note - 12/9/2011 2:21:02 PM
Y - Quietly perched -3.3% off its 52-week high today, holding its ground near its pivot point. Its 12/06/11 rally above its pivot point with nearly 4 times average volume which triggered a technical buy signal. Disciplined investors limit losses if ever a stock falls -7% from their purchase price. See the latest FSU analysis for more details and a new annotated graph.
>>> The latest Featured Stock Update with an annotated graph appeared on 12/5/2011. Click here.
View all notes |
Alert me of new notes |
CANSLIM.net Company Profile |
SEC |
Zacks Reports |
StockTalk |
News |
Chart |
Request a new note
C
A N
S L
I M
|
MG
-
NYSE
Mistras Group Inc
DIVERSIFIED SERVICES - Bulding and Faci;ity Management Services
|
$24.37
|
+1.19
5.13% |
$24.57
|
77,747
37.54% of 50 DAV
50 DAV is 207,100
|
$25.28
-3.60%
|
10/28/2011
|
$22.49
|
PP = $23.61
|
|
MB = $24.79
|
Most Recent Note - 12/9/2011 2:22:40 PM
Y - Up today on very light volume, rising back above its pivot point. A solid gain and strong close on 12/05/11 with +55% above average volume triggered a technical buy signal. Prior highs in the $23 area define initial chart support to watch. See the latest FSU analysis for more details and a new annotated graph.
>>> The latest Featured Stock Update with an annotated graph appeared on 12/8/2011. Click here.
View all notes |
Alert me of new notes |
CANSLIM.net Company Profile |
SEC |
Zacks Reports |
StockTalk |
News |
Chart |
Request a new note
C
A N
S L
I M
|
MKTX
-
NASDAQ
Marketaxess Holdings Inc
FINANCIAL SERVICES - Investment Brokerage - Nationa
|
$28.45
|
+0.45
1.61% |
$28.73
|
199,804
82.53% of 50 DAV
50 DAV is 242,100
|
$31.45
-9.54%
|
10/28/2011
|
$29.79
|
PP = $31.05
|
|
MB = $32.60
|
Most Recent Note - 12/9/2011 4:19:35 PM
G - Consolidating just above its 50 DMA line today. It still faces previously stubborn resistance in the $31 area.
>>> The latest Featured Stock Update with an annotated graph appeared on 11/23/2011. Click here.
View all notes |
Alert me of new notes |
CANSLIM.net Company Profile |
SEC |
Zacks Reports |
StockTalk |
News |
Chart |
Request a new note
C
A N
S L
I M
|
Symbol/Exchange
Company Name
Industry Group |
PRICE |
CHANGE
(%Change) |
Day High |
Volume
(% DAV)
(% 50 day avg vol) |
52 Wk Hi
% From Hi |
Featured
Date |
Price
Featured |
Pivot Featured |
|
Max Buy |
OSIS
-
NASDAQ
O S I Systems Inc
ELECTRONICS - Semiconductor Equipment and Mate
|
$47.36
|
+1.64
3.59% |
$47.56
|
96,345
64.92% of 50 DAV
50 DAV is 148,400
|
$49.04
-3.43%
|
11/1/2011
|
$42.07
|
PP = $45.57
|
|
MB = $47.85
|
Most Recent Note - 12/9/2011 2:25:22 PM
Y - Up today without great volume conviction following a mild bout of distributional pressure. Its gap gain with +44% above average volume on 11/30/11 triggered a technical buy signal. Its 50 DMA line defines important support to watch.
>>> The latest Featured Stock Update with an annotated graph appeared on 11/28/2011. Click here.
View all notes |
Alert me of new notes |
CANSLIM.net Company Profile |
SEC |
Zacks Reports |
StockTalk |
News |
Chart |
Request a new note
C
A N
S L
I M
|
PRGO
-
NASDAQ
Perrigo Co
DRUGS - Drug Related Products
|
$99.63
|
+2.24
2.30% |
$100.23
|
1,115,379
131.61% of 50 DAV
50 DAV is 847,500
|
$101.94
-2.27%
|
12/9/2011
|
$99.54
|
PP = $101.56
|
|
MB = $106.64
|
Most Recent Note - 12/9/2011 1:08:20 PM
Y - Reported earnings +26% on +13% sales revenues for the quarter ended September 30, 2011 versus the year ago period. Color code is changed yellow since it has formed a late-stage base, while confirming gains above its pivot point are still needed to trigger a proper new technical buy signal. It found prompt support at its 200 DMA line during the latest consolidation from new all-time highs that were hit since it was last noted in the 10/04/11 mid-day report.
>>> The latest Featured Stock Update with an annotated graph appeared on 12/9/2011. Click here.
View all notes |
Alert me of new notes |
CANSLIM.net Company Profile |
SEC |
Zacks Reports |
StockTalk |
News |
Chart |
Request a new note
C
A N
S L
I M
|
RAX
-
NYSE
Rackspace Hosting Inc
INTERNET - Internet Software and; Services
|
$44.02
|
+1.69
3.99% |
$44.04
|
1,895,753
119.18% of 50 DAV
50 DAV is 1,590,600
|
$46.50
-5.32%
|
11/8/2011
|
$44.28
|
PP = $46.27
|
|
MB = $48.58
|
Most Recent Note - 12/9/2011 2:28:58 PM
Y - Up today, quietly rising within close striking distance of its 52-week and all-time high. Support to watch is at its closely coinciding 50 and 200 DMA lines. Subsequent violations would trigger damaging technical sell signals. See the latest FSU analysis for more details and a new annotated daily graph.
>>> The latest Featured Stock Update with an annotated graph appeared on 12/7/2011. Click here.
View all notes |
Alert me of new notes |
CANSLIM.net Company Profile |
SEC |
Zacks Reports |
StockTalk |
News |
Chart |
Request a new note
C
A N
S L
I M
|
SWI
-
NYSE
Solarwinds Inc
COMPUTER SOFTWARE and SERVICES - Application Software
|
$33.28
|
+1.69
5.35% |
$33.68
|
1,218,391
103.94% of 50 DAV
50 DAV is 1,172,200
|
$33.55
-0.80%
|
10/27/2011
|
$27.78
|
PP = $25.62
|
|
MB = $26.90
|
Most Recent Note - 12/9/2011 1:47:43 PM
G - Up today within close striking distance of a new all-time high. Extended from its prior base, its prior highs in the $25-26 area define initial chart support to watch on pullbacks.
>>> The latest Featured Stock Update with an annotated graph appeared on 11/22/2011. Click here.
View all notes |
Alert me of new notes |
CANSLIM.net Company Profile |
SEC |
Zacks Reports |
StockTalk |
News |
Chart |
Request a new note
C
A N
S L
I M
|
TDG
-
NYSE
Transdigm Group Inc
AEROSPACE/DEFENSE - Aerospace/Defense Products and; Services
|
$97.35
|
+2.85
3.02% |
$97.71
|
210,694
51.02% of 50 DAV
50 DAV is 413,000
|
$102.73
-5.24%
|
11/9/2011
|
$98.45
|
PP = $95.14
|
|
MB = $99.90
|
Most Recent Note - 12/9/2011 3:44:06 PM
Y - Up today on light volume, trading within close striking distance of its best-ever close. A subsequent slump below the recent low and its 50 DMA line would trigger technical sell signals. See the latest FSU analysis for more details and a new annotated graph.
>>> The latest Featured Stock Update with an annotated graph appeared on 12/6/2011. Click here.
View all notes |
Alert me of new notes |
CANSLIM.net Company Profile |
SEC |
Zacks Reports |
StockTalk |
News |
Chart |
Request a new note
C
A N
S L
I M
|
Symbol/Exchange
Company Name
Industry Group |
PRICE |
CHANGE
(%Change) |
Day High |
Volume
(% DAV)
(% 50 day avg vol) |
52 Wk Hi
% From Hi |
Featured
Date |
Price
Featured |
Pivot Featured |
|
Max Buy |
UA
-
NYSE
Under Armour Inc Cl A
CONSUMER NON-DURABLES - Textile - Apparel Clothing
|
$82.70
|
+2.80
3.50% |
$82.95
|
726,779
54.71% of 50 DAV
50 DAV is 1,328,400
|
$87.40
-5.38%
|
10/25/2011
|
$82.43
|
PP = $80.80
|
|
MB = $84.84
|
Most Recent Note - 12/9/2011 3:45:39 PM
G - Up today with light volume, consolidating just above its 50 DMA line and recent low ($73.55 on 11/21/11) defining important support to watch.
>>> The latest Featured Stock Update with an annotated graph appeared on 11/29/2011. Click here.
View all notes |
Alert me of new notes |
CANSLIM.net Company Profile |
SEC |
Zacks Reports |
StockTalk |
News |
Chart |
Request a new note
C
A N
S L
I M
|
ULTA
-
NASDAQ
Ulta Salon Cosm & Frag
SPECIALTY RETAIL - Specialty Retail, Other
|
$74.06
|
+1.93
2.68% |
$74.34
|
769,278
72.68% of 50 DAV
50 DAV is 1,058,400
|
$75.70
-2.17%
|
12/2/2011
|
$72.88
|
PP = $75.79
|
|
MB = $79.58
|
Most Recent Note - 12/9/2011 3:47:29 PM
Y - Holding its ground stubbornly with volume totals cooling since touching a new 52-week high when noted in the 12/05/11 mid-day report - "No resistance remains due to overhead supply and it may be working on a late-stage "square box" type base pattern. Its fundamentals (C and A criteria) remain strong. Color code is changed to yellow with new pivot point based on its 52-week high plus 10 cents."
>>> The latest Featured Stock Update with an annotated graph appeared on 12/2/2011. Click here.
View all notes |
Alert me of new notes |
CANSLIM.net Company Profile |
SEC |
Zacks Reports |
StockTalk |
News |
Chart |
Request a new note
C
A N
S L
I M
|
V
-
NYSE
Visa Inc Cl A
DIVERSIFIED SERVICES - Business/Management Services
|
$97.19
|
+1.39
1.45% |
$97.46
|
2,993,419
56.43% of 50 DAV
50 DAV is 5,305,100
|
$98.60
-1.43%
|
10/24/2011
|
$94.21
|
PP = $94.85
|
|
MB = $99.59
|
Most Recent Note - 12/9/2011 3:48:47 PM
Y - Still hovering near its 52-week high with volume totals recently cooling. Proof of serious institutional demand requires at least +50% heavier than average volume behind a meaningful gain.
>>> The latest Featured Stock Update with an annotated graph appeared on 11/18/2011. Click here.
View all notes |
Alert me of new notes |
CANSLIM.net Company Profile |
SEC |
Zacks Reports |
StockTalk |
News |
Chart |
Request a new note
C
A N
S L
I M
|
|
|
|
THESE ARE NOT BUY RECOMMENDATIONS!
Comments contained in the body of this report are technical
opinions only. The material herein has been obtained
from sources believed to be reliable and accurate, however,
its accuracy and completeness cannot be guaranteed.
This site is not an investment advisor, hence it does
not endorse or recommend any securities or other investments.
Any recommendation contained in this report may not
be suitable for all investors and it is not to be deemed
an offer or solicitation on our part with respect to
the purchase or sale of any securities. All trademarks,
service marks and trade names appearing in this report
are the property of their respective owners, and are
likewise used for identification purposes only.
This report is a service available
only to active Paid Premium Members.
You may opt-out of receiving report notifications
at any time. Questions or comments may be submitted
by writing to Premium Membership Services 665 S.E. 10 Street, Suite 201 Deerfield Beach, FL 33441-5634 or by calling 1-800-965-8307
or 954-785-1121.
|
|
|

