You are not logged in.
This means you
CAN ONLY VIEW reports that were published prior to Tuesday, April 15, 2025.
You
MUST UPGRADE YOUR MEMBERSHIP if you want to see any current reports.
AFTER MARKET UPDATE - THURSDAY, DECEMBER 8TH, 2011
Previous After Market Report Next After Market Report >>>
|
|
|
|
DOW |
-198.67 |
11,997.70 |
-1.63% |
|
Volume |
930,336,180 |
-4% |
|
Volume |
1,777,701,190 |
+10% |
|
NASDAQ |
-52.83 |
2,596.38 |
-1.99% |
|
Advancers |
394 |
13% |
|
Advancers |
361 |
14% |
|
S&P 500 |
-26.66 |
1,234.35 |
-2.11% |
|
Decliners |
2,615 |
85% |
|
Decliners |
2,172 |
83% |
|
Russell 2000 |
-23.46 |
722.68 |
-3.14% |
|
52 Wk Highs |
83 |
|
|
52 Wk Highs |
17 |
|
|
S&P 600 |
-12.88 |
401.51 |
-3.11% |
|
52 Wk Lows |
19 |
|
|
52 Wk Lows |
70 |
|
|
 |
Breadth Negative as Major Averages Retreat
Kenneth J. Gruneisen - Passed the CAN SLIM® Master's Exam
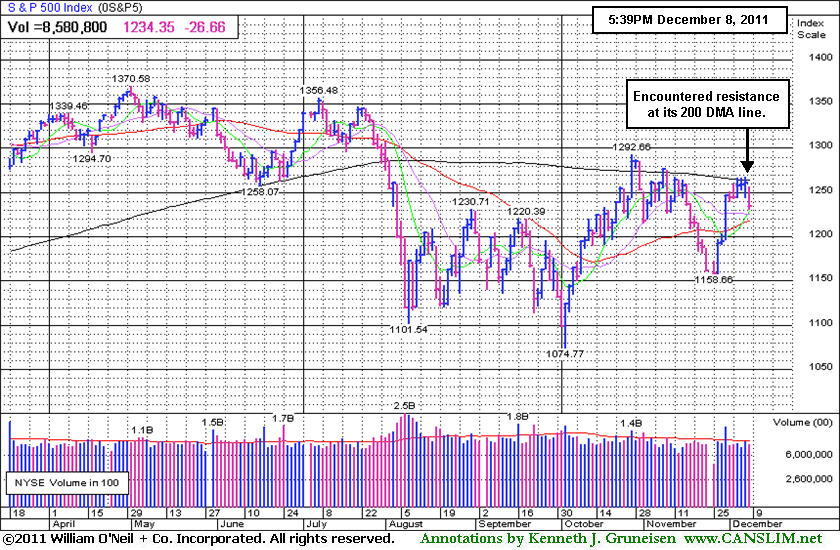
Stocks closed Thursday with all major U.S. averages at session lows. Volume totals were reported mixed, slightly lighter on the NYSE and slightly higher on the Nasdaq exchange versus the prior session totals. On the NYSE and on the Nasdaq exchange decliners outnumbered advancing issues 6-1. New 52-week highs outnumbered new 52-week lows on the NYSE while new lows led new highs on the Nasdaq exchange. There were 7 high-ranked companies from the CANSLIM.net Leaders List that made new 52-week highs and appeared on the CANSLIM.net BreakOuts Page, down from the prior session total of 21 stocks. There were losses for all of the 17 high-ranked companies currently included on the Featured Stocks Page.
Positive U.S. economic data and an unexpected rate cut by the ECB were overshadowed by disparaging comments from Europe's Central Bank head. Optimism was high in the pre-market following the ECB's move to cut the benchmark interest rate to 1% and a better-than-expected weekly jobless claims reading of 381,000. Despite this, markets opened in the red following a statement from ECB President Mario Draghi that indicated the Bank would not consider accelerated bond purchases to stave off the bloc's debt crisis. Losses widened into the closing bell as reports broke that Germany had rejected some of the draft measures from the two day EU summit.
The financial sector had the deepest losses of the day with Morgan Stanley (MS -8.42%) and Citigroup Inc (C -6.97%) falling. McDonald's Corp (MCD +0.49%) was the only gainer on the Dow, after posting positive global sales comps on strong demand in Asia.
Flight to safety bids had the 10-year treasury advancing 9/16 to yield 1.97%. Commodities traded lower as well with oil falling -$2.63 to $97.86 per barrel and gold retreating $33.30 to $1,711.50 an ounce.
Our monthly newsletter CANSLIM.net News will be published soon with an informative review of current market conditions, leading groups, and best buy candidates. Via the Premium Member Homepage links to all prior reports and webcasts are always available.
PICTURED: The S&P 500 Index encountered resistance at its 200-day moving average (DMA) line recently.
|
 Kenneth J. Gruneisen started out as a licensed stockbroker in August 1987, a couple of months prior to the historic stock market crash that took the Dow Jones Industrial Average down -22.6% in a single day. He has published daily fact-based fundamental and technical analysis on high-ranked stocks online for two decades. Through FACTBASEDINVESTING.COM, Kenneth provides educational articles, news, market commentary, and other information regarding proven investment systems that work in good times and bad.
Comments contained in the body of this report are technical opinions only and are not necessarily those of Gruneisen Growth Corp. The material herein has been obtained from sources believed to be reliable and accurate, however, its accuracy and completeness cannot be guaranteed. Our firm, employees, and customers may effect transactions, including transactions contrary to any recommendation herein, or have positions in the securities mentioned herein or options with respect thereto. Any recommendation contained in this report may not be suitable for all investors and it is not to be deemed an offer or solicitation on our part with respect to the purchase or sale of any securities. |
|
 |
Financial Shares Led Declines
Kenneth J. Gruneisen - Passed the CAN SLIM® Master's Exam
Financial shares led the declining groups as the Broker/Dealer Index ($XBD -4.17%) and Bank Index ($BKX -3.93%) fell hardest on Thursday. The tech sector saw unanimous losses from the Networking Index ($NWX -3.28%), Semiconductor Index ($SOX -2.81%), Biotechnology Index ($BTK -2.39%), and Internet Index ($IIX -2.01%). The Retail Index ($RLX -1.69%) ended modestly lower and defensive and energy-related shares fell as the Gold & Silver Index ($XAU -3.26%), Healthcare Index ($HMO -3.11%), Oil Services Index ($OSX -2.99%), and Integrated Oil Index ($XOI -2.97%) rounded out a day of widespread losses.
Charts courtesy www.stockcharts.com
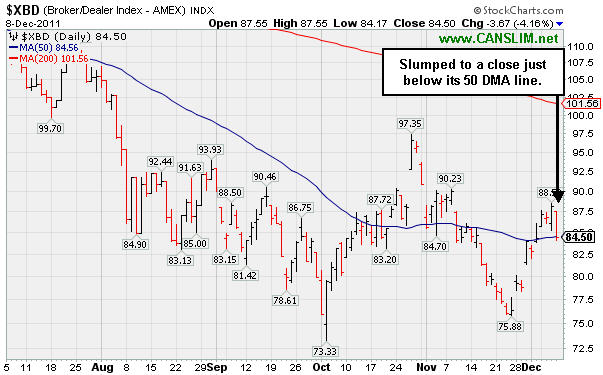
PICTURED: The Broker/Dealer Index ($XBD -4.17%) slumped to a close just under its 50-day moving average (DMA) line.
| Oil Services |
$OSX |
223.86 |
-6.91 |
-2.99% |
-8.67% |
| Healthcare |
$HMO |
2,223.92 |
-71.27 |
-3.11% |
+31.44% |
| Integrated Oil |
$XOI |
1,200.77 |
-36.76 |
-2.97% |
-1.02% |
| Semiconductor |
$SOX |
371.13 |
-10.72 |
-2.81% |
-9.88% |
| Networking |
$NWX |
218.31 |
-7.40 |
-3.28% |
-22.19% |
| Internet |
$IIX |
282.16 |
-5.78 |
-2.01% |
-8.31% |
| Broker/Dealer |
$XBD |
84.49 |
-3.68 |
-4.17% |
-30.47% |
| Retail |
$RLX |
531.28 |
-9.15 |
-1.69% |
+4.50% |
| Gold & Silver |
$XAU |
198.24 |
-6.68 |
-3.26% |
-12.51% |
| Bank |
$BKX |
38.09 |
-1.56 |
-3.93% |
-27.04% |
| Biotech |
$BTK |
1,034.02 |
-25.29 |
-2.39% |
-20.31% |
|
|
|
 |
Pullback On Light Volume Just Undercut Pivot Point
Kenneth J. Gruneisen - Passed the CAN SLIM® Master's Exam
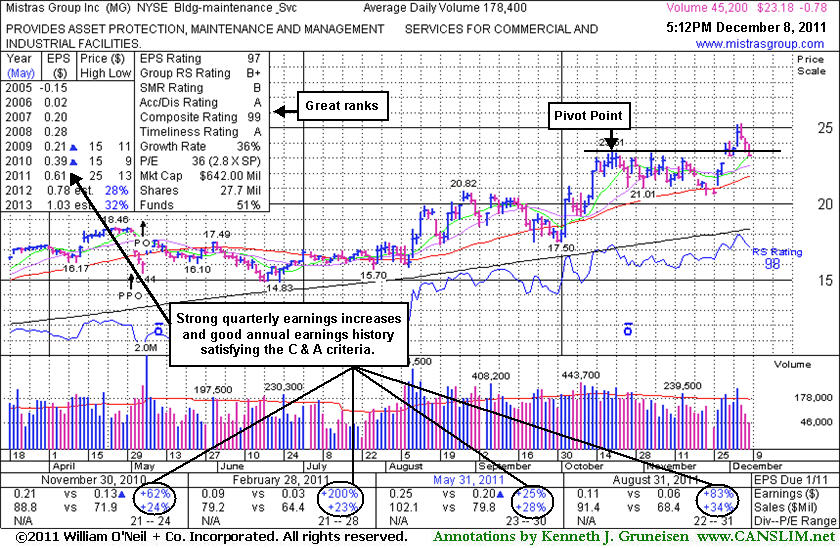
Mistras Group Inc (MG -$0.78 or -3.26% to $23.18) was down today for a 3rd consecutive small loss on lighter than average volume, slumping just below its pivot point. A solid gain and strong close on 12/05/11 with +55% above average volume triggered a technical buy signal. Prior highs in the $23 area define initial chart support to watch, so any more damaging losses in the near-term may raise concerns.
In its last appearance in this FSU section on 11/11/11 with an annotated daily graph under the headline, "Volume Cooling While Perched -7% from 52-Week High", it was consolidating in tight trading range. The Building - Maintenance Services group has improved in its Group Relative Strength Rating (now 76), up from 49, a reassuring sign concerning the L criteria which calls for leadership in the industry group. After continued consolidating it found support near its 50-day moving average (DMA) line and prior chart highs before its latest breakout.
It has maintained its solid earnings history concerning the C and A criteria. The number of top-rated funds owning its shares rose from 99 in Sep '10 to 157 in Sep '11, a reassuring sign concerning the I criteria. After its 5/05/11 Public Offering the company management's still large 47% ownership interest keeps them very motivated to look after and build shareholder value. The small supply (S criteria) of only 27.7 million shares outstanding and 14.7 million in the public float can contribute to greater price volatility in the event of institutional buying or selling. Disciplined investors always limit losses at 7-8% if ever a stock falls that much after purchased.
|
|
|
Color Codes Explained :
Y - Better candidates highlighted by our
staff of experts.
G - Previously featured
in past reports as yellow but may no longer be buyable under the
guidelines.
***Last / Change / Volume data in this table is the closing quote data***
Symbol/Exchange
Company Name
Industry Group |
PRICE |
CHANGE
(%Change) |
Day High |
Volume
(% DAV)
(% 50 day avg vol) |
52 Wk Hi
% From Hi |
Featured
Date |
Price
Featured |
Pivot Featured |
|
Max Buy |
ADS
-
NYSE
Alliance Data Sys Corp
COMPUTER SOFTWARE and SERVICES - Information and Delivery Service
|
$102.02
|
-1.27
-1.23% |
$103.12
|
538,388
56.68% of 50 DAV
50 DAV is 949,900
|
$107.33
-4.95%
|
10/21/2011
|
$97.94
|
PP = $101.15
|
|
MB = $106.21
|
Most Recent Note - 12/6/2011 12:46:36 PM
Y - Small gap down today after touching a new all-time high on the prior session while capping a streak of 6 consecutive gains.
>>> The latest Featured Stock Update with an annotated graph appeared on 11/17/2011. Click here.
View all notes |
Alert me of new notes |
CANSLIM.net Company Profile |
SEC |
Zacks Reports |
StockTalk |
News |
Chart |
Request a new note
C
A N
S L
I M


|
ALXN
-
NASDAQ
Alexion Pharmaceuticals
DRUGS - Drug Manufacturers - Other
|
$64.18
|
-0.27
-0.42% |
$65.09
|
837,304
55.04% of 50 DAV
50 DAV is 1,521,300
|
$70.42
-8.86%
|
11/30/2011
|
$68.66
|
PP = $70.52
|
|
MB = $74.05
|
Most Recent Note - 12/5/2011 5:00:04 PM
G - Pulled back today with slightly above average volume and slumped below its 50 DMA line raising concerns so its color code is changed to green. A repair of its 50 DMA violation and volume-driven gains are needed to trigger a new (or add-on) technical buy signal.
>>> The latest Featured Stock Update with an annotated graph appeared on 11/14/2011. Click here.
View all notes |
Alert me of new notes |
CANSLIM.net Company Profile |
SEC |
Zacks Reports |
StockTalk |
News |
Chart |
Request a new note
C
A N
S L
I M
|
CELG
-
NASDAQ
Celgene Corp
DRUGS - Drug Manufacturers - Major
|
$61.29
|
-1.36
-2.17% |
$62.71
|
2,499,685
65.07% of 50 DAV
50 DAV is 3,841,700
|
$68.25
-10.20%
|
9/16/2011
|
$61.21
|
PP = $62.59
|
|
MB = $65.72
|
 Most Recent Note - 12/8/2011 12:57:22 PM
G - Gains above its short-term average are needed for its outlook to improve. Its is still consolidating within -10% of its 52-week high, however its Relative Strength (RS) Rating has slumped to 82, down from 93 when shown in an 10/14/11 FSU analysis.
>>> The latest Featured Stock Update with an annotated graph appeared on 12/1/2011. Click here.
View all notes |
Alert me of new notes |
CANSLIM.net Company Profile |
SEC |
Zacks Reports |
StockTalk |
News |
Chart |
Request a new note
C
A N
S L
I M
|
FEIC
-
NASDAQ
F E I Co
ELECTRONICS - Diversified Electronics
|
$39.88
|
-1.53
-3.69% |
$41.48
|
272,021
62.26% of 50 DAV
50 DAV is 436,900
|
$42.25
-5.61%
|
12/7/2011
|
$41.41
|
PP = $42.35
|
|
MB = $44.47
|
Most Recent Note - 12/8/2011 5:09:50 PM
Y - Loss today on below average volume. Little resistance remains due to overhead supply. Color code was changed to yellow with new pivot point cited based on its 52-week high plus 10 cents. A volume-driven gain above the pivot point may trigger a technical buy signal.
>>> The latest Featured Stock Update with an annotated graph appeared on 11/25/2011. Click here.
View all notes |
Alert me of new notes |
CANSLIM.net Company Profile |
SEC |
Zacks Reports |
StockTalk |
News |
Chart |
Request a new note
C
A N
S L
I M
|
GNC
-
NYSE
G N C Holdings Inc
RETAIL - Drug Stores
|
$26.45
|
-0.36
-1.34% |
$26.89
|
490,722
38.21% of 50 DAV
50 DAV is 1,284,300
|
$28.50
-7.19%
|
10/26/2011
|
$24.60
|
PP = $24.80
|
|
MB = $26.04
|
Most Recent Note - 12/7/2011 6:17:25 PM
G - Finished near the session high today with a 3rd consecutive small loss on below average volume, finishing -5.9% off its all-time high. Prior chart highs in the $25-26 area define initial support to watch on pullbacks.
>>> The latest Featured Stock Update with an annotated graph appeared on 11/21/2011. Click here.
View all notes |
Alert me of new notes |
CANSLIM.net Company Profile |
SEC |
Zacks Reports |
StockTalk |
News |
Chart |
Request a new note
C
A N
S L
I M
|
Symbol/Exchange
Company Name
Industry Group |
PRICE |
CHANGE
(%Change) |
Day High |
Volume
(% DAV)
(% 50 day avg vol) |
52 Wk Hi
% From Hi |
Featured
Date |
Price
Featured |
Pivot Featured |
|
Max Buy |
HMSY
-
NASDAQ
H M S Holdings Corp
COMPUTER SOFTWARE and SERVICES - Healthcare Information Service
|
$30.23
|
-0.72
-2.33% |
$30.73
|
519,812
76.60% of 50 DAV
50 DAV is 678,600
|
$31.99
-5.50%
|
10/27/2011
|
$26.44
|
PP = $28.37
|
|
MB = $29.79
|
Most Recent Note - 12/8/2011 1:05:32 PM
G - Pulling back today on light volume following 4 consecutive small gains for best-ever closes just above its "max buy" level. Prior highs in the $27-28 area acted as support during the recent pullback. See the latest FSU analysis for more details and a new annotated weekly graph.
>>> The latest Featured Stock Update with an annotated graph appeared on 11/30/2011. Click here.
View all notes |
Alert me of new notes |
CANSLIM.net Company Profile |
SEC |
Zacks Reports |
StockTalk |
News |
Chart |
Request a new note
C
A N
S L
I M
|
ISRG
-
NASDAQ
Intuitive Surgical Inc
HEALTH SERVICES - Medical Appliances and Equipment
|
$430.00
|
-9.88
-2.25% |
$440.57
|
194,314
47.08% of 50 DAV
50 DAV is 412,700
|
$449.06
-4.24%
|
10/19/2011
|
$424.69
|
PP = $415.29
|
|
MB = $436.05
|
Most Recent Note - 12/7/2011 6:40:21 PM
Y - Still perched within close striking distance of its all-time high. Found support recently well above its 50 DMA line near prior chart highs.
>>> The latest Featured Stock Update with an annotated graph appeared on 11/15/2011. Click here.
View all notes |
Alert me of new notes |
CANSLIM.net Company Profile |
SEC |
Zacks Reports |
StockTalk |
News |
Chart |
Request a new note
C
A N
S L
I M
|
MELI
-
NASDAQ
Mercadolibre Inc
INTERNET - Internet Software and; Services
|
$89.31
|
-4.38
-4.67% |
$93.33
|
746,536
112.19% of 50 DAV
50 DAV is 665,400
|
$95.48
-6.46%
|
12/5/2011
|
$91.08
|
PP = $92.83
|
|
MB = $97.47
|
Most Recent Note - 12/8/2011 11:49:30 AM
Y - Quietly pulling back today following volume-driven gains to new 52-week highs. Its 12/06/11 rally above its pivot point with nearly 4 times average volume which triggered a technical buy signal. Disciplined investors limit losses if ever a stock falls -7% from their purchase price. See the latest FSU analysis for more details and a new annotated graph.
>>> The latest Featured Stock Update with an annotated graph appeared on 12/5/2011. Click here.
View all notes |
Alert me of new notes |
CANSLIM.net Company Profile |
SEC |
Zacks Reports |
StockTalk |
News |
Chart |
Request a new note
C
A N
S L
I M
|
MG
-
NYSE
Mistras Group Inc
DIVERSIFIED SERVICES - Bulding and Faci;ity Management Services
|
$23.18
|
-0.78
-3.26% |
$23.90
|
45,285
21.87% of 50 DAV
50 DAV is 207,100
|
$25.28
-8.31%
|
10/28/2011
|
$22.49
|
PP = $23.61
|
|
MB = $24.79
|
Most Recent Note - 12/8/2011 5:33:18 PM
Y - Down today for a 3rd consecutive small loss on lighter than average volume, slumping just below its pivot point. A solid gain and strong close on 12/05/11 with +55% above average volume triggered a technical buy signal. Prior highs in the $23 area define initial chart support to watch. See the latest FSU analysis for more details and a new annotated graph.
>>> The latest Featured Stock Update with an annotated graph appeared on 12/8/2011. Click here.
View all notes |
Alert me of new notes |
CANSLIM.net Company Profile |
SEC |
Zacks Reports |
StockTalk |
News |
Chart |
Request a new note
C
A N
S L
I M
|
MKTX
-
NASDAQ
Marketaxess Holdings Inc
FINANCIAL SERVICES - Investment Brokerage - Nationa
|
$28.00
|
-0.79
-2.74% |
$28.81
|
175,847
72.63% of 50 DAV
50 DAV is 242,100
|
$31.45
-10.97%
|
10/28/2011
|
$29.79
|
PP = $31.05
|
|
MB = $32.60
|
Most Recent Note - 12/8/2011 5:38:20 PM
G - Down today, pulling back near its 50 DMA line. It still faces previously stubborn resistance in the $31 area.
>>> The latest Featured Stock Update with an annotated graph appeared on 11/23/2011. Click here.
View all notes |
Alert me of new notes |
CANSLIM.net Company Profile |
SEC |
Zacks Reports |
StockTalk |
News |
Chart |
Request a new note
C
A N
S L
I M
|
Symbol/Exchange
Company Name
Industry Group |
PRICE |
CHANGE
(%Change) |
Day High |
Volume
(% DAV)
(% 50 day avg vol) |
52 Wk Hi
% From Hi |
Featured
Date |
Price
Featured |
Pivot Featured |
|
Max Buy |
OSIS
-
NASDAQ
O S I Systems Inc
ELECTRONICS - Semiconductor Equipment and Mate
|
$45.72
|
-2.11
-4.41% |
$47.92
|
126,650
85.34% of 50 DAV
50 DAV is 148,400
|
$49.04
-6.77%
|
11/1/2011
|
$42.07
|
PP = $45.57
|
|
MB = $47.85
|
Most Recent Note - 12/8/2011 11:53:09 AM
Y - Quietly pulling back today. Held its ground stubbornly with volume totals cooling since its gap gain with +44% above average volume on 11/30/11 triggered a technical buy signal. Its 50 DMA line defines important support to watch.
>>> The latest Featured Stock Update with an annotated graph appeared on 11/28/2011. Click here.
View all notes |
Alert me of new notes |
CANSLIM.net Company Profile |
SEC |
Zacks Reports |
StockTalk |
News |
Chart |
Request a new note
C
A N
S L
I M
|
RAX
-
NYSE
Rackspace Hosting Inc
INTERNET - Internet Software and; Services
|
$42.33
|
-0.45
-1.05% |
$43.17
|
1,134,730
71.34% of 50 DAV
50 DAV is 1,590,600
|
$46.50
-8.96%
|
11/8/2011
|
$44.28
|
PP = $46.27
|
|
MB = $48.58
|
Most Recent Note - 12/7/2011 6:37:22 PM
Y - Quietly perched within close striking distance of its 52-week and all-time high. Support to watch is at its closely coinciding 50 and 200 DMA lines. Subsequent violations would trigger damaging technical sell signals. See the latest FSU analysis for more details and a new annotated daily graph.
>>> The latest Featured Stock Update with an annotated graph appeared on 12/7/2011. Click here.
View all notes |
Alert me of new notes |
CANSLIM.net Company Profile |
SEC |
Zacks Reports |
StockTalk |
News |
Chart |
Request a new note
C
A N
S L
I M
|
SWI
-
NYSE
Solarwinds Inc
COMPUTER SOFTWARE and SERVICES - Application Software
|
$31.59
|
-0.48
-1.50% |
$32.37
|
729,759
62.26% of 50 DAV
50 DAV is 1,172,200
|
$33.55
-5.84%
|
10/27/2011
|
$27.78
|
PP = $25.62
|
|
MB = $26.90
|
Most Recent Note - 12/7/2011 5:49:27 PM
G - Down today with below average volume, pulling back from its all-time high. Extended from its prior base, its prior highs in the $25-26 area define initial chart support to watch on pullbacks.
>>> The latest Featured Stock Update with an annotated graph appeared on 11/22/2011. Click here.
View all notes |
Alert me of new notes |
CANSLIM.net Company Profile |
SEC |
Zacks Reports |
StockTalk |
News |
Chart |
Request a new note
C
A N
S L
I M
|
TDG
-
NYSE
Transdigm Group Inc
AEROSPACE/DEFENSE - Aerospace/Defense Products and; Services
|
$94.50
|
-0.52
-0.55% |
$95.35
|
315,206
76.32% of 50 DAV
50 DAV is 413,000
|
$102.73
-8.01%
|
11/9/2011
|
$98.45
|
PP = $95.14
|
|
MB = $99.90
|
Most Recent Note - 12/6/2011 5:32:15 PM
Y - Small loss today on light volume. It stayed well above its 50 DMA line during its recent consolidation. A subsequent slump below the recent low and its 50 DMA line would trigger technical sell signals. See the latest FSU analysis for more details and a new annotated graph.
>>> The latest Featured Stock Update with an annotated graph appeared on 12/6/2011. Click here.
View all notes |
Alert me of new notes |
CANSLIM.net Company Profile |
SEC |
Zacks Reports |
StockTalk |
News |
Chart |
Request a new note
C
A N
S L
I M
|
UA
-
NYSE
Under Armour Inc Cl A
CONSUMER NON-DURABLES - Textile - Apparel Clothing
|
$79.90
|
-2.32
-2.82% |
$82.64
|
622,277
46.84% of 50 DAV
50 DAV is 1,328,400
|
$87.40
-8.58%
|
10/25/2011
|
$82.43
|
PP = $80.80
|
|
MB = $84.84
|
Most Recent Note - 12/8/2011 5:36:54 PM
G - Down today for a 3rd consecutive loss with lighter than average volume. Its 50 DMA line and recent low ($73.55 on 11/21/11) define important support to watch.
>>> The latest Featured Stock Update with an annotated graph appeared on 11/29/2011. Click here.
View all notes |
Alert me of new notes |
CANSLIM.net Company Profile |
SEC |
Zacks Reports |
StockTalk |
News |
Chart |
Request a new note
C
A N
S L
I M
|
Symbol/Exchange
Company Name
Industry Group |
PRICE |
CHANGE
(%Change) |
Day High |
Volume
(% DAV)
(% 50 day avg vol) |
52 Wk Hi
% From Hi |
Featured
Date |
Price
Featured |
Pivot Featured |
|
Max Buy |
ULTA
-
NASDAQ
Ulta Salon Cosm & Frag
SPECIALTY RETAIL - Specialty Retail, Other
|
$72.13
|
-1.00
-1.37% |
$73.18
|
633,129
59.82% of 50 DAV
50 DAV is 1,058,400
|
$75.70
-4.72%
|
12/2/2011
|
$72.88
|
PP = $75.79
|
|
MB = $79.58
|
Most Recent Note - 12/5/2011 12:30:58 PM
Y - Touching a new 52-week high today. No resistance remains due to overhead supply and it may be working on a late-stage "square box" type base pattern. Its fundamentals (C and A criteria) remain strong. Color code is changed to yellow with new pivot point based on its 52-week high plus 10 cents.
>>> The latest Featured Stock Update with an annotated graph appeared on 12/2/2011. Click here.
View all notes |
Alert me of new notes |
CANSLIM.net Company Profile |
SEC |
Zacks Reports |
StockTalk |
News |
Chart |
Request a new note
C
A N
S L
I M
|
V
-
NYSE
Visa Inc Cl A
DIVERSIFIED SERVICES - Business/Management Services
|
$95.80
|
-1.27
-1.31% |
$97.87
|
3,559,477
67.10% of 50 DAV
50 DAV is 5,305,100
|
$98.60
-2.84%
|
10/24/2011
|
$94.21
|
PP = $94.85
|
|
MB = $99.59
|
Most Recent Note - 12/7/2011 6:38:53 PM
Y - Still perched near its 52-week high. Proof of serious institutional demand requires at least +50% heavier than average volume behind a meaningful gain.
>>> The latest Featured Stock Update with an annotated graph appeared on 11/18/2011. Click here.
View all notes |
Alert me of new notes |
CANSLIM.net Company Profile |
SEC |
Zacks Reports |
StockTalk |
News |
Chart |
Request a new note
C
A N
S L
I M
|
|
|
|
THESE ARE NOT BUY RECOMMENDATIONS!
Comments contained in the body of this report are technical
opinions only. The material herein has been obtained
from sources believed to be reliable and accurate, however,
its accuracy and completeness cannot be guaranteed.
This site is not an investment advisor, hence it does
not endorse or recommend any securities or other investments.
Any recommendation contained in this report may not
be suitable for all investors and it is not to be deemed
an offer or solicitation on our part with respect to
the purchase or sale of any securities. All trademarks,
service marks and trade names appearing in this report
are the property of their respective owners, and are
likewise used for identification purposes only.
This report is a service available
only to active Paid Premium Members.
You may opt-out of receiving report notifications
at any time. Questions or comments may be submitted
by writing to Premium Membership Services 665 S.E. 10 Street, Suite 201 Deerfield Beach, FL 33441-5634 or by calling 1-800-965-8307
or 954-785-1121.
|
|
|

