You are not logged in.
This means you
CAN ONLY VIEW reports that were published prior to Monday, February 26, 2024.
You
MUST UPGRADE YOUR MEMBERSHIP if you want to see any current reports.
AFTER MARKET UPDATE - WEDNESDAY, NOVEMBER 28TH, 2018
Previous After Market Report Next After Market Report >>>
|
|
|
|
DOW |
+617.70 |
25,366.43 |
+2.50% |
|
Volume |
929,049,640 |
+16% |
|
Volume |
2,375,678,060 |
+15% |
|
NASDAQ |
+208.89 |
7,291.59 |
+2.95% |
|
Advancers |
2,407 |
80% |
|
Advancers |
2,419 |
78% |
|
S&P 500 |
+61.61 |
2,743.78 |
+2.30% |
|
Decliners |
591 |
20% |
|
Decliners |
675 |
22% |
|
Russell 2000 |
+37.53 |
1,530.38 |
+2.51% |
|
52 Wk Highs |
41 |
|
|
52 Wk Highs |
37 |
|
|
S&P 600 |
+22.66 |
961.11 |
+2.41% |
|
52 Wk Lows |
205 |
|
|
52 Wk Lows |
154 |
|
|
 |
Leadership Improved as Major Indices Posted Solid Day 3 Gains
Kenneth J. Gruneisen - Passed the CAN SLIM® Master's Exam
Stocks surged on Wednesday. The Dow climbed 617 points to 25,366, while the S&P 500 gained 61 points to 2,743. The Nasdaq Composite jumped 208 points to 7,291. The volume totals session were higher than the prior session totals on the NYSE and on the Nasdaq exchange. Breadth was positive as advancers led decliners by a 4-1 margin on the NYSE and nearly 4-1 on the Nasdaq exchange. There were 23 high-ranked companies from the Leaders List that made new 52-week highs and were listed on the BreakOuts Page, versus 5 on the prior session. New 52-week lows totals again solidly outnumbered new 52-week highs totals on the NYSE and on the Nasdaq exchange. Technically, the major indices (M criteria) are still in a correction. Disciplined investors will remain patient and watch for a convincing follow-through day to confirm a new rally before any new buying efforts are justified under the fact-based investment system's rules. The Featured Stocks Page provides the most timely analysis on high-ranked leaders. Strict buying and selling rules should always be followed on a case by case basis. Charts used courtesy of www.stockcharts.com
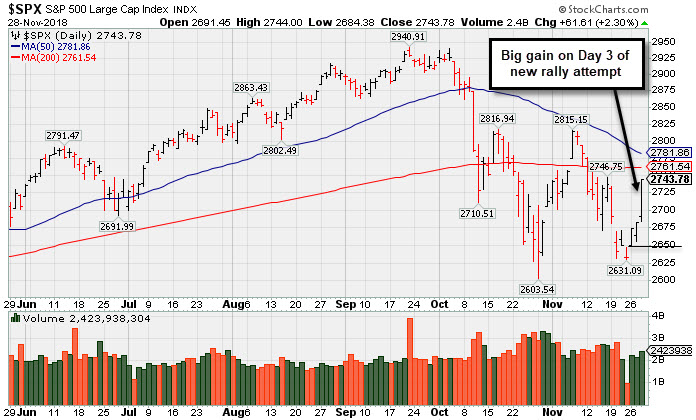
PICTURED: The S&P 500 Index posted a big gain on Wednesday marking Day 3 of the new rally attempt. Disciplined investors will watch on Day 4 to Day 7 of the rally attempt for a confirming follow-through day of subsequent big gains from at least one major average, with higher volume, and coupled with a leadership expansion. Recently it sputtered yet stayed above the October low. However, its 50-day moving average (DMA) line is about to converge with its 200 DMA line, an ominous bearish signal which has been termed a "death cross" by technical analysts.
The Dow had its best session in eight months while the dollar slumped following reassuring remarks from Federal Reserve Chairman Jerome Powell. The rally started near mid-session when Powell suggested interest rates are “just below” a level considered neutral, which was perceived as a dovish signal by investors. On the data front, an update on third-quarter GDP showed the U.S. economy expanded at an annualized pace of 3.5%, unchanged from the previous release. A separate report showed new home sales unexpectedly fell 8.9% in October to the lowest level since March 2016.
Ten of 11 S&P 500 sectors finished in positive territory with Utilities representing the only group in the red. The recently battered “FAANG” cohort paced the gains, adding more than $100 billion in market cap on the session. In earnings news, Salesforce.com (CRM +10.29%) rallied after topping analyst profit projections while Tiffany & Co. (TIF -11.86%) fell after missing revenue estimates.
Treasuries were mixed, with the yield curve steepening following Powell’s comments. The yield on the benchmark 10-year note finished unchanged at 3.06%. In commodities, WTI crude retreated 2.3% to $50.38/barrel after data showed U.S. crude inventories advanced for the 10th consecutive week. COMEX gold added 0.6% to $1,220.30/ounce amid a steep drop in the dollar. |
 Kenneth J. Gruneisen started out as a licensed stockbroker in August 1987, a couple of months prior to the historic stock market crash that took the Dow Jones Industrial Average down -22.6% in a single day. He has published daily fact-based fundamental and technical analysis on high-ranked stocks online for two decades. Through FACTBASEDINVESTING.COM, Kenneth provides educational articles, news, market commentary, and other information regarding proven investment systems that work in good times and bad.
Comments contained in the body of this report are technical opinions only and are not necessarily those of Gruneisen Growth Corp. The material herein has been obtained from sources believed to be reliable and accurate, however, its accuracy and completeness cannot be guaranteed. Our firm, employees, and customers may effect transactions, including transactions contrary to any recommendation herein, or have positions in the securities mentioned herein or options with respect thereto. Any recommendation contained in this report may not be suitable for all investors and it is not to be deemed an offer or solicitation on our part with respect to the purchase or sale of any securities. |
|
 |
Retail, Financial, Tech, and Commodity-Linked Groups Rose
Kenneth J. Gruneisen - Passed the CAN SLIM® Master's Exam
The Retail Index ($RLX +3.96%) was a standout gainer while the Broker/Dealer Index ($XBD +1.61%) and Bank Index ($BKX +1.46%) both posted solid gains. The Biotech Index ($BTK +3.52%), Networking Index ($NWX +2.54%), and the Semiconductor Index ($SOX +2.27%) posted unanimous gains. Commodity-linked groups also had a positive bias as the Gold & Silver Index ($XAU +3.10%) outpaced the Oil Services Index ($OSX +1.96%) and Integrated Oil Index ($XOI +1.73%).
Charts courtesy of www.stockcharts.com
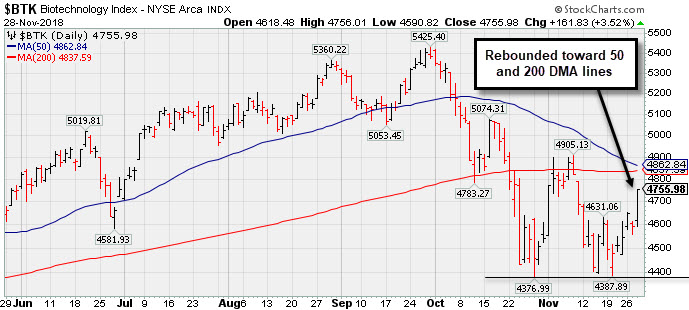 PICTURED: The Biotech Index ($BTK +3.52%) rebounded toward its 50-day and 200-day moving average (DMA) lines after finding support near its October low.
| Oil Services |
$OSX |
106.96 |
+2.06 |
+1.96% |
-28.48% |
| Integrated Oil |
$XOI |
1,300.97 |
+22.06 |
+1.73% |
-2.59% |
| Semiconductor |
$SOX |
1,231.45 |
+27.37 |
+2.27% |
-1.72% |
| Networking |
$NWX |
518.08 |
+12.85 |
+2.54% |
+5.62% |
| Broker/Dealer |
$XBD |
264.80 |
+4.19 |
+1.61% |
-0.17% |
| Retail |
$RLX |
2,116.98 |
+80.69 |
+3.96% |
+22.10% |
| Gold & Silver |
$XAU |
65.53 |
+1.98 |
+3.12% |
-23.15% |
| Bank |
$BKX |
101.39 |
+1.46 |
+1.46% |
-4.99% |
| Biotech |
$BTK |
4,755.98 |
+161.83 |
+3.52% |
+12.64% |
|
|
|
 |
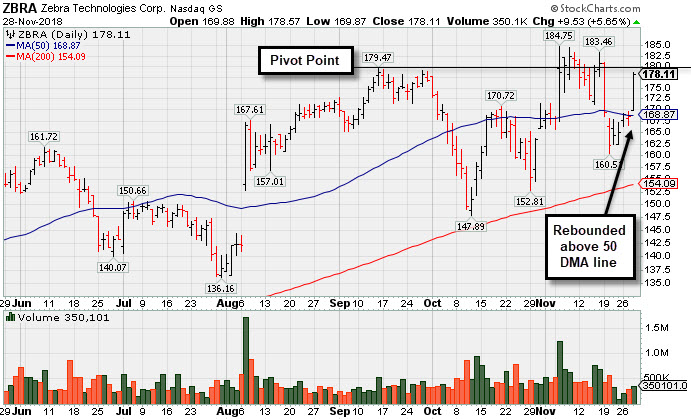
Challenging High After Rebound Above 50-day Average
Kenneth J. Gruneisen - Passed the CAN SLIM® Master's Exam
Zebra Tech Corp Cl A (ZBRA+$9.53 or +5.65% to $178.11) posed a big gain rebounding above its 50-day moving average (DMA) line ($169) toward the prior high. The prior lows and 200 DMA line ($154) define important near-term support to watch.
It reported Sep '18 earnings +54% on +17% sales revenues, continuing its strong earnings track record. Fundamentals remain strong. The past 3 quarters showed earnings increases above the +25% minimum guideline (C criteria). Recent sequential comparisons show encouraging sales revenues acceleration. Annual earnings (A criteria) history has been strong since a downturn in FY '08 and '09.
Confirming volume-driven gains for the stock were a reassuring sign after ZBRA was last shown in this FSU section on 11/06/18 with an annotated graph under the headline, "Hit New High Following Another Strong Earnings Increase". However, concerns also remain until a follow-through day confirms a new market rally (M criteria). It was highlighted in yellow with pivot point cited based on its 6/08/18 high plus 10 cents in the 8/07/18 mid-day report (read here). It faces very little resistance due to overhead supply. It found support in recent weeks after a pullback near its 200 DMA line.
The number of top-rated funds owning its shares from 553 in Sep '17 to 687 in Sep '18, a reassuring sign concerning the I criteria. Its current Up/Down Volume Ratio of 1.1 is an unbiased indication its shares have been under slight accumulation over the past 50 days. It has earned an A Timeliness Rating and a B Sponsorship Rating. There are 53.8 million shares outstanding (S criteria) which can contribute to greater price volatility in the event of institutional buying or selling. |
|
|
Color Codes Explained :
Y - Better candidates highlighted by our
staff of experts.
G - Previously featured
in past reports as yellow but may no longer be buyable under the
guidelines.
***Last / Change / Volume data in this table is the closing quote data***
Symbol/Exchange
Company Name
Industry Group |
PRICE |
CHANGE
(%Change) |
Day High |
Volume
(% DAV)
(% 50 day avg vol) |
52 Wk Hi
% From Hi |
Featured
Date |
Price
Featured |
Pivot Featured |
|
Max Buy |
MPX
-
NYSE
Marine Products Corp
AUTOMOTIVE - Recreational Vehicles
|
$21.83
|
+0.29
1.35% |
$21.96
|
20,479
45.51% of 50 DAV
50 DAV is 45,000
|
$24.82
-12.05%
|
10/24/2018
|
$23.00
|
PP = $24.92
|
|
MB = $26.17
|
Most Recent Note - 11/26/2018 1:09:42 PM
G - Sputtering above the recent low ($20.25 on 10/26/18) previously noted as important near-term support. A rebound above the 50 DMA line ($22.10) is needed for its outlook to improve. Subsequent gains above the pivot point backed by at least +40% above average volume may trigger a technical buy signal.
>>> FEATURED STOCK ARTICLE : Perched Within Striking Distance of Pivot Point - 11/13/2018 |
View all notes |
Set NEW NOTE alert |
Company Profile |
SEC
News |
Chart |
Request a new note
C
A
S
I |
GMED
-
NYSE
Globus Medical Inc Cl A
CHEMICALS - Specialty Chemicals
|
$48.65
|
-2.08
-4.10% |
$51.14
|
985,188
129.63% of 50 DAV
50 DAV is 760,000
|
$57.83
-15.87%
|
9/26/2018
|
$56.11
|
PP = $57.65
|
|
MB = $60.53
|
 Most Recent Note - 11/28/2018 5:21:20 PM
Fell further below its 50 and 200 DMA lines with today's big loss on higher volume violating the recent low ($49.03 on 11/20/18) and raising more serious concerns. It will be dropped from the Featured Stocks list tonight. A rebound above the 50 DMA line is needed for its outlook to improve.
>>> FEATURED STOCK ARTICLE : Quietly Sputtering Below Important Moving Averages - 11/27/2018 |
View all notes |
Set NEW NOTE alert |
Company Profile |
SEC
News |
Chart |
Request a new note
C
A
S
I |
ZBRA
-
NASDAQ
Zebra Tech Corp Cl A
COMPUTER HARDWARE - Computer Peripherals
|
$178.11
|
+9.53
5.65% |
$178.57
|
350,101
75.94% of 50 DAV
50 DAV is 461,000
|
$184.75
-3.59%
|
11/6/2018
|
$170.41
|
PP = $179.57
|
|
MB = $188.55
|
Most Recent Note - 11/28/2018 5:12:57 PM
Y - Color code is changed to yellow after rebounding above its 50 DMA line ($169). The prior lows and 200 DMA line ($154) define important near-term support to watch. See the latest FSU analysis for more details and a new annotated graph.
>>> FEATURED STOCK ARTICLE : Challenging High After Rebound Above 50-day Average - 11/28/2018 |
View all notes |
Set NEW NOTE alert |
Company Profile |
SEC
News |
Chart |
Request a new note
C
A
S
I |
CME
-
NASDAQ
C M E Group Inc
DIVERSIFIED SERVICES - Business/Management Services
|
$187.11
|
-7.04
-3.63% |
$192.93
|
2,952,260
149.71% of 50 DAV
50 DAV is 1,972,000
|
$197.08
-5.06%
|
10/4/2018
|
$179.29
|
PP = $177.45
|
|
MB = $186.32
|
Most Recent Note - 11/28/2018 5:17:11 PM
G - Encountering distributional pressure while pulling back from its all-time high. Its 50 DMA line ($182.12) defines near-term support. Strength continued after reporting earnings +22% on +2% sales revenues for the Sep '18 quarter, below the +25% minimum earnings guideline (C criteria), raising fundamental concerns.
>>> FEATURED STOCK ARTICLE : Extended From Base After More Gain With Above Average Volume - 11/15/2018 |
View all notes |
Set NEW NOTE alert |
Company Profile |
SEC
News |
Chart |
Request a new note
C
A
S
I |
GDOT
-
NYSE
Green Dot Corp Cl A
FINANCIAL SERVICES - Credit Services
|
$82.88
|
+3.79
4.79% |
$83.32
|
530,889
115.91% of 50 DAV
50 DAV is 458,000
|
$93.00
-10.88%
|
11/8/2018
|
$90.35
|
PP = $91.61
|
|
MB = $96.19
|
Most Recent Note - 11/28/2018 5:23:50 PM
G - Posted a gain above its 50 DMA line ($80.63) today with higher volume but it has not formed a sound base. Its 200 DMA line and prior low ($71.50 on 10/29/18) define important near-term support.
>>> FEATURED STOCK ARTICLE : Volume Heavy Behind Rally to New High - 11/8/2018 |
View all notes |
Set NEW NOTE alert |
Company Profile |
SEC
News |
Chart |
Request a new note
C
A
S
I |
Symbol/Exchange
Company Name
Industry Group |
PRICE |
CHANGE
(%Change) |
Day High |
Volume
(% DAV)
(% 50 day avg vol) |
52 Wk Hi
% From Hi |
Featured
Date |
Price
Featured |
Pivot Featured |
|
Max Buy |
ULTA
-
NASDAQ
Ulta Beauty Inc
SPECIALTY RETAIL - Specialty Retail, Other
|
$295.14
|
-1.69
-0.57% |
$302.29
|
1,563,130
167.18% of 50 DAV
50 DAV is 935,000
|
$322.49
-8.48%
|
11/8/2018
|
$296.36
|
PP = $290.40
|
|
MB = $304.92
|
Most Recent Note - 11/27/2018 1:29:55 PM
Y - Color code is changed to yellow while pulling back below its "max buy" level, enduring mild distributional pressure. Prior high ($290) defines initial support to watch above its 50 DMA line ($285).
>>> FEATURED STOCK ARTICLE : Volume Driven Gains Indicate Institutional Buying Demand - 11/9/2018 |
View all notes |
Set NEW NOTE alert |
Company Profile |
SEC
News |
Chart |
Request a new note
C
A
S
I |
UBNT
-
NASDAQ
Ubiquiti Networks Inc
TELECOMMUNICATIONS - Diversified Communication Serv
|
$110.36
|
+1.53
1.41% |
$110.63
|
304,426
61.88% of 50 DAV
50 DAV is 492,000
|
$112.45
-1.86%
|
11/9/2018
|
$108.20
|
PP = $101.43
|
|
MB = $106.50
|
Most Recent Note - 11/27/2018 6:34:57 PM
G - Volume totals have been cooling while still stubbornly holding its ground near its all-time high. Prior high ($101.33 on 9/25/18) defines initial support to watch on pullbacks.
>>> FEATURED STOCK ARTICLE : Pullback Following Breakout Gain on After Latest Earnings Report - 11/12/2018 |
View all notes |
Set NEW NOTE alert |
Company Profile |
SEC
News |
Chart |
Request a new note
C
A
S
I |
HQY
-
NASDAQ
Healthequity Inc
COMPUTER SOFTWARE and SERVICES - Healthcare Information Service
|
$85.10
|
+4.59
5.70% |
$85.36
|
688,845
101.30% of 50 DAV
50 DAV is 680,000
|
$101.58
-16.22%
|
11/2/2018
|
$95.56
|
PP = $100.09
|
|
MB = $105.09
|
Most Recent Note - 11/28/2018 5:15:34 PM
G - Tallied a big gain today with higher (near average) volume. Found support near its 200 DMA line after a damaging loss violated the prior low ($80.56 on 10/24/18). A rebound above the 50 DMA line ($88.25) is needed for its outlook to improve. See the latest FSU analysis for more details and an annotated graph.
>>> FEATURED STOCK ARTICLE : Found Support at 200-Day Average But Faces Overhead Supply - 11/26/2018 |
View all notes |
Set NEW NOTE alert |
Company Profile |
SEC
News |
Chart |
Request a new note
C
A
S
I |
OLLI
-
NASDAQ
Ollie's Bargain Outlet
Retail-DiscountandVariety
|
$90.38
|
+3.61
4.16% |
$90.73
|
734,023
113.28% of 50 DAV
50 DAV is 648,000
|
$97.61
-7.41%
|
11/16/2018
|
$90.70
|
PP = $97.71
|
|
MB = $102.60
|
Most Recent Note - 11/28/2018 5:25:53 PM
G - Posted a big gain today with near average volume as it rebounded near its 50 DMA line ($90.31) helping its outlook to improve. Faces near term resistance due to overhead supply up to the $97 level.
>>> FEATURED STOCK ARTICLE : Consolidating Near 50-Day Average Forming New Base - 11/16/2018 |
View all notes |
Set NEW NOTE alert |
Company Profile |
SEC
News |
Chart |
Request a new note
C
A
S
I |
PLNT
-
NYSE
Planet Fitness Inc Cl A
Leisure-Services
|
$56.75
|
+2.61
4.82% |
$57.31
|
1,423,135
107.00% of 50 DAV
50 DAV is 1,330,000
|
$57.66
-1.58%
|
11/7/2018
|
$57.10
|
PP = $55.45
|
|
MB = $58.22
|
Most Recent Note - 11/28/2018 5:27:20 PM
Y - Posted a big gain today with near average volume for a best ever close. Its 50 DMA line and recent low ($48.02 on 11/20/18) define important near-term support to watch on pullbacks.
>>> FEATURED STOCK ARTICLE : Big Gain for New High With Nearly 4 Times Average Volume - 11/7/2018 |
View all notes |
Set NEW NOTE alert |
Company Profile |
SEC
News |
Chart |
Request a new note
C
A
S
I |
Symbol/Exchange
Company Name
Industry Group |
PRICE |
CHANGE
(%Change) |
Day High |
Volume
(% DAV)
(% 50 day avg vol) |
52 Wk Hi
% From Hi |
Featured
Date |
Price
Featured |
Pivot Featured |
|
Max Buy |
INVA
-
NASDAQ
Innoviva Inc
Medical-Biomed/Biotech
|
$17.96
|
+0.38
2.16% |
$17.98
|
941,403
84.96% of 50 DAV
50 DAV is 1,108,000
|
$18.36
-2.20%
|
11/23/2018
|
$17.74
|
PP = $18.09
|
|
MB = $18.99
|
Most Recent Note - 11/27/2018 1:07:40 PM
Y - There was a "negative reversal" on the prior session after hitting a new high, action indicative of distributional pressure. Highlighted in yellow with pivot point cited based on its 4/12/18 high plus 10 cents in the 11/23/18 mid-day report (read here) and repeatedly noted - "A gain and strong close above the pivot point backed by at least +40% above average volume may clinch a technical buy signal. However, new buying efforts in all stocks are discouraged under the fact-based investment system until a new confirmed market rally (M criteria) is noted. Earnings increases in quarterly comparisons through Sep '18 have been above the +25% minimum guideline (C criteria). Annual earnings (A criteria) growth has been good after turning a profitable FY '15. See the latest FSU analysis for more details and an annotated graph."
>>> FEATURED STOCK ARTICLE : Bullish Action in Biotech Firm With Strong Earnings History - 11/23/2018 |
View all notes |
Set NEW NOTE alert |
Company Profile |
SEC
News |
Chart |
Request a new note
C
A
S
I |
|
|
|
THESE ARE NOT BUY RECOMMENDATIONS!
Comments contained in the body of this report are technical
opinions only. The material herein has been obtained
from sources believed to be reliable and accurate, however,
its accuracy and completeness cannot be guaranteed.
This site is not an investment advisor, hence it does
not endorse or recommend any securities or other investments.
Any recommendation contained in this report may not
be suitable for all investors and it is not to be deemed
an offer or solicitation on our part with respect to
the purchase or sale of any securities. All trademarks,
service marks and trade names appearing in this report
are the property of their respective owners, and are
likewise used for identification purposes only.
This report is a service available
only to active Paid Premium Members.
You may opt-out of receiving report notifications
at any time. Questions or comments may be submitted
by writing to Premium Membership Services 665 S.E. 10 Street, Suite 201 Deerfield Beach, FL 33441-5634 or by calling 1-800-965-8307
or 954-785-1121.
|
|
|