You are not logged in.
This means you
CAN ONLY VIEW reports that were published prior to Monday, April 28, 2025.
You
MUST UPGRADE YOUR MEMBERSHIP if you want to see any current reports.
AFTER MARKET UPDATE - THURSDAY, NOVEMBER 29TH, 2018
Previous After Market Report Next After Market Report >>>
|
|
|
|
DOW |
-27.59 |
25,338.84 |
-0.11% |
|
Volume |
800,135,000 |
-14% |
|
Volume |
1,984,006,370 |
-16% |
|
NASDAQ |
-18.51 |
7,273.08 |
-0.25% |
|
Advancers |
1,375 |
47% |
|
Advancers |
1,420 |
47% |
|
S&P 500 |
-6.03 |
2,737.76 |
-0.22% |
|
Decliners |
1,536 |
53% |
|
Decliners |
1,623 |
53% |
|
Russell 2000 |
-5.00 |
1,525.39 |
-0.33% |
|
52 Wk Highs |
38 |
|
|
52 Wk Highs |
37 |
|
|
S&P 600 |
-4.48 |
956.63 |
-0.47% |
|
52 Wk Lows |
168 |
|
|
52 Wk Lows |
94 |
|
|
 |
Indices Pulled Back With Lighter Volume on the Exchanges
Kenneth J. Gruneisen - Passed the CAN SLIM® Master's Exam
Stocks finished lower Thursday. The Dow lost 27 points to 25,338, ending its three-day winning streak. The S&P 500 slipped 5 points to 2,737 while the Nasdaq Composite declined 18 points to 7,273. The volume totals session were lighter than the prior session totals on the NYSE and on the Nasdaq exchange. Breadth had a slightly negative bias as decliners led advancers by an 8-7 margin on the NYSE and on the Nasdaq exchange. There were 28 high-ranked companies from the Leaders List that made new 52-week highs and were listed on the BreakOuts Page, versus 23 on the prior session. New 52-week lows totals again solidly outnumbered new 52-week highs totals on the NYSE and on the Nasdaq exchange. Technically, the major indices (M criteria) are still in a correction. Disciplined investors will remain patient and watch for a convincing follow-through day to confirm a new rally before any new buying efforts are justified under the fact-based investment system's rules. The Featured Stocks Page provides the most timely analysis on high-ranked leaders. Strict buying and selling rules should always be followed on a case by case basis. Charts used courtesy of www.stockcharts.com
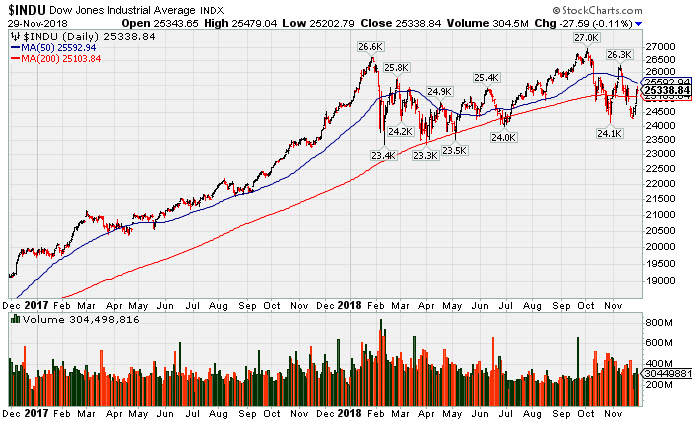
PICTURED: The Dow Jones Industrial Average pulled back on Thursday marking Day 4 of the new rally attempt. Disciplined investors will watch on Day 4 to Day 7 of the rally attempt for a confirming follow-through day of subsequent big gains from at least one major average, with higher volume, and coupled with a leadership expansion. Recently it sputtered yet stayed above the October low. However, its 50-day moving average (DMA) line is about to converge with its 200 DMA line, an ominous bearish signal which has been termed a "death cross" by technical analysts.
The major averages recovered from early session lows and finished little changed as investors await further trade updates. A report from the Wall Street Journal revealed the U.S. and China have agreed to suspend additional tariffs as both sides work to secure a new trade pact. On the data front, Core Personal Consumption Expenditure Price Index (the Fed’s preferred gauge of inflation) climbed 1.8% year-over-year in October, the slowest rate in eight months. Additional reports showed personal income and personal spending both advanced more than expected last month. An update on the housing market revealed pending home sales fell for the tenth consecutive month in October.
The Tech sector weighed on the major averages as Intel (INTC -2.4%) and IBM (IBM -1.2%). The Financials and Consumer Discretionary groups also underperformed. Healthcare stocks outperformed as shares of Pfizer (PFE +1.4%) rose. Meanwhile, Energy shares rebounded from recent weakness as NYMEX WTI crude added +2.3% to $51.44/barrel.
Treasuries were stronger as the yield on the 10-year note slipped four basis points to 3.02%, after dipping below 3% in overnight trading for the first time since September. In commodities, COMEX gold was essentially unchanged at $1223.80/ounce despite a weaker dollar. |
 Kenneth J. Gruneisen started out as a licensed stockbroker in August 1987, a couple of months prior to the historic stock market crash that took the Dow Jones Industrial Average down -22.6% in a single day. He has published daily fact-based fundamental and technical analysis on high-ranked stocks online for two decades. Through FACTBASEDINVESTING.COM, Kenneth provides educational articles, news, market commentary, and other information regarding proven investment systems that work in good times and bad.
Comments contained in the body of this report are technical opinions only and are not necessarily those of Gruneisen Growth Corp. The material herein has been obtained from sources believed to be reliable and accurate, however, its accuracy and completeness cannot be guaranteed. Our firm, employees, and customers may effect transactions, including transactions contrary to any recommendation herein, or have positions in the securities mentioned herein or options with respect thereto. Any recommendation contained in this report may not be suitable for all investors and it is not to be deemed an offer or solicitation on our part with respect to the purchase or sale of any securities. |
|
 |
Energy Linked Group Rose Amid Widespread Weakness
Kenneth J. Gruneisen - Passed the CAN SLIM® Master's Exam
The Broker/Dealer Index ($XBD -1.50%) and Bank Index ($BKX -0.85%) lost ground along with the Retail Index ($RLX -0.45%). The tech sector also had a negative bias as the Biotech Index ($BTK -0.66%), Networking Index ($NWX -0.76%), and the Semiconductor Index ($SOX -0.81%) posted unanimous losses. Commodity-linked groups were mixed as the Gold & Silver Index ($XAU -1.11%) fell while the Oil Services Index ($OSX +0.11%) and Integrated Oil Index ($XOI +0.51%) both edged higher.
Charts courtesy of www.stockcharts.com
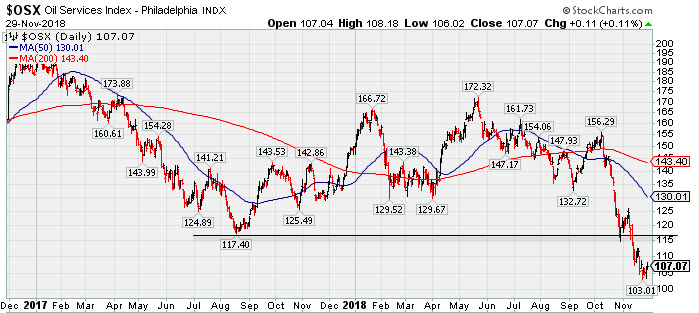 PICTURED: The Oil Services Index ($OSX +0.11%) is well below its 50-day and 200-day moving average (DMA) lines and recently slumped below its August 2017 low.
| Oil Services |
$OSX |
107.07 |
+0.11 |
+0.10% |
-28.41% |
| Integrated Oil |
$XOI |
1,307.65 |
+6.68 |
+0.51% |
-2.09% |
| Semiconductor |
$SOX |
1,221.43 |
-10.02 |
-0.81% |
-2.52% |
| Networking |
$NWX |
514.13 |
-3.95 |
-0.76% |
+4.81% |
| Broker/Dealer |
$XBD |
260.82 |
-3.98 |
-1.50% |
-1.67% |
| Retail |
$RLX |
2,107.42 |
-9.56 |
-0.45% |
+21.55% |
| Gold & Silver |
$XAU |
64.80 |
-0.73 |
-1.11% |
-24.01% |
| Bank |
$BKX |
100.52 |
-0.87 |
-0.86% |
-5.80% |
| Biotech |
$BTK |
4,724.61 |
-31.37 |
-0.66% |
+11.90% |
|
|
|
 |
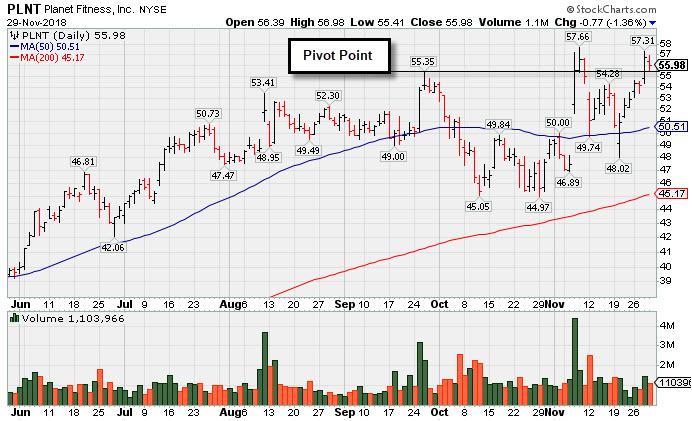
Fitness Firm Perched Near All-Time High
Kenneth J. Gruneisen - Passed the CAN SLIM® Master's Exam
Planet Fitness Inc Cl A (PLNT -$0.77 or -1.36% to $55.98) is perched near its all-time high. Its 50-day moving average (DMA) line and recent low ($48.02 on 11/20/18) define important near-term support to watch on pullbacks. It was highlighted in yellow with pivot point cited based on its 9/26/18 high plus 10 cents in the 11/07/18 mid-day report (read here). Big Gain for New High With Nearly 4 Times Average Volume - 11/7/2018
Bullish action came after it reported earnings +47% on +40% sales revenues for the Sep '18 quarter, marking a 3rd consecutive quarterly earnings comparison above the +25% minimum guideline (C criteria). Recent comparisons showed impressive sales revenues acceleration. Annual earnings (A criteria) history included a small downturn in FY '15 but has been strong since. Completed its Aug 2015 IPO at $14.06 and completed Secondary Offerings on 6/22/16, 9/26/16, 3/10/17 and 5/08/17.
The number of top-rated funds owning its shares rose from 373 in Dec '17 to 494 in Sep '18, a reassuring sign concerning the I criteria. The current Up/Down Volume Ratio of 1.4 is an unbiased indication its shares have been under accumulation over the past 50 days. It has earned a Timeliness Rating of A and Sponsorship Rating of B. Its small supply of 80.2 million shares in the public float can contribute to greater price volatility in the event of institutional buying or selling.
Charts courtesy of www.stockcharts.com
 |
|
|
Color Codes Explained :
Y - Better candidates highlighted by our
staff of experts.
G - Previously featured
in past reports as yellow but may no longer be buyable under the
guidelines.
***Last / Change / Volume data in this table is the closing quote data***
Symbol/Exchange
Company Name
Industry Group |
PRICE |
CHANGE
(%Change) |
Day High |
Volume
(% DAV)
(% 50 day avg vol) |
52 Wk Hi
% From Hi |
Featured
Date |
Price
Featured |
Pivot Featured |
|
Max Buy |
MPX
-
NYSE
Marine Products Corp
AUTOMOTIVE - Recreational Vehicles
|
$21.84
|
+0.01
0.05% |
$22.01
|
26,668
59.26% of 50 DAV
50 DAV is 45,000
|
$24.82
-12.01%
|
10/24/2018
|
$23.00
|
PP = $24.92
|
|
MB = $26.17
|
Most Recent Note - 11/26/2018 1:09:42 PM
G - Sputtering above the recent low ($20.25 on 10/26/18) previously noted as important near-term support. A rebound above the 50 DMA line ($22.10) is needed for its outlook to improve. Subsequent gains above the pivot point backed by at least +40% above average volume may trigger a technical buy signal.
>>> FEATURED STOCK ARTICLE : Perched Within Striking Distance of Pivot Point - 11/13/2018 |
View all notes |
Set NEW NOTE alert |
Company Profile |
SEC
News |
Chart |
Request a new note
C
A
S
I |
ZBRA
-
NASDAQ
Zebra Tech Corp Cl A
COMPUTER HARDWARE - Computer Peripherals
|
$177.92
|
-0.19
-0.11% |
$180.78
|
360,632
78.06% of 50 DAV
50 DAV is 462,000
|
$184.75
-3.70%
|
11/6/2018
|
$170.41
|
PP = $179.57
|
|
MB = $188.55
|
Most Recent Note - 11/28/2018 5:12:57 PM
Y - Color code is changed to yellow after rebounding above its 50 DMA line ($169). The prior lows and 200 DMA line ($154) define important near-term support to watch. See the latest FSU analysis for more details and a new annotated graph.
>>> FEATURED STOCK ARTICLE : Challenging High After Rebound Above 50-day Average - 11/28/2018 |
View all notes |
Set NEW NOTE alert |
Company Profile |
SEC
News |
Chart |
Request a new note
C
A
S
I |
CME
-
NASDAQ
C M E Group Inc
DIVERSIFIED SERVICES - Business/Management Services
|
$188.91
|
+1.80
0.96% |
$189.40
|
2,602,165
129.01% of 50 DAV
50 DAV is 2,017,000
|
$197.08
-4.15%
|
10/4/2018
|
$179.29
|
PP = $177.45
|
|
MB = $186.32
|
Most Recent Note - 11/28/2018 5:17:11 PM
G - Encountering distributional pressure while pulling back from its all-time high. Its 50 DMA line ($182.12) defines near-term support. Strength continued after reporting earnings +22% on +2% sales revenues for the Sep '18 quarter, below the +25% minimum earnings guideline (C criteria), raising fundamental concerns.
>>> FEATURED STOCK ARTICLE : Extended From Base After More Gain With Above Average Volume - 11/15/2018 |
View all notes |
Set NEW NOTE alert |
Company Profile |
SEC
News |
Chart |
Request a new note
C
A
S
I |
GDOT
-
NYSE
Green Dot Corp Cl A
FINANCIAL SERVICES - Credit Services
|
$81.14
|
-1.74
-2.10% |
$82.30
|
572,355
123.89% of 50 DAV
50 DAV is 462,000
|
$93.00
-12.75%
|
11/8/2018
|
$90.35
|
PP = $91.61
|
|
MB = $96.19
|
Most Recent Note - 11/28/2018 5:23:50 PM
G - Posted a gain above its 50 DMA line ($80.63) today with higher volume but it has not formed a sound base. Its 200 DMA line and prior low ($71.50 on 10/29/18) define important near-term support.
>>> FEATURED STOCK ARTICLE : Volume Heavy Behind Rally to New High - 11/8/2018 |
View all notes |
Set NEW NOTE alert |
Company Profile |
SEC
News |
Chart |
Request a new note
C
A
S
I |
ULTA
-
NASDAQ
Ulta Beauty Inc
SPECIALTY RETAIL - Specialty Retail, Other
|
$300.37
|
+5.23
1.77% |
$302.71
|
1,096,085
115.38% of 50 DAV
50 DAV is 950,000
|
$322.49
-6.86%
|
11/8/2018
|
$296.36
|
PP = $290.40
|
|
MB = $304.92
|
Most Recent Note - 11/27/2018 1:29:55 PM
Y - Color code is changed to yellow while pulling back below its "max buy" level, enduring mild distributional pressure. Prior high ($290) defines initial support to watch above its 50 DMA line ($285).
>>> FEATURED STOCK ARTICLE : Volume Driven Gains Indicate Institutional Buying Demand - 11/9/2018 |
View all notes |
Set NEW NOTE alert |
Company Profile |
SEC
News |
Chart |
Request a new note
C
A
S
I |
Symbol/Exchange
Company Name
Industry Group |
PRICE |
CHANGE
(%Change) |
Day High |
Volume
(% DAV)
(% 50 day avg vol) |
52 Wk Hi
% From Hi |
Featured
Date |
Price
Featured |
Pivot Featured |
|
Max Buy |
UBNT
-
NASDAQ
Ubiquiti Networks Inc
TELECOMMUNICATIONS - Diversified Communication Serv
|
$110.56
|
+0.20
0.18% |
$111.35
|
267,950
54.80% of 50 DAV
50 DAV is 489,000
|
$112.45
-1.68%
|
11/9/2018
|
$108.20
|
PP = $101.43
|
|
MB = $106.50
|
Most Recent Note - 11/27/2018 6:34:57 PM
G - Volume totals have been cooling while still stubbornly holding its ground near its all-time high. Prior high ($101.33 on 9/25/18) defines initial support to watch on pullbacks.
>>> FEATURED STOCK ARTICLE : Pullback Following Breakout Gain on After Latest Earnings Report - 11/12/2018 |
View all notes |
Set NEW NOTE alert |
Company Profile |
SEC
News |
Chart |
Request a new note
C
A
S
I |
HQY
-
NASDAQ
Healthequity Inc
COMPUTER SOFTWARE and SERVICES - Healthcare Information Service
|
$87.29
|
+2.19
2.57% |
$87.64
|
587,974
86.85% of 50 DAV
50 DAV is 677,000
|
$101.58
-14.07%
|
11/2/2018
|
$95.56
|
PP = $100.09
|
|
MB = $105.09
|
Most Recent Note - 11/28/2018 5:15:34 PM
G - Tallied a big gain today with higher (near average) volume. Found support near its 200 DMA line after a damaging loss violated the prior low ($80.56 on 10/24/18). A rebound above the 50 DMA line ($88.25) is needed for its outlook to improve. See the latest FSU analysis for more details and an annotated graph.
>>> FEATURED STOCK ARTICLE : Found Support at 200-Day Average But Faces Overhead Supply - 11/26/2018 |
View all notes |
Set NEW NOTE alert |
Company Profile |
SEC
News |
Chart |
Request a new note
C
A
S
I |
OLLI
-
NASDAQ
Ollie's Bargain Outlet
Retail-DiscountandVariety
|
$89.75
|
-0.63
-0.70% |
$91.38
|
795,972
122.27% of 50 DAV
50 DAV is 651,000
|
$97.61
-8.05%
|
11/16/2018
|
$90.70
|
PP = $97.71
|
|
MB = $102.60
|
Most Recent Note - 11/28/2018 5:25:53 PM
G - Posted a big gain today with near average volume as it rebounded near its 50 DMA line ($90.31) helping its outlook to improve. Faces near term resistance due to overhead supply up to the $97 level.
>>> FEATURED STOCK ARTICLE : Consolidating Near 50-Day Average Forming New Base - 11/16/2018 |
View all notes |
Set NEW NOTE alert |
Company Profile |
SEC
News |
Chart |
Request a new note
C
A
S
I |
PLNT
-
NYSE
Planet Fitness Inc Cl A
Leisure-Services
|
$55.98
|
-0.77
-1.36% |
$56.98
|
1,103,965
83.32% of 50 DAV
50 DAV is 1,325,000
|
$57.66
-2.91%
|
11/7/2018
|
$57.10
|
PP = $55.45
|
|
MB = $58.22
|
 Most Recent Note - 11/29/2018 6:12:37 PM
Y - Remains perched at its all-time high. Its 50 DMA line and recent low ($48.02 on 11/20/18) define important near-term support to watch on pullbacks. See the latest FSU analysis for more details and a new annotated graph,
>>> FEATURED STOCK ARTICLE : Fitness Firm Perched Near All-Time High - 11/29/2018 |
View all notes |
Set NEW NOTE alert |
Company Profile |
SEC
News |
Chart |
Request a new note
C
A
S
I |
INVA
-
NASDAQ
Innoviva Inc
Medical-Biomed/Biotech
|
$17.80
|
-0.16
-0.89% |
$18.07
|
1,042,865
93.20% of 50 DAV
50 DAV is 1,119,000
|
$18.36
-3.07%
|
11/23/2018
|
$17.74
|
PP = $18.09
|
|
MB = $18.99
|
Most Recent Note - 11/27/2018 1:07:40 PM
Y - There was a "negative reversal" on the prior session after hitting a new high, action indicative of distributional pressure. Highlighted in yellow with pivot point cited based on its 4/12/18 high plus 10 cents in the 11/23/18 mid-day report (read here) and repeatedly noted - "A gain and strong close above the pivot point backed by at least +40% above average volume may clinch a technical buy signal. However, new buying efforts in all stocks are discouraged under the fact-based investment system until a new confirmed market rally (M criteria) is noted. Earnings increases in quarterly comparisons through Sep '18 have been above the +25% minimum guideline (C criteria). Annual earnings (A criteria) growth has been good after turning a profitable FY '15. See the latest FSU analysis for more details and an annotated graph."
>>> FEATURED STOCK ARTICLE : Bullish Action in Biotech Firm With Strong Earnings History - 11/23/2018 |
View all notes |
Set NEW NOTE alert |
Company Profile |
SEC
News |
Chart |
Request a new note
C
A
S
I |
Symbol/Exchange
Company Name
Industry Group |
PRICE |
CHANGE
(%Change) |
Day High |
Volume
(% DAV)
(% 50 day avg vol) |
52 Wk Hi
% From Hi |
Featured
Date |
Price
Featured |
Pivot Featured |
|
Max Buy |
|
|
|
THESE ARE NOT BUY RECOMMENDATIONS!
Comments contained in the body of this report are technical
opinions only. The material herein has been obtained
from sources believed to be reliable and accurate, however,
its accuracy and completeness cannot be guaranteed.
This site is not an investment advisor, hence it does
not endorse or recommend any securities or other investments.
Any recommendation contained in this report may not
be suitable for all investors and it is not to be deemed
an offer or solicitation on our part with respect to
the purchase or sale of any securities. All trademarks,
service marks and trade names appearing in this report
are the property of their respective owners, and are
likewise used for identification purposes only.
This report is a service available
only to active Paid Premium Members.
You may opt-out of receiving report notifications
at any time. Questions or comments may be submitted
by writing to Premium Membership Services 665 S.E. 10 Street, Suite 201 Deerfield Beach, FL 33441-5634 or by calling 1-800-965-8307
or 954-785-1121.
|
|
|

