You are not logged in.
This means you
CAN ONLY VIEW reports that were published prior to Monday, April 28, 2025.
You
MUST UPGRADE YOUR MEMBERSHIP if you want to see any current reports.
AFTER MARKET UPDATE - TUESDAY, NOVEMBER 27TH, 2018
Previous After Market Report Next After Market Report >>>
|
|
|
|
DOW |
+108.49 |
24,748.73 |
+0.44% |
|
Volume |
800,448,630 |
-6% |
|
Volume |
2,064,681,330 |
+3% |
|
NASDAQ |
+0.85 |
7,082.70 |
+0.01% |
|
Advancers |
1,165 |
39% |
|
Advancers |
1,043 |
34% |
|
S&P 500 |
+8.72 |
2,682.17 |
+0.33% |
|
Decliners |
1,835 |
61% |
|
Decliners |
2,019 |
66% |
|
Russell 2000 |
-13.10 |
1,492.86 |
-0.87% |
|
52 Wk Highs |
20 |
|
|
52 Wk Highs |
14 |
|
|
S&P 600 |
-7.95 |
938.45 |
-0.84% |
|
52 Wk Lows |
233 |
|
|
52 Wk Lows |
180 |
|
|
 |
Nasdaq Death Cross and Breadth Negative as Indices Finish Higher
Kenneth J. Gruneisen - Passed the CAN SLIM® Master's Exam
Stocks advanced on Tuesday. The Dow added 108 points to 24,748, while the S&P 500 was up 8 points to 2,682. The Nasdaq Composite gained less than a point to close at 7,082. The volume totals session were mixed, lighter than the prior session total on the NYSE and higher on the Nasdaq exchange. Breadth was negative as decliners led advancers by a 3-2 margin on the NYSE and nearly 2-1 on the Nasdaq exchange. There were 5 high-ranked companies from the Leaders List that made new 52-week highs and were listed on the BreakOuts Page, versus 6 on the prior session. New 52-week lows totals expanded and solidly outnumbered new 52-week highs totals on the NYSE and on the Nasdaq exchange. Technically, the major indices (M criteria) are still in a correction. Disciplined investors will remain patient and watch for a convincing follow-through day to confirm a new rally before any new buying efforts are justified under the fact-based investment system's rules. The Featured Stocks Page provides the most timely analysis on high-ranked leaders. Strict buying and selling rules should always be followed on a case by case basis. Charts used courtesy of www.stockcharts.com
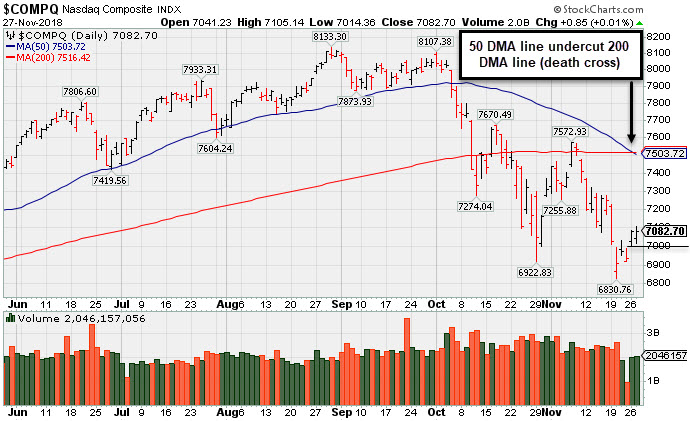
PICTURED: The Nasdaq Composite posted a second consecutive gain. Recently it undercut the October low. Its 50-day moving average (DMA) line has undercut its 200 DMA line, an ominous bearish signal which has been termed a "death cross" by technical analysts.
The major averages finished higher as investors digested a series of conflicting reports on the state of trade negotiations between the U.S. and China. On the data front, a report showed U.S. consumer confidence eased slightly from an 18-year high in September. Separately, a report showed U.S. home prices increased at the slowest pace in nearly two years in September.
Eight of 11 S&P 500 sectors finished in positive territory with Health Care and Consumer Staples shares outperforming. Microsoft (MSFT +0.63) became the most valuable publically traded company in the world, as the company’s market capitalization rose above that of Apple (AAPL -0.22%). Materials lagged as the Bloomberg Commodity Index fell to its lowest level since June 2017. COMEX gold declined 0.7% to $1,213.60, while copper and silver prices both dipped more than 1%. Industrials also lagged, with United Technologies (UTX -4.14%) down after announcing it will split into three independent companies.
Treasuries were essentially unchanged, with the yield on the benchmark 10-year note finishing at 3.06% after Fed Vice Chair Clarida emphasized the importance of the FOMC being “data dependent.” |
 Kenneth J. Gruneisen started out as a licensed stockbroker in August 1987, a couple of months prior to the historic stock market crash that took the Dow Jones Industrial Average down -22.6% in a single day. He has published daily fact-based fundamental and technical analysis on high-ranked stocks online for two decades. Through FACTBASEDINVESTING.COM, Kenneth provides educational articles, news, market commentary, and other information regarding proven investment systems that work in good times and bad.
Comments contained in the body of this report are technical opinions only and are not necessarily those of Gruneisen Growth Corp. The material herein has been obtained from sources believed to be reliable and accurate, however, its accuracy and completeness cannot be guaranteed. Our firm, employees, and customers may effect transactions, including transactions contrary to any recommendation herein, or have positions in the securities mentioned herein or options with respect thereto. Any recommendation contained in this report may not be suitable for all investors and it is not to be deemed an offer or solicitation on our part with respect to the purchase or sale of any securities. |
|
 |
Retail and Semiconductor Indexes Rose
Kenneth J. Gruneisen - Passed the CAN SLIM® Master's Exam
The Retail Index ($RLX +0.68%) posted a small gain while the Broker/Dealer Index ($XBD -0.18%) and Bank Index ($BKX -0.39%) both edged lower. The Biotech Index ($BTK -1.21%) and the Networking Index ($NWX -0.70%) each lost ground while the Semiconductor Index ($SOX +0.20%) posted a small gain. Commodity-linked groups had a negative bias as the Gold & Silver Index ($XAU -1.82%) outpaced the Oil Services Index ($OSX -0.64%) and Integrated Oil Index ($XOI -0.45%) to the downside.
Charts courtesy of www.stockcharts.com
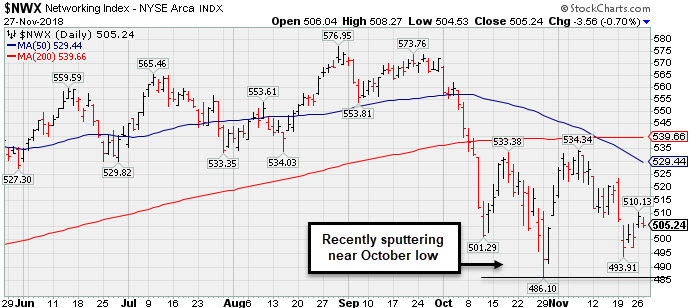 PICTURED: The Networking Index ($NWX -0.70%) is still sputtering below its 50-day and 200-day moving average (DMA) lines after slumping near its October low..
| Oil Services |
$OSX |
104.90 |
-0.67 |
-0.63% |
-29.86% |
| Integrated Oil |
$XOI |
1,278.90 |
-5.76 |
-0.45% |
-4.24% |
| Semiconductor |
$SOX |
1,204.08 |
+2.36 |
+0.20% |
-3.91% |
| Networking |
$NWX |
505.24 |
-3.56 |
-0.70% |
+3.00% |
| Broker/Dealer |
$XBD |
260.62 |
-0.48 |
-0.18% |
-1.74% |
| Retail |
$RLX |
2,036.29 |
+13.77 |
+0.68% |
+17.45% |
| Gold & Silver |
$XAU |
63.55 |
-1.18 |
-1.82% |
-25.47% |
| Bank |
$BKX |
99.93 |
-0.35 |
-0.35% |
-6.35% |
| Biotech |
$BTK |
4,594.15 |
-56.07 |
-1.21% |
+8.81% |
|
|
|
 |
Quietly Sputtering Below Important Moving Averages
Kenneth J. Gruneisen - Passed the CAN SLIM® Master's Exam
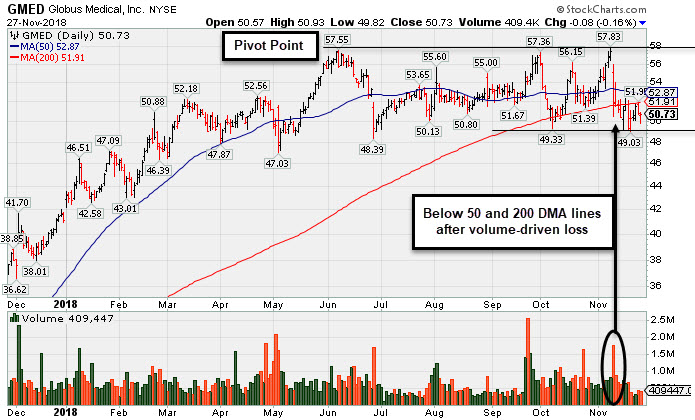
Globus Medical Inc Cl A (GMED -$0.08 or -0.16% to $50.73) has seen volume totals cooling while it has failed to rebound and it has met resistance at its 200-day moving average (DMA) line. It remains only -12.3% off its all-time high, but more damaging losses below the recent low ($49.03 on 11/20/18) would raise serious concerns. The longer it lingers below its 200 DMA line ($51.91) and its 50 DMA line ($52.87) the worse its outlook gets.
A rebound above those moving average lines and subsequent gains above the pivot point backed by more than +40% above average volume are needed to trigger a technical buy signal. Additionally, any new buying efforts are discouraged until a follow-through day confirms a new market rally (M criteria).
GMED was last shown in this FSU section on 11/05/18 with an annotated graph under the headline, "Consolidating -5.2% Off 52-Week High Ahead of Earnings News". Afterward it reported earnings +30% on +12% sales revenues for the Sep '18 quarter. its 3rd strong quarterly comparison above the +25% minimum guideline (C criteria). Annual earnings (A criteria) growth has been steady.
The Medical - Products firm has technology to treat patients with spine disorders. It was first highlighted in yellow with pivot point cited based on its 6/06/18 high plus 10 cents in the 9/26/18 mid-day report (read here).
It has 98.5 million shares outstanding (S criteria). The number of top rated funds owning its shares rose from 451 in Sep '17 to 526 in Sep '18, a reassuring sign concerning the I criteria. Its current Up/Down Volume Ratio of 0.9 is an unbiased indication its shares have been under slight distributional pressure over the past 50 days.
Charts courtesy of www.stockcharts.com
 |
|
|
Color Codes Explained :
Y - Better candidates highlighted by our
staff of experts.
G - Previously featured
in past reports as yellow but may no longer be buyable under the
guidelines.
***Last / Change / Volume data in this table is the closing quote data***
Symbol/Exchange
Company Name
Industry Group |
PRICE |
CHANGE
(%Change) |
Day High |
Volume
(% DAV)
(% 50 day avg vol) |
52 Wk Hi
% From Hi |
Featured
Date |
Price
Featured |
Pivot Featured |
|
Max Buy |
MPX
-
NYSE
Marine Products Corp
AUTOMOTIVE - Recreational Vehicles
|
$21.54
|
-0.13
-0.60% |
$21.75
|
33,046
73.44% of 50 DAV
50 DAV is 45,000
|
$24.82
-13.22%
|
10/24/2018
|
$23.00
|
PP = $24.92
|
|
MB = $26.17
|
Most Recent Note - 11/26/2018 1:09:42 PM
G - Sputtering above the recent low ($20.25 on 10/26/18) previously noted as important near-term support. A rebound above the 50 DMA line ($22.10) is needed for its outlook to improve. Subsequent gains above the pivot point backed by at least +40% above average volume may trigger a technical buy signal.
>>> FEATURED STOCK ARTICLE : Perched Within Striking Distance of Pivot Point - 11/13/2018 |
View all notes |
Set NEW NOTE alert |
Company Profile |
SEC
News |
Chart |
Request a new note
C
A
S
I |
GMED
-
NYSE
Globus Medical Inc Cl A
CHEMICALS - Specialty Chemicals
|
$50.73
|
-0.08
-0.16% |
$50.93
|
406,388
53.33% of 50 DAV
50 DAV is 762,000
|
$57.83
-12.28%
|
9/26/2018
|
$56.11
|
PP = $57.65
|
|
MB = $60.53
|
 Most Recent Note - 11/27/2018 6:24:05 PM
G - Volume totals have been cooling, but the longer it lingers below its 50 and 200 DMA lines the worse its outlook gets. Remains only -12.3% off its all-time high. More damaging losses below the recent low ($49.03 on 11/20/18) would raise serious concerns. See the latest FSU analysis for more details and a new annotated graph.
>>> FEATURED STOCK ARTICLE : Quietly Sputtering Below Important Moving Averages - 11/27/2018 |
View all notes |
Set NEW NOTE alert |
Company Profile |
SEC
News |
Chart |
Request a new note
C
A
S
I |
ZBRA
-
NASDAQ
Zebra Tech Corp Cl A
COMPUTER HARDWARE - Computer Peripherals
|
$168.58
|
-0.46
-0.27% |
$169.59
|
281,200
60.87% of 50 DAV
50 DAV is 462,000
|
$184.75
-8.75%
|
11/6/2018
|
$170.41
|
PP = $179.57
|
|
MB = $188.55
|
Most Recent Note - 11/26/2018 7:19:52 PM
G - Consolidating near its 50 DMA line ($169). The prior lows and 200 DMA line ($153) define important near-term support to watch.
>>> FEATURED STOCK ARTICLE : Hit New High Following Another Strong Earnings Increase - 11/6/2018 |
View all notes |
Set NEW NOTE alert |
Company Profile |
SEC
News |
Chart |
Request a new note
C
A
S
I |
CME
-
NASDAQ
C M E Group Inc
DIVERSIFIED SERVICES - Business/Management Services
|
$194.15
|
+2.63
1.37% |
$194.48
|
1,683,490
86.02% of 50 DAV
50 DAV is 1,957,000
|
$197.08
-1.49%
|
10/4/2018
|
$179.29
|
PP = $177.45
|
|
MB = $186.32
|
Most Recent Note - 11/27/2018 6:33:02 PM
G - Holding its ground stubbornly near its all-time high after an impressive spurt of volume-driven gains. Its 50 DMA line ($181.83) defines near-term support. Strength continued after reporting earnings +22% on +2% sales revenues for the Sep '18 quarter, below the +25% minimum earnings guideline (C criteria), raising fundamental concerns.
>>> FEATURED STOCK ARTICLE : Extended From Base After More Gain With Above Average Volume - 11/15/2018 |
View all notes |
Set NEW NOTE alert |
Company Profile |
SEC
News |
Chart |
Request a new note
C
A
S
I |
GDOT
-
NYSE
Green Dot Corp Cl A
FINANCIAL SERVICES - Credit Services
|
$79.09
|
-0.45
-0.57% |
$80.15
|
410,503
89.05% of 50 DAV
50 DAV is 461,000
|
$93.00
-14.96%
|
11/8/2018
|
$90.35
|
PP = $91.61
|
|
MB = $96.19
|
Most Recent Note - 11/26/2018 7:07:41 PM
G - Posted a gain with light volume. Its 200 DMA line ($74.82) and prior low ($71.50 on 10/29/18) define important near-term support.
>>> FEATURED STOCK ARTICLE : Volume Heavy Behind Rally to New High - 11/8/2018 |
View all notes |
Set NEW NOTE alert |
Company Profile |
SEC
News |
Chart |
Request a new note
C
A
S
I |
Symbol/Exchange
Company Name
Industry Group |
PRICE |
CHANGE
(%Change) |
Day High |
Volume
(% DAV)
(% 50 day avg vol) |
52 Wk Hi
% From Hi |
Featured
Date |
Price
Featured |
Pivot Featured |
|
Max Buy |
ULTA
-
NASDAQ
Ulta Beauty Inc
SPECIALTY RETAIL - Specialty Retail, Other
|
$296.83
|
-4.28
-1.42% |
$298.63
|
1,546,224
168.43% of 50 DAV
50 DAV is 918,000
|
$322.49
-7.96%
|
11/8/2018
|
$296.36
|
PP = $290.40
|
|
MB = $304.92
|
Most Recent Note - 11/27/2018 1:29:55 PM
Y - Color code is changed to yellow while pulling back below its "max buy" level, enduring mild distributional pressure. Prior high ($290) defines initial support to watch above its 50 DMA line ($285).
>>> FEATURED STOCK ARTICLE : Volume Driven Gains Indicate Institutional Buying Demand - 11/9/2018 |
View all notes |
Set NEW NOTE alert |
Company Profile |
SEC
News |
Chart |
Request a new note
C
A
S
I |
UBNT
-
NASDAQ
Ubiquiti Networks Inc
TELECOMMUNICATIONS - Diversified Communication Serv
|
$108.83
|
-1.39
-1.26% |
$110.40
|
201,076
40.30% of 50 DAV
50 DAV is 499,000
|
$112.45
-3.22%
|
11/9/2018
|
$108.20
|
PP = $101.43
|
|
MB = $106.50
|
Most Recent Note - 11/27/2018 6:34:57 PM
G - Volume totals have been cooling while still stubbornly holding its ground near its all-time high. Prior high ($101.33 on 9/25/18) defines initial support to watch on pullbacks.
>>> FEATURED STOCK ARTICLE : Pullback Following Breakout Gain on After Latest Earnings Report - 11/12/2018 |
View all notes |
Set NEW NOTE alert |
Company Profile |
SEC
News |
Chart |
Request a new note
C
A
S
I |
FIVE
-
NASDAQ
Five Below Inc
Retail-DiscountandVariety
|
$101.35
|
-3.15
-3.01% |
$104.22
|
877,428
98.92% of 50 DAV
50 DAV is 887,000
|
$136.13
-25.55%
|
7/6/2018
|
$98.90
|
PP = $104.09
|
|
MB = $109.29
|
Most Recent Note - 11/27/2018 6:27:32 PM
Still sputtering and failing to rebound after triggering a technical sell signal with a damaging gap down on 11/20/18. It will be dropped from the Featured Stocks list tonight. Its 200 DMA line ($95.48) defines the next important support. A rebound above the 50 DMA line ($118.23) is needed for its outlook to improve.
>>> FEATURED STOCK ARTICLE : Consolidating Near 50-Day Moving Average After Finding Support - 11/14/2018 |
View all notes |
Set NEW NOTE alert |
Company Profile |
SEC
News |
Chart |
Request a new note
C
A
S
I |
HQY
-
NASDAQ
Healthequity Inc
COMPUTER SOFTWARE and SERVICES - Healthcare Information Service
|
$80.51
|
-0.12
-0.15% |
$80.71
|
516,586
75.52% of 50 DAV
50 DAV is 684,000
|
$101.58
-20.74%
|
11/2/2018
|
$95.56
|
PP = $100.09
|
|
MB = $105.09
|
Most Recent Note - 11/26/2018 7:04:13 PM
G - Tallied another gain today with very light volume. Sputtering near its 200 DMA line after a damaging loss violated the prior low ($80.56 on 10/24/18) triggering a technical sell signal. A rebound above the 50 DMA line ($88.62) is needed for its outlook to improve. See the latest FSU analysis for more details and a new annotated graph.
>>> FEATURED STOCK ARTICLE : Found Support at 200-Day Average But Faces Overhead Supply - 11/26/2018 |
View all notes |
Set NEW NOTE alert |
Company Profile |
SEC
News |
Chart |
Request a new note
C
A
S
I |
OLLI
-
NASDAQ
Ollie's Bargain Outlet
Retail-DiscountandVariety
|
$86.77
|
-0.34
-0.39% |
$87.66
|
395,528
60.94% of 50 DAV
50 DAV is 649,000
|
$97.61
-11.11%
|
11/16/2018
|
$90.70
|
PP = $97.71
|
|
MB = $102.60
|
Most Recent Note - 11/26/2018 7:10:18 PM
G - Posted a gain today with below average volume. A rebound above the 50 DMA line ($90.43) is needed for its outlook to improve.
>>> FEATURED STOCK ARTICLE : Consolidating Near 50-Day Average Forming New Base - 11/16/2018 |
View all notes |
Set NEW NOTE alert |
Company Profile |
SEC
News |
Chart |
Request a new note
C
A
S
I |
Symbol/Exchange
Company Name
Industry Group |
PRICE |
CHANGE
(%Change) |
Day High |
Volume
(% DAV)
(% 50 day avg vol) |
52 Wk Hi
% From Hi |
Featured
Date |
Price
Featured |
Pivot Featured |
|
Max Buy |
PLNT
-
NYSE
Planet Fitness Inc Cl A
Leisure-Services
|
$54.14
|
-0.23
-0.42% |
$54.55
|
790,452
59.30% of 50 DAV
50 DAV is 1,333,000
|
$57.66
-6.10%
|
11/7/2018
|
$57.10
|
PP = $55.45
|
|
MB = $58.22
|
Most Recent Note - 11/26/2018 7:15:51 PM
Y - Posted another gain today with below average volume. Its 50 DMA line ($50.15) and recent low ($48.02 on 11/20/18) define important near-term support to watch on pullbacks. Following a recent breakout it slumped back into the prior base with a damaging loss on 11/12/18 raising concerns.
>>> FEATURED STOCK ARTICLE : Big Gain for New High With Nearly 4 Times Average Volume - 11/7/2018 |
View all notes |
Set NEW NOTE alert |
Company Profile |
SEC
News |
Chart |
Request a new note
C
A
S
I |
INVA
-
NASDAQ
Innoviva Inc
Medical-Biomed/Biotech
|
$17.58
|
+0.31
1.80% |
$17.70
|
1,606,934
147.56% of 50 DAV
50 DAV is 1,089,000
|
$18.36
-4.27%
|
11/23/2018
|
$17.74
|
PP = $18.09
|
|
MB = $18.99
|
Most Recent Note - 11/27/2018 1:07:40 PM
Y - There was a "negative reversal" on the prior session after hitting a new high, action indicative of distributional pressure. Highlighted in yellow with pivot point cited based on its 4/12/18 high plus 10 cents in the 11/23/18 mid-day report (read here) and repeatedly noted - "A gain and strong close above the pivot point backed by at least +40% above average volume may clinch a technical buy signal. However, new buying efforts in all stocks are discouraged under the fact-based investment system until a new confirmed market rally (M criteria) is noted. Earnings increases in quarterly comparisons through Sep '18 have been above the +25% minimum guideline (C criteria). Annual earnings (A criteria) growth has been good after turning a profitable FY '15. See the latest FSU analysis for more details and an annotated graph."
>>> FEATURED STOCK ARTICLE : Bullish Action in Biotech Firm With Strong Earnings History - 11/23/2018 |
View all notes |
Set NEW NOTE alert |
Company Profile |
SEC
News |
Chart |
Request a new note
C
A
S
I |
|
|
|
THESE ARE NOT BUY RECOMMENDATIONS!
Comments contained in the body of this report are technical
opinions only. The material herein has been obtained
from sources believed to be reliable and accurate, however,
its accuracy and completeness cannot be guaranteed.
This site is not an investment advisor, hence it does
not endorse or recommend any securities or other investments.
Any recommendation contained in this report may not
be suitable for all investors and it is not to be deemed
an offer or solicitation on our part with respect to
the purchase or sale of any securities. All trademarks,
service marks and trade names appearing in this report
are the property of their respective owners, and are
likewise used for identification purposes only.
This report is a service available
only to active Paid Premium Members.
You may opt-out of receiving report notifications
at any time. Questions or comments may be submitted
by writing to Premium Membership Services 665 S.E. 10 Street, Suite 201 Deerfield Beach, FL 33441-5634 or by calling 1-800-965-8307
or 954-785-1121.
|
|
|

