You are not logged in.
This means you
CAN ONLY VIEW reports that were published prior to Monday, February 26, 2024.
You
MUST UPGRADE YOUR MEMBERSHIP if you want to see any current reports.
AFTER MARKET UPDATE - TUESDAY, NOVEMBER 19TH, 2019
Previous After Market Report Next After Market Report >>>
|
|
|
|
DOW |
-102.20 |
27,934.02 |
-0.36% |
|
Volume |
842,354,140 |
+2% |
|
Volume |
2,059,031,609 |
+1% |
|
NASDAQ |
+20.72 |
8,570.66 |
+0.24% |
|
Advancers |
1,351 |
47% |
|
Advancers |
1,808 |
59% |
|
S&P 500 |
-1.85 |
3,120.18 |
-0.06% |
|
Decliners |
1,507 |
53% |
|
Decliners |
1,276 |
41% |
|
Russell 2000 |
+5.95 |
1,598.29 |
+0.37% |
|
52 Wk Highs |
122 |
|
|
52 Wk Highs |
160 |
|
|
S&P 600 |
+1.55 |
980.21 |
+0.16% |
|
52 Wk Lows |
97 |
|
|
52 Wk Lows |
117 |
|
|
 |
Major Indexes Ended Mixed With Nasdaq Leading its Peers
Kenneth J. Gruneisen - Passed the CAN SLIM® Master's Exam
The Dow declined 102 points, while the S&P 500 lost less than 0.1%. The Nasdaq Composite gained 0.2% to close at a record high. Decliners led advancers by a narrow margin on the NYSE while advancers led decliners by almost 3-2 on the Nasdaq exchange. Volume totals reported were higher than the prior session on both major exchanges. There were 62 high-ranked companies from the Leaders List that hit a new 52-week high and were listed on the BreakOuts Page, versus the total of 73 on the prior session. New 52-week highs totals solidly outnumbered new 52-week lows totals on the NYSE and on the Nasdaq exchange. The major indices (M criteria) are in a "confirmed uptrend" after enduring distributional pressure in recent weeks. The Featured Stocks Page provides the most timely analysis on high-ranked leaders. Charts used courtesy of www.stockcharts.com
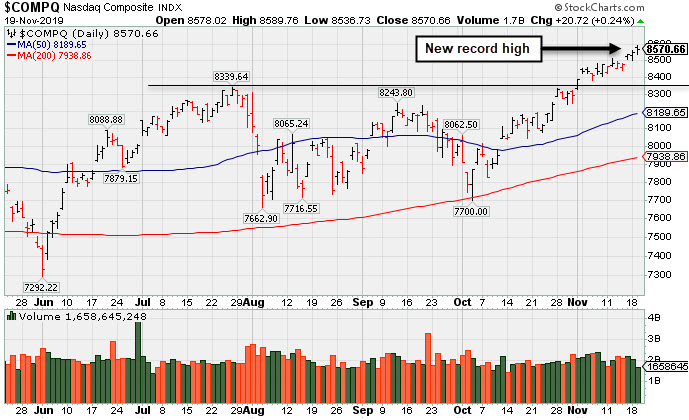
PICTURED: The S&P 500 Index hit another new record high.
Stocks finished mixed Tuesday as investors digested earnings reports and awaited further developments on the U.S.-China trade front. On the data front, housing starts rose 3.8% in October, while building permits jumped to a 12-year high in the same period. Treasuries strengthened, with the yield on the 10-year note down three basis points to 1.78%.
Seven of 11 S&P 500 sectors ended the session in negative territory. Energy stocks led decliners as WTI crude lost 3.2% amid oversupply fears. Meanwhile, disappointing earnings reports from retailers contributed to the Dow’s underperformance. Home Depot (HD -5.44%) fell after the home improvement giant cut its annual growth outlook for the second time this year, and posted sales short of analyst estimates. Shares of Kohl’s (KSS -19.49%) fell after the department store disappointed on both the top and bottom line, and missed same-store sales estimates. Software company ServiceNow (NOW +4.29%) rose after replacing Celgene (CELG -1.09%) in the S&P 500. Boeing (BA -0.67%) fell despite news the jet maker received orders for 50 of its embattled 737 MAX planes.
Market participants also kept tabs on trade news amid a statement from President Trump that he will impose higher tariffs if a deal is not reached. However, sentiment was buoyed after the White House issued another 90-day license extension to allow American companies to continue conducting business with Chinese Tech giant Huawei.
|
 Kenneth J. Gruneisen started out as a licensed stockbroker in August 1987, a couple of months prior to the historic stock market crash that took the Dow Jones Industrial Average down -22.6% in a single day. He has published daily fact-based fundamental and technical analysis on high-ranked stocks online for two decades. Through FACTBASEDINVESTING.COM, Kenneth provides educational articles, news, market commentary, and other information regarding proven investment systems that work in good times and bad.
Comments contained in the body of this report are technical opinions only and are not necessarily those of Gruneisen Growth Corp. The material herein has been obtained from sources believed to be reliable and accurate, however, its accuracy and completeness cannot be guaranteed. Our firm, employees, and customers may effect transactions, including transactions contrary to any recommendation herein, or have positions in the securities mentioned herein or options with respect thereto. Any recommendation contained in this report may not be suitable for all investors and it is not to be deemed an offer or solicitation on our part with respect to the purchase or sale of any securities. |
|
 |
Biotech, Broker/Dealer, and Gold & Silver Indexes Rose
Kenneth J. Gruneisen - Passed the CAN SLIM® Master's Exam
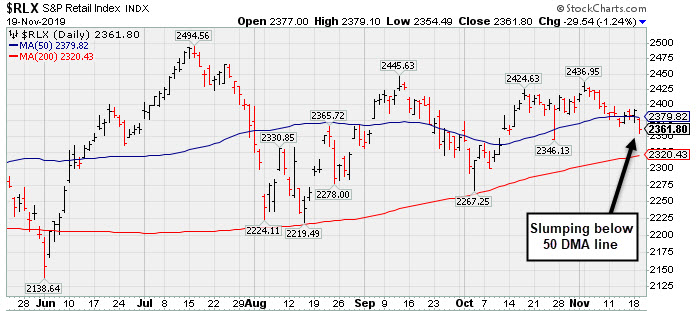
The Retail Index ($RLX -1.24%) lost ground while the Broker/Dealer Index ($XBD +0.82%) posted a gain and the Bank Index ($BKX +0.07%) finished flat. The tech sector was mixed as the Biotech Index ($BTK +1.45%) rose while the Semiconductor Index ($SOX -0.48%) and the Networking Index ($NWX -0.17%) both ended slightly lower. The Oil Services Index ($OSX -1.25%) and the Integrated Oil Index ($XOI -1.59%) both lost ground, meanwhile the Gold & Silver Index ($XAU +0.44%) posted a small gain.
PICTURED: The Retail Index ($RLX -1.24%) is slumping below its 50-day moving average (DMA) line.
| Oil Services |
$OSX |
65.23 |
-0.82 |
-1.24% |
-19.07% |
| Integrated Oil |
$XOI |
1,207.87 |
-19.49 |
-1.59% |
+4.21% |
| Semiconductor |
$SOX |
1,730.50 |
-8.28 |
-0.48% |
+49.80% |
| Networking |
$NWX |
583.34 |
-1.00 |
-0.17% |
+19.37% |
| Broker/Dealer |
$XBD |
278.74 |
+2.26 |
+0.82% |
+17.44% |
| Retail |
$RLX |
2,361.80 |
-29.54 |
-1.24% |
+21.03% |
| Gold & Silver |
$XAU |
95.34 |
+0.42 |
+0.44% |
+34.93% |
| Bank |
$BKX |
108.68 |
+0.08 |
+0.07% |
+26.68% |
| Biotech |
$BTK |
4,716.89 |
+67.53 |
+1.45% |
+11.75% |
|
|
|
 |
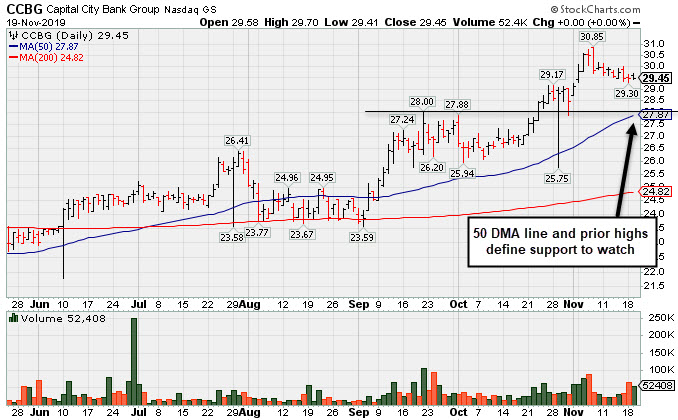
Consolidating After Volume-Driven Gains for New Highs
Kenneth J. Gruneisen - Passed the CAN SLIM® Master's Exam
Capital City Bk Gp (CCBG $29.45) is still hovering near its 52-week high. Its 50-day moving average (DMA) line ($27.87) defines important support to watch along with prior highs.
CCBG was highlighted in yellow with pivot point cited based on its 12/03/18 high plus 10 cents in the 9/13/19 mid-day report (read here). It rallied for new 52-week highs with 3 consecutive solid volume-driven gains after it was last shown in this FSU section on 10/31/19 with an annotated graph under the headline, "Noted 'Positive Reversal' on Volatile Session After Earnings".
Earnings increases in the 4 latest quarterly comparisons through Sep '19 were above the +25% minimum guideline (C criteria) as its sales revenues growth rate was in the 9-13% range versus the year ago periods. It has a Timeliness Rating of A, but a Sponsorship Rating of E.
Its small supply of only 16.7 million shares outstanding (S criteria) can contribute to greater price volatility in the event of institutional buying or selling. The number of top-rated funds owning its shares rose from 159 on Sep '18 to 185 in Sep '19, a reassuring sign concerning the I criteria. Its current Up/Down Volume Ratio of 1.4 is an unbiased indication its shares have been under accumulation over the past 50 days.
|
|
|
Color Codes Explained :
Y - Better candidates highlighted by our
staff of experts.
G - Previously featured
in past reports as yellow but may no longer be buyable under the
guidelines.
***Last / Change / Volume data in this table is the closing quote data***
Symbol/Exchange
Company Name
Industry Group |
PRICE |
CHANGE
(%Change) |
Day High |
Volume
(% DAV)
(% 50 day avg vol) |
52 Wk Hi
% From Hi |
Featured
Date |
Price
Featured |
Pivot Featured |
|
Max Buy |
 MLR
-
NYSE
MLR
-
NYSE
Miller Industries Inc
AUTOMOTIVE - Auto Parts
|
$35.94
|
-0.30
-0.83% |
$36.78
|
39,231
91.23% of 50 DAV
50 DAV is 43,000
|
$37.70
-4.67%
|
9/24/2019
|
$34.00
|
PP = $35.36
|
|
MB = $37.13
|
Most Recent Note - 11/15/2019 5:26:12 PM
Y - Showed resilience after recently reporting earnings which were below the fundamental guidelines of the fact-based investment system. Prior highs in the $35 area define initial support above its 50 DMA line ($33.85). See the latest FSU analysis for more details and a new annotated graph.
>>> FEATURED STOCK ARTICLE : Showing Resilience After Latest Quarter Missed Minimum Guidelines - 11/15/2019 |
View all notes |
Set NEW NOTE alert |
Company Profile |
SEC
News |
Chart |
Request a new note
C
A
S
I |
CCBG
-
NASDAQ
Capital City Bk Gp
BANKING - Regional - Mid-Atlantic Banks
|
$29.45
|
+0.00
0.00% |
$29.70
|
52,408
141.64% of 50 DAV
50 DAV is 37,000
|
$30.85
-4.54%
|
9/13/2019
|
$27.03
|
PP = $27.05
|
|
MB = $28.40
|
 Most Recent Note - 11/19/2019 6:31:49 PM
G - Consolidating after getting extended from the prior base. Prior highs define important support to watch along with its 50 DMA line ($27.87). See the latest FSU analysis for more details and a new annotated graph.
>>> FEATURED STOCK ARTICLE : Consolidating After Volume-Driven Gains for New Highs - 11/19/2019 |
View all notes |
Set NEW NOTE alert |
Company Profile |
SEC
News |
Chart |
Request a new note
C
A
S
I |
FTNT
-
NASDAQ
Fortinet Inc
Computer Sftwr-Security
|
$105.07
|
+1.23
1.18% |
$105.52
|
1,343,530
99.37% of 50 DAV
50 DAV is 1,352,000
|
$104.35
0.69%
|
11/11/2019
|
$97.14
|
PP = $97.06
|
|
MB = $101.91
|
Most Recent Note - 11/19/2019 6:37:34 PM
G - Color code is changed to green after a 4th consecutive gain, rallying further above its "max buy" level. Prior highs in the $97 area define initial support to watch on pullbacks.
>>> FEATURED STOCK ARTICLE : Reversed Into Red Today After Touching New High - 11/11/2019 |
View all notes |
Set NEW NOTE alert |
Company Profile |
SEC
News |
Chart |
Request a new note
C
A
S
I |
AUDC
-
NASDAQ
Audiocodes Ltd
ELECTRONICS - Scientific and Technical Instrum
|
$23.22
|
-0.79
-3.29% |
$24.22
|
438,392
152.75% of 50 DAV
50 DAV is 287,000
|
$24.35
-4.64%
|
9/13/2019
|
$19.68
|
PP = $19.84
|
|
MB = $20.83
|
Most Recent Note - 11/19/2019 1:51:05 PM
G - Retreating from its all-time high today following 3 consecutive gains marked by volume. Its 50 DMA line ($19.94) and recent low ($17.54 on 10/08/19) define important near-term support levels to watch. Bullish action came after it reported earnings +26% on +15% sales revenues for the Sep '19 quarter, continuing its strong earnings track record.
>>> FEATURED STOCK ARTICLE : Audiocodes is Quietly Perched Near its All-Time High - 11/7/2019 |
View all notes |
Set NEW NOTE alert |
Company Profile |
SEC
News |
Chart |
Request a new note
C
A
S
I |
CHDN
-
NASDAQ
Churchill Downs Inc
LEISURE - Gaming Activities
|
$127.68
|
-0.57
-0.44% |
$128.74
|
193,059
69.45% of 50 DAV
50 DAV is 278,000
|
$135.32
-5.65%
|
10/8/2019
|
$129.77
|
PP = $132.83
|
|
MB = $139.47
|
Most Recent Note - 11/18/2019 6:26:29 PM
G - Rebounded above its 50 DMA line ($126.87) with today's gain backed by lighter than average volume. Reported Sep '19 earnings +4% on +38% sales revenues versus the year ago period, its 2nd consecutive quarterly comparison below the +25% minimum earnings guideline (C criteria), raising greater fundamental concerns. See the latest FSU analysis for more details and a new annotated graph.
>>> FEATURED STOCK ARTICLE : Resilience Shown Despite Another Sub Par Earnings Report - 11/18/2019 |
View all notes |
Set NEW NOTE alert |
Company Profile |
SEC
News |
Chart |
Request a new note
C
A
S
I |
Symbol/Exchange
Company Name
Industry Group |
PRICE |
CHANGE
(%Change) |
Day High |
Volume
(% DAV)
(% 50 day avg vol) |
52 Wk Hi
% From Hi |
Featured
Date |
Price
Featured |
Pivot Featured |
|
Max Buy |
LULU
-
NASDAQ
Lululemon Athletica
MANUFACTURING - Textile Manufacturing
|
$216.88
|
-1.58
-0.72% |
$219.97
|
1,680,611
102.66% of 50 DAV
50 DAV is 1,637,000
|
$219.08
-1.00%
|
9/6/2019
|
$201.25
|
PP = $194.35
|
|
MB = $204.07
|
Most Recent Note - 11/18/2019 6:30:17 PM
G - Hit yet another new all-time high with today's 9th consecutive gain. Found prompt support again near its 50 DMA line ($199.87). The prior low ($191.21 on 11/05/19) defines the next important near-term support.
>>> FEATURED STOCK ARTICLE : Testing 50-Day Moving Average With Loss on Above Average Volume - 11/4/2019 |
View all notes |
Set NEW NOTE alert |
Company Profile |
SEC
News |
Chart |
Request a new note
C
A
S
I |
CPRT
-
NASDAQ
Copart Inc
SPECIALTY RETAIL - Auto Dealerships
|
$86.38
|
+0.38
0.44% |
$86.79
|
1,763,679
121.30% of 50 DAV
50 DAV is 1,454,000
|
$86.73
-0.40%
|
9/5/2019
|
$79.13
|
PP = $79.84
|
|
MB = $83.83
|
Most Recent Note - 11/18/2019 6:28:20 PM
G - Color code is changed to green after recently rising above its "max buy" level. The 50 DMA line ($82.05) defines near-term support above the prior low ($76.35 on 10/03/19).
>>> FEATURED STOCK ARTICLE : Testing Support at 50-Day Moving Average - 11/6/2019 |
View all notes |
Set NEW NOTE alert |
Company Profile |
SEC
News |
Chart |
Request a new note
C
A
S
I |
NMIH
-
NASDAQ
N M I Holdings Inc Cl A
Finance-MrtgandRel Svc
|
$33.44
|
-0.13
-0.39% |
$33.83
|
564,569
127.44% of 50 DAV
50 DAV is 443,000
|
$34.50
-3.07%
|
11/8/2019
|
$32.89
|
PP = $31.44
|
|
MB = $33.01
|
Most Recent Note - 11/19/2019 6:39:31 PM
G - Holding its ground after rising above its "max buy" level with gains backed by above average volume. Reported earnings +54% on +42% sales revenues for the Sep '19 quarter, and prior quarterly comparisons were also well above the +25% minimum guideline (C criteria). After years of losses it had profitable years for FY '16, '17, and '18.
>>> FEATURED STOCK ARTICLE : Hit New High With Volume-Driven Gains - 11/8/2019 |
View all notes |
Set NEW NOTE alert |
Company Profile |
SEC
News |
Chart |
Request a new note
C
A
S
I |
BLD
-
NYSE
Topbuild Corp
Bldg-Constr Prds/Misc
|
$109.94
|
+1.02
0.94% |
$110.63
|
289,512
101.94% of 50 DAV
50 DAV is 284,000
|
$111.48
-1.38%
|
5/17/2019
|
$82.19
|
PP = $87.31
|
|
MB = $91.68
|
Most Recent Note - 11/19/2019 6:29:24 PM
G - Extended from any sound base and consolidating after volume-driven gains for new all-time highs. Reported earnings +24% on +5% sales revenues for the Sep '19 quarter versus the year ago period, just below the +25% minimum guideline (C criteria). Found prompt support near its 50 DMA line ($99.84) during its ongoing ascent.
>>> FEATURED STOCK ARTICLE : Perched Near High Following Recent Volume-Driven Gains - 11/12/2019 |
View all notes |
Set NEW NOTE alert |
Company Profile |
SEC
News |
Chart |
Request a new note
C
A
S
I |
GLOB
-
NYSE
Globant SA
Computer-Tech Services
|
$95.93
|
+1.60
1.70% |
$96.70
|
398,181
163.19% of 50 DAV
50 DAV is 244,000
|
$112.33
-14.60%
|
11/14/2019
|
$106.87
|
PP = $112.43
|
|
MB = $118.05
|
Most Recent Note - 11/18/2019 6:33:45 PM
G - Color code is changed to green after abruptly retreating with 2 damaging volume-driven losses testing its 50 DMA line ($94.51). Reported earnings +35% on +27% sales revenues for the Sep '19 quarter.
>>> FEATURED STOCK ARTICLE : Rallying Near High With 12th Consecutive Gain - 11/14/2019 |
View all notes |
Set NEW NOTE alert |
Company Profile |
SEC
News |
Chart |
Request a new note
C
A
S
I |
Symbol/Exchange
Company Name
Industry Group |
PRICE |
CHANGE
(%Change) |
Day High |
Volume
(% DAV)
(% 50 day avg vol) |
52 Wk Hi
% From Hi |
Featured
Date |
Price
Featured |
Pivot Featured |
|
Max Buy |
|
|
|
THESE ARE NOT BUY RECOMMENDATIONS!
Comments contained in the body of this report are technical
opinions only. The material herein has been obtained
from sources believed to be reliable and accurate, however,
its accuracy and completeness cannot be guaranteed.
This site is not an investment advisor, hence it does
not endorse or recommend any securities or other investments.
Any recommendation contained in this report may not
be suitable for all investors and it is not to be deemed
an offer or solicitation on our part with respect to
the purchase or sale of any securities. All trademarks,
service marks and trade names appearing in this report
are the property of their respective owners, and are
likewise used for identification purposes only.
This report is a service available
only to active Paid Premium Members.
You may opt-out of receiving report notifications
at any time. Questions or comments may be submitted
by writing to Premium Membership Services 665 S.E. 10 Street, Suite 201 Deerfield Beach, FL 33441-5634 or by calling 1-800-965-8307
or 954-785-1121.
|
|
|