You are not logged in.
This means you
CAN ONLY VIEW reports that were published prior to Monday, April 28, 2025.
You
MUST UPGRADE YOUR MEMBERSHIP if you want to see any current reports.
AFTER MARKET UPDATE - WEDNESDAY, NOVEMBER 19TH, 2014
Previous After Market Report Next After Market Report >>>
|
|
|
|
DOW |
-2.09 |
17,685.73 |
-0.01% |
|
Volume |
719,062,000 |
+1% |
|
Volume |
1,515,008,300 |
-2% |
|
NASDAQ |
-26.73 |
4,675.71 |
-0.57% |
|
Advancers |
1,177 |
37% |
|
Advancers |
776 |
26% |
|
S&P 500 |
-3.08 |
2,048.72 |
-0.15% |
|
Decliners |
1,916 |
60% |
|
Decliners |
2,088 |
70% |
|
Russell 2000 |
-12.60 |
1,157.69 |
-1.08% |
|
52 Wk Highs |
84 |
|
|
52 Wk Highs |
52 |
|
|
S&P 600 |
-6.66 |
669.21 |
-0.99% |
|
52 Wk Lows |
58 |
|
|
52 Wk Lows |
71 |
|
|
 |
Breadth Negative as Leadership Contracted and Major Averages Fell
Kenneth J. Gruneisen - Passed the CAN SLIM® Master's Exam
Stocks pared losses to finish down modestly on Wednesday's session. The Dow retreated 2 points from its all-time high to close at 1,7685. The S&P 500 declined 3 points from its record level to 2,048. The NASDAQ Composite fell 27 points to 4,675. The volume totals were reported mixed, slightly higher than the prior session total on the NYSE and just lighter than the prior session on the Nasdaq exchange. Breadth was negative as decliners led advancers by a 3-2 margin on the NYSE and by nearly 3-1 on the Nasdaq exchange. There were 30 high-ranked companies from the CANSLIM.net Leaders List that made new 52-week highs and appeared on the CANSLIM.net BreakOuts Page, down from the prior session total of 64 stocks. New 52-week highs contracted yet still outnumbered new 52-week lows on the NYSE, but new lows outnumbered new highs on the Nasdaq exchange. There were gains for only 2 of the 12 high-ranked companies currently on the Featured Stocks Page. Disciplined investors know that new buying efforts may be made under the fact-based investment system only in stocks meeting all key criteria.
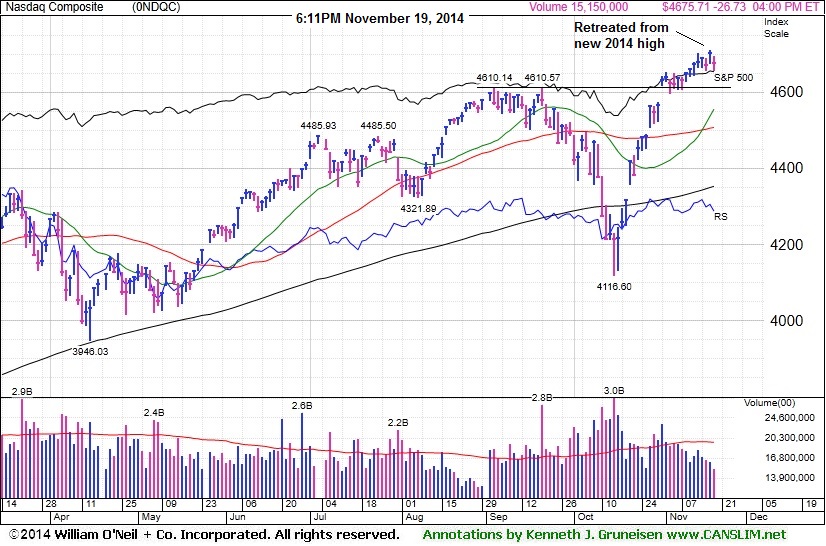
PICTURED: The tech-heavy Nasdaq Composite Index retreated from new 2014 highs.
The major averages edged lower as investors digested the minutes from the Fed's October meeting. In addition ending its monthly asset purchases, policy makers maintained their stance to keep interest rates low for a "considerable time." The latest updates on the housing market were mixed as new construction unexpectedly fell -2.8% in October while building permits rose +4.8%.
Seven of 10 sectors in the S&P 500 declined on the session. Telecom and tech were the worst performing groups as Verizon (VZ -1.4%) and Microsoft (MSFT -1.1%) fell. Energy was the best performing with Exxon (XOM +0.8%) helping to pace the sector's advance. Consumer discretionary was higher, helped by a round of positive earnings releases by retailers. Target (TGT +7.4%) and Staples (SPLS -9.1%) rallied after both posted quarterly results above projections. Lowe's (LOW +6.4%) rose after raising its full year guidance.
Treasuries declined with the 10-year note down 11/32 to yield 2.36%. In commodities, WTI crude slipped -0.3% to $74.42/barrel on the NYMEX after an unexpected increase in weekly inventories. COMEX gold futures dropped 1.3% to $1,181.60/ounce.
Large gains on 10/21/14 backed by higher volume totals while leadership (stocks hitting new 52-week highs) expanded met the definition of a "follow-through day" confirming a new uptrend for the market (M criteria). The S&P 500 Index, Nasdaq Composite Index, and the Dow Jones Industrial Average have collectively rebounded above their respective 50-day and 200-day moving average (DMA) lines, technically putting the market in a healthier stance.
The CANSLIM.net Featured Stocks Page shows the most action-worthy candidates and their latest notes and a Headline Link directs members to the latest detailed analysis with data-packed graphs annotated by a Certified expert along with links to additional resources. The Premium Member Homepage includes "dynamic archives" to all prior pay reports published.
|
 Kenneth J. Gruneisen started out as a licensed stockbroker in August 1987, a couple of months prior to the historic stock market crash that took the Dow Jones Industrial Average down -22.6% in a single day. He has published daily fact-based fundamental and technical analysis on high-ranked stocks online for two decades. Through FACTBASEDINVESTING.COM, Kenneth provides educational articles, news, market commentary, and other information regarding proven investment systems that work in good times and bad.
Comments contained in the body of this report are technical opinions only and are not necessarily those of Gruneisen Growth Corp. The material herein has been obtained from sources believed to be reliable and accurate, however, its accuracy and completeness cannot be guaranteed. Our firm, employees, and customers may effect transactions, including transactions contrary to any recommendation herein, or have positions in the securities mentioned herein or options with respect thereto. Any recommendation contained in this report may not be suitable for all investors and it is not to be deemed an offer or solicitation on our part with respect to the purchase or sale of any securities. |
|
 |
Retail Index Rose But Weakness Elsewhere Offset its Positive Influence
Kenneth J. Gruneisen - Passed the CAN SLIM® Master's Exam
The Gold & Silver Index ($XAU -5.18%) was down considerably, making it a standout decliner. The tech sector saw unanimous losses from the Networking Index ($NWX -0.75%), Semiconductor Index ($SOX -0.70%), and the Biotechnology Index ($BTK -0.24%). Financial shares had a slightly negative bias as the Broker/Dealer Index ($XBD -0.30%) and the Bank Index ($BKX -0.28%) edged lower. The Integrated Oil Index ($XOI +0.41%) posted a modest gain while the Oil Services Index ($OSX -0.04%) finished flat.
Charts courtesy www.stockcharts.com
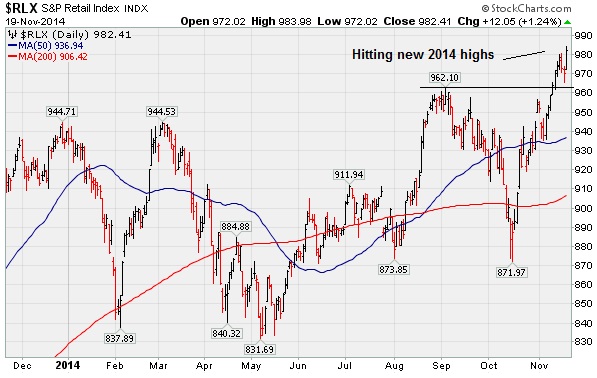
PICTURED: The Retail Index ($RLX +1.24%) rallied for a new 2014 high, however, losses elsewhere offset its positive influence on the major averages.
| Oil Services |
$OSX |
240.53 |
-0.09 |
-0.04% |
-14.41% |
| Integrated Oil |
$XOI |
1,441.07 |
+5.91 |
+0.41% |
-4.13% |
| Semiconductor |
$SOX |
650.18 |
-4.59 |
-0.70% |
+21.52% |
| Networking |
$NWX |
337.66 |
-2.56 |
-0.75% |
+4.23% |
| Broker/Dealer |
$XBD |
175.96 |
-0.53 |
-0.30% |
+9.59% |
| Retail |
$RLX |
982.41 |
+12.05 |
+1.24% |
+4.53% |
| Gold & Silver |
$XAU |
71.21 |
-3.89 |
-5.18% |
-15.38% |
| Bank |
$BKX |
72.52 |
-0.20 |
-0.28% |
+4.71% |
| Biotech |
$BTK |
3,314.83 |
-7.92 |
-0.24% |
+42.24% |
|
|
|
 |
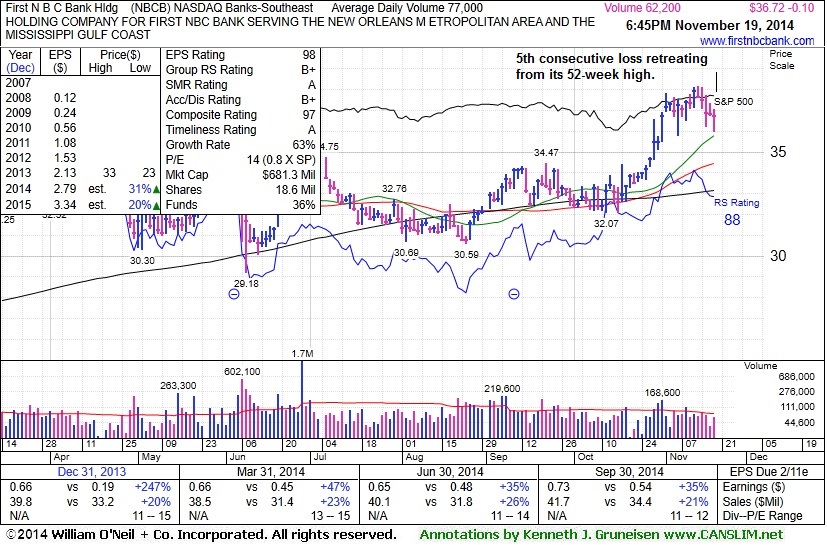
Fifth Consecutive Loss While Retreating From Highs
Kenneth J. Gruneisen - Passed the CAN SLIM® Master's Exam
First N B C Bank Hldg (NBCB -$0.10 or -0.27 to $36.72) was down today for a 5th consecutive session with lighter volume, slumping further below its "max buy" level. Prior highs near $34 define near-term support to watch on pullbacks. Disciplined investors avoid chasing stocks more than +5% above their prior highs and always limit losses by selling any stocks that fall more than -7% from their purchase price.
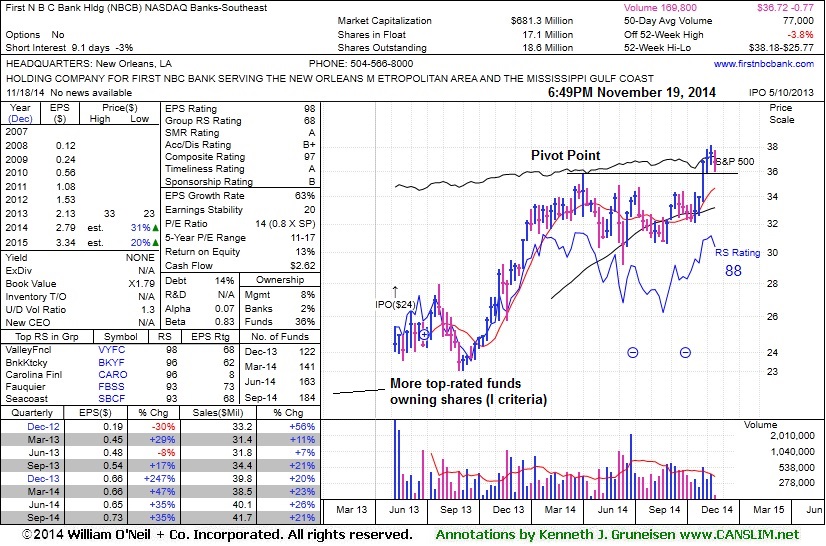
It was last shown in this FSU section on 11/03/14 mid-day report with annotated graphs under the headline, "Financial Firm at 52-Week High Tallied 8th Consecutive Gain". It finished strong after highlighted in yellow with pivot point (shown on the weekly graph below) based on its 4/02/14 high plus 10 cents in the 10/31/14 mid-day report (read here). The big gain above the pivot point backed by +79% above average volume clinched a technical buy signal. Its small supply of only 18.6 million shares (S criteria) outstanding can contribute to greater price volatility in the event of institutional buying or selling.
The high-ranked Bank holding company reported earnings +35% on +21% sales revenues for the Sep '14 quarter, its 4th consecutive quarterly comparison above the +25% minimum earnings guideline (C criteria). Annual earnings (A criteria) growth has also been strong. The current Up/Down Volume Ratio of 1.3 is an unbiased indication its shares have been under accumulation over the past 50 days. The number of top-rated funds owning its shares rose from 122 in Dec '13 to 184 in Sep '14, a reassuring sign concerning the I criteria.
|
|
|
Color Codes Explained :
Y - Better candidates highlighted by our
staff of experts.
G - Previously featured
in past reports as yellow but may no longer be buyable under the
guidelines.
***Last / Change / Volume data in this table is the closing quote data***
Symbol/Exchange
Company Name
Industry Group |
PRICE |
CHANGE
(%Change) |
Day High |
Volume
(% DAV)
(% 50 day avg vol) |
52 Wk Hi
% From Hi |
Featured
Date |
Price
Featured |
Pivot Featured |
|
Max Buy |
ACT
-
NYSE
Actavis plc
Medical-Generic Drugs
|
$269.49
|
+21.55
8.69% |
$269.60
|
12,684,668
468.76% of 50 DAV
50 DAV is 2,706,000
|
$255.51
5.47%
|
6/20/2014
|
$216.53
|
PP = $230.87
|
|
MB = $242.41
|
 Most Recent Note - 11/18/2014 12:05:49 PM
G - Hitting new 52-week highs with volume-driven gains after announcing plans to acquire Allergan (AGN) for $66 Billion. Did not form a sound new base and its color code is changed to green while getting extended from prior highs. Its 50 DMA line ($239) defines support where a violation would raise concerns.
>>> FEATURED STOCK ARTICLE : New Highs Following Deep "V" Shaped Pullback - Not a Sound Base - 11/6/2014
View all notes |
Set NEW NOTE alert |
CANSLIM.net Company Profile |
SEC
News |
Chart |
Request a new note
C
A N
S L
I M


|
AFSI
-
NASDAQ
Amtrust Financial Svcs
INSURANCE - Property and; Casualty Insurance
|
$52.57
|
-0.04
-0.08% |
$53.13
|
805,918
81.32% of 50 DAV
50 DAV is 991,000
|
$53.80
-2.29%
|
10/17/2014
|
$45.24
|
PP = $46.02
|
|
MB = $48.32
|
Most Recent Note - 11/14/2014 6:16:10 PM
G - Posted a 5th consecutive gain today on near average volume, finishing near its 52-week high. Recent lows near $42 and its 50 DMA line define important near-term support.
>>> FEATURED STOCK ARTICLE : 50-Day Average Acted as Support Following Analyst Downgrade - 11/5/2014
View all notes |
Set NEW NOTE alert |
CANSLIM.net Company Profile |
SEC
News |
Chart |
Request a new note
C
A N
S L
I M
|
ALXN
-
NASDAQ
Alexion Pharmaceuticals
DRUGS - Drug Manufacturers - Other
|
$192.21
|
+5.43
2.91% |
$193.04
|
711,529
58.56% of 50 DAV
50 DAV is 1,215,000
|
$197.64
-2.75%
|
10/23/2014
|
$184.01
|
PP = $185.53
|
|
MB = $194.81
|
Most Recent Note - 11/18/2014 5:37:15 PM
Y - Posted a gain today with below average volume. Still trading above its pivot point and below its "max buy" level. Prior highs in the $180 area define initial support to watch on pullbacks.
>>> FEATURED STOCK ARTICLE : New High Close With Gain on Light Volume - 11/10/2014
View all notes |
Set NEW NOTE alert |
CANSLIM.net Company Profile |
SEC
News |
Chart |
Request a new note
C
A N
S L
I M
|
BIDU
-
NASDAQ
Baidu Inc Ads
INTERNET - Internet Information Providers
|
$242.81
|
-1.34
-0.55% |
$245.65
|
2,700,205
69.63% of 50 DAV
50 DAV is 3,878,000
|
$251.99
-3.64%
|
10/30/2014
|
$234.08
|
PP = $231.51
|
|
MB = $243.09
|
Most Recent Note - 11/17/2014 5:17:44 PM
Y - Pulled back below its "max buy" level and its color code was changed to yellow. Prior highs near $230 define near-term support to watch on pullbacks. See the latest FSU analysis for more details and new annotated graphs.
>>> FEATURED STOCK ARTICLE : Consolidating Back Below "Max Buy" Level - 11/17/2014
View all notes |
Set NEW NOTE alert |
CANSLIM.net Company Profile |
SEC
News |
Chart |
Request a new note
C
A N
S L
I M
|
EPAM
-
NYSE
Epam Systems Inc
COMPUTER SOFTWARE and SERVICES - Information Technology Service
|
$49.12
|
-0.57
-1.15% |
$50.34
|
352,399
82.92% of 50 DAV
50 DAV is 425,000
|
$50.03
-1.82%
|
10/23/2014
|
$45.21
|
PP = $46.09
|
|
MB = $48.39
|
Most Recent Note - 11/13/2014 6:06:17 PM
G - Rallied with +24% above average volume today for a new high close. Color code is changed to green after rising above its "max buy" level. Prior highs in the $44 area defining initial support above its 50 DMA line ($43.12).
>>> FEATURED STOCK ARTICLE : Consolidating Above Prior Highs Following Technical Breakout - 11/11/2014
View all notes |
Set NEW NOTE alert |
CANSLIM.net Company Profile |
SEC
News |
Chart |
Request a new note
C
A N
S L
I M
|
Symbol/Exchange
Company Name
Industry Group |
PRICE |
CHANGE
(%Change) |
Day High |
Volume
(% DAV)
(% 50 day avg vol) |
52 Wk Hi
% From Hi |
Featured
Date |
Price
Featured |
Pivot Featured |
|
Max Buy |
FB
-
NASDAQ
Facebook Inc Cl A
INTERNET
|
$74.26
|
+0.02
0.02% |
$74.80
|
18,565,188
47.54% of 50 DAV
50 DAV is 39,052,000
|
$81.16
-8.51%
|
9/9/2014
|
$76.67
|
PP = $76.84
|
|
MB = $80.68
|
Most Recent Note - 11/14/2014 6:09:43 PM
G - Recent gains have lacked volume conviction and it encountered resistance at its 50 DMA line following a violation on 3 times average volume on 10/29/14 that raised concerns and triggered a technical sell signal. See the latest FSU analysis for more details and new annotated graphs.
>>> FEATURED STOCK ARTICLE : Following Violation 50-Day Average Acted as Resistance - 11/14/2014
View all notes |
Set NEW NOTE alert |
CANSLIM.net Company Profile |
SEC
News |
Chart |
Request a new note
C
A N
S L
I M
|
FLT
-
NYSE
Fleetcor Technologies
DIVERSIFIED SERVICES - Business/Management Services
|
$148.43
|
+0.68
0.46% |
$149.75
|
388,087
54.43% of 50 DAV
50 DAV is 713,000
|
$153.52
-3.32%
|
10/31/2014
|
$148.50
|
PP = $146.29
|
|
MB = $153.60
|
Most Recent Note - 11/18/2014 5:38:32 PM
Y - Still consolidating with volume totals cooling after highlighted in yellow in the 10/31/14 mid-day report (read here) clinching a convincing technical buy signal. It remains trading above its pivot point and below its "max buy" level. See the latest FSU analysis for more details and new annotated graphs.
>>> FEATURED STOCK ARTICLE : Consolidation Continues Above Prior Highs - 11/18/2014
View all notes |
Set NEW NOTE alert |
CANSLIM.net Company Profile |
SEC
News |
Chart |
Request a new note
C
A N
S L
I M
|
ILMN
-
NASDAQ
Illumina Inc
DRUGS - Biotechnology
|
$189.63
|
+6.72
3.67% |
$191.95
|
1,104,559
86.56% of 50 DAV
50 DAV is 1,276,000
|
$197.37
-3.92%
|
10/22/2014
|
$188.77
|
PP = $182.27
|
|
MB = $191.38
|
Most Recent Note - 11/18/2014 5:32:33 PM
Y - Rallied back near its "max buy" level with today's 2nd consecutive gain. Prior highs near $182 acted as support on the recent pullback. More damaging losses would raise concerns and trigger a technical sell signal.
>>> FEATURED STOCK ARTICLE : Consolidating Above Prior Highs Which Define Initial Support - 11/7/2014
View all notes |
Set NEW NOTE alert |
CANSLIM.net Company Profile |
SEC
News |
Chart |
Request a new note
C
A N
S L
I M
|
NBCB
-
NASDAQ
First N B C Bank Hldg
Banks-Southeast
|
$36.89
|
+0.01
0.03% |
$37.36
|
30,545
39.16% of 50 DAV
50 DAV is 78,000
|
$38.18
-3.38%
|
10/31/2014
|
$36.31
|
PP = $35.93
|
|
MB = $37.73
|
Most Recent Note - 11/18/2014 5:34:44 PM
Y - Fell today for a 4th consecutive session with lighter volume and its color code is changed to yellow after pulling back below its "max buy" level. Prior highs near $34 define near-term support to watch on pullbacks.
>>> FEATURED STOCK ARTICLE : Financial Firm at 52-Week High Tallied 8th Consecutive Gain - 11/3/2014
View all notes |
Set NEW NOTE alert |
CANSLIM.net Company Profile |
SEC
News |
Chart |
Request a new note
C
A N
S L
I M
|
PANW
-
NYSE
Palo Alto Networks
Computer Sftwr-Security
|
$108.99
|
-0.36
-0.33% |
$110.74
|
783,234
36.06% of 50 DAV
50 DAV is 2,172,100
|
$112.11
-2.78%
|
7/30/2014
|
$84.21
|
PP = $85.88
|
|
MB = $90.17
|
Most Recent Note - 11/18/2014 5:36:00 PM
G - Ended today with a 2nd small loss on light volume. Its 50 DMA line ($101.92) defines near-term support to watch. It has not formed a sound base.
>>> FEATURED STOCK ARTICLE : Finished Near Session Low With Small Gain on Light Volume - 11/13/2014
View all notes |
Set NEW NOTE alert |
CANSLIM.net Company Profile |
SEC
News |
Chart |
Request a new note
C
A N
S L
I M
|
Symbol/Exchange
Company Name
Industry Group |
PRICE |
CHANGE
(%Change) |
Day High |
Volume
(% DAV)
(% 50 day avg vol) |
52 Wk Hi
% From Hi |
Featured
Date |
Price
Featured |
Pivot Featured |
|
Max Buy |
SNCR
-
NASDAQ
Synchronoss Technologies
COMPUTER SOFTWARE andamp; SERVICES - Application Software
|
$47.59
|
+0.02
0.04% |
$48.28
|
657,168
114.29% of 50 DAV
50 DAV is 575,000
|
$54.05
-11.95%
|
10/27/2014
|
$46.40
|
PP = $47.81
|
|
MB = $50.20
|
Most Recent Note - 11/17/2014 5:48:09 PM
G - Down today for another loss on higher volume and above average volume, a sign of distributional pressure. Testing support at prior highs in the $47 area and its 50 DMA line ($46.36) on pullbacks.
>>> FEATURED STOCK ARTICLE : Loss on Heavy Volume a Sign of Distributional Pressure - 11/12/2014
View all notes |
Set NEW NOTE alert |
CANSLIM.net Company Profile |
SEC
News |
Chart |
Request a new note
C
A N
S L
I M
|
STRT
-
NASDAQ
Strattec Security Corp
AUTOMOTIVE - Auto Parts
|
$105.57
|
+1.15
1.10% |
$106.10
|
20,417
78.53% of 50 DAV
50 DAV is 26,000
|
$109.44
-3.54%
|
9/19/2014
|
$86.06
|
PP = $89.97
|
|
MB = $94.47
|
Most Recent Note - 11/13/2014 12:44:03 PM
G - Still stubbornly holding its ground near its 52-week high, possibly forming an advanced "3-weeks tight" base. Prior highs in the $88 area coincide with its 50 DMA line ($88.50) defining important near-term support to watch on pullbacks.
>>> FEATURED STOCK ARTICLE : Stock With Small Supply Quickly Got Extended From Prior Base - 11/4/2014
View all notes |
Set NEW NOTE alert |
CANSLIM.net Company Profile |
SEC
News |
Chart |
Request a new note
C
A N
S L
I M
|
|
|
|
THESE ARE NOT BUY RECOMMENDATIONS!
Comments contained in the body of this report are technical
opinions only. The material herein has been obtained
from sources believed to be reliable and accurate, however,
its accuracy and completeness cannot be guaranteed.
This site is not an investment advisor, hence it does
not endorse or recommend any securities or other investments.
Any recommendation contained in this report may not
be suitable for all investors and it is not to be deemed
an offer or solicitation on our part with respect to
the purchase or sale of any securities. All trademarks,
service marks and trade names appearing in this report
are the property of their respective owners, and are
likewise used for identification purposes only.
This report is a service available
only to active Paid Premium Members.
You may opt-out of receiving report notifications
at any time. Questions or comments may be submitted
by writing to Premium Membership Services 665 S.E. 10 Street, Suite 201 Deerfield Beach, FL 33441-5634 or by calling 1-800-965-8307
or 954-785-1121.
|
|
|

