You are not logged in.
This means you
CAN ONLY VIEW reports that were published prior to Tuesday, February 18, 2025.
You
MUST UPGRADE YOUR MEMBERSHIP if you want to see any current reports.
AFTER MARKET UPDATE - THURSDAY, NOVEMBER 20TH, 2014
Previous After Market Report Next After Market Report >>>
|
|
|
|
DOW |
+33.27 |
17,719.00 |
+0.19% |
|
Volume |
645,279,740 |
-10% |
|
Volume |
1,528,334,330 |
+1% |
|
NASDAQ |
+26.16 |
4,701.87 |
+0.56% |
|
Advancers |
2,024 |
63% |
|
Advancers |
1,878 |
65% |
|
S&P 500 |
+4.03 |
2,052.75 |
+0.20% |
|
Decliners |
1,043 |
33% |
|
Decliners |
906 |
31% |
|
Russell 2000 |
+13.07 |
1,170.75 |
+1.13% |
|
52 Wk Highs |
97 |
|
|
52 Wk Highs |
67 |
|
|
S&P 600 |
+7.70 |
676.91 |
+1.15% |
|
52 Wk Lows |
36 |
|
|
52 Wk Lows |
53 |
|
|
 |
Breadth Positive as Major Averages Hit New Record Highs
Kenneth J. Gruneisen - Passed the CAN SLIM® Master's Exam
The major averages rose on Thursday. The volume totals were reported mixed, lighter than the prior session total on the NYSE and just higher than the prior session on the Nasdaq exchange. Breadth was positive as advancers led decliners by almost a 2-1 margin on the NYSE and by more than 2-1 on the Nasdaq exchange. There were 44 high-ranked companies from the CANSLIM.net Leaders List that made new 52-week highs and appeared on the CANSLIM.net BreakOuts Page, up from the prior session total of 30 stocks. New 52-week highs contracted yet still outnumbered new 52-week lows on the NYSE, but new lows outnumbered new highs on the Nasdaq exchange. There were gains for 9 of the 12 high-ranked companies currently on the Featured Stocks Page. Disciplined investors know that new buying efforts may be made under the fact-based investment system only in stocks meeting all key criteria.
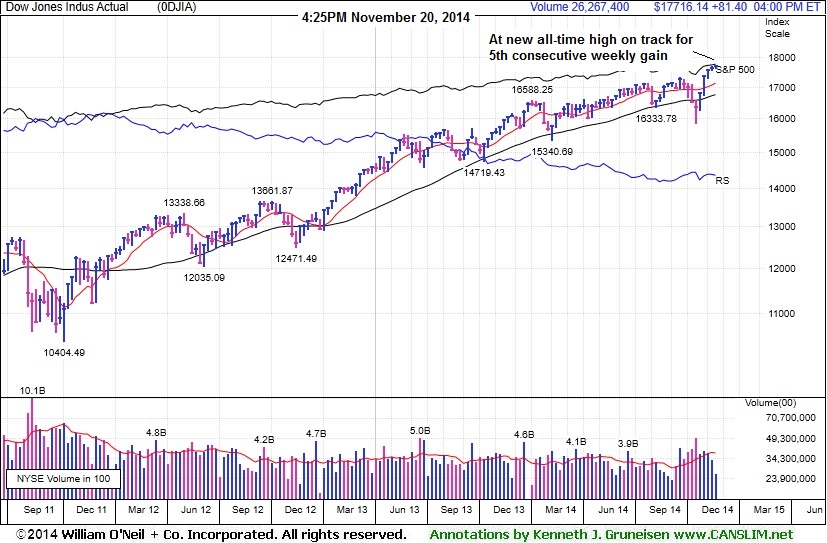
PICTURED: The Dow Jones Industrial Average increased 33 points to a record high of 17,719, on track for a 5th consecutive weekly gain.
On Thursday the S&P 500 Index also closed at a fresh all-time high as it rose 4 points to 2,052. The NASDAQ Composite gained 26 points to 4,701.
Economic data helped lift the market. Jobless claims fell last week to 291,000, which was the 10th straight week of filings below 300,000. Separate reports showed existing home sales unexpectedly rose to the highest level in more than a year in October and a gauge of inflation revealed consumer prices were unchanged last month. The encouraging U.S. economic reports overshadowed more signs of a slowdown overseas. A Chinese factory gauge fell to a six-month low in November and a measure of euro zone factories and services activity declined to the lowest level in 16 months.
Six of the 10 sectors in the S&P 500 rose. Energy and tech were the best performing groups. Anadarko Petroleum (APC +2.45%) rose as WTI crude gained +1.3% to $75.58 a barrel. Intel (INTC +4.66%) rose after delivering an upbeat revenue outlook for 2015 and the chipmaker boosted its annual dividend. Losses in consumer staples and health care limited the session's gains. Keurig Green Mountain (GMCR -7.44%) issued disappointing current quarter earnings guidance and its shares dropped. Gilead Sciences (GILD -1.71%) fell.
Treasuries advanced. The 10-year note gained 7/32 to yield 2.33%.
Large gains on 10/21/14 backed by higher volume totals while leadership (stocks hitting new 52-week highs) expanded met the definition of a "follow-through day" confirming a new uptrend for the market (M criteria). The S&P 500 Index, Nasdaq Composite Index, and the Dow Jones Industrial Average have collectively rebounded above their respective 50-day and 200-day moving average (DMA) lines, technically putting the market in a healthier stance.
The CANSLIM.net Featured Stocks Page shows the most action-worthy candidates and their latest notes and a Headline Link directs members to the latest detailed analysis with data-packed graphs annotated by a Certified expert along with links to additional resources. The Premium Member Homepage includes "dynamic archives" to all prior pay reports published.
|
 Kenneth J. Gruneisen started out as a licensed stockbroker in August 1987, a couple of months prior to the historic stock market crash that took the Dow Jones Industrial Average down -22.6% in a single day. He has published daily fact-based fundamental and technical analysis on high-ranked stocks online for two decades. Through FACTBASEDINVESTING.COM, Kenneth provides educational articles, news, market commentary, and other information regarding proven investment systems that work in good times and bad.
Comments contained in the body of this report are technical opinions only and are not necessarily those of Gruneisen Growth Corp. The material herein has been obtained from sources believed to be reliable and accurate, however, its accuracy and completeness cannot be guaranteed. Our firm, employees, and customers may effect transactions, including transactions contrary to any recommendation herein, or have positions in the securities mentioned herein or options with respect thereto. Any recommendation contained in this report may not be suitable for all investors and it is not to be deemed an offer or solicitation on our part with respect to the purchase or sale of any securities. |
|
 |
Commodity-Linked Groups Outpaced Tech and Retail Gains
Kenneth J. Gruneisen - Passed the CAN SLIM® Master's Exam
The Retail Index ($RLX +0.89%) was a positive influence on the major averages on Thursday and the Broker/Dealer Index ($XBD +0.12%) and Bank Index ($BKX +0.12%) both inched higher. The Networking Index ($NWX +1.62%) set the pace for the tech sector while the Semiconductor Index ($SOX +0.94%) and the Biotechnology Index ($BTK +0.23%) followed with smaller gains. Commodity-linked groups also had a positive bias as the Integrated Oil Index ($XOI +1.29%), Oil Services Index ($OSX +1.41%), and the Gold & Silver Index ($XAU +2.61%) posted solid gains.
Charts courtesy www.stockcharts.com
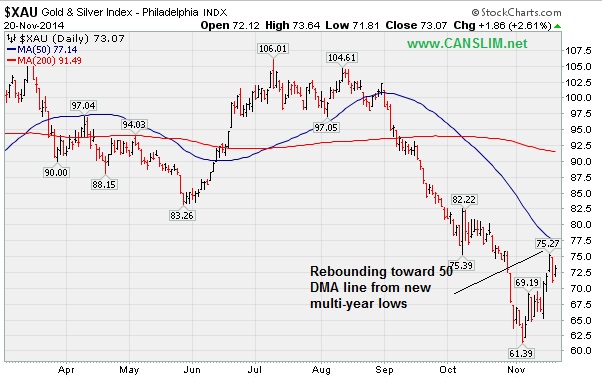
PICTURED: The Gold & Silver Index ($XAU +2.61%) is rebounding toward its 50-day moving average (DMA) line from multi-year lows.
| Oil Services |
$OSX |
243.93 |
+3.40 |
+1.41% |
-13.20% |
| Integrated Oil |
$XOI |
1,459.63 |
+18.56 |
+1.29% |
-2.89% |
| Semiconductor |
$SOX |
656.27 |
+6.09 |
+0.94% |
+22.66% |
| Networking |
$NWX |
343.11 |
+5.46 |
+1.62% |
+5.92% |
| Broker/Dealer |
$XBD |
176.16 |
+0.20 |
+0.12% |
+9.72% |
| Retail |
$RLX |
991.16 |
+8.75 |
+0.89% |
+5.46% |
| Gold & Silver |
$XAU |
73.07 |
+1.86 |
+2.61% |
-13.17% |
| Bank |
$BKX |
72.61 |
+0.09 |
+0.12% |
+4.84% |
| Biotech |
$BTK |
3,322.31 |
+7.48 |
+0.23% |
+42.56% |
|
|
|
 |
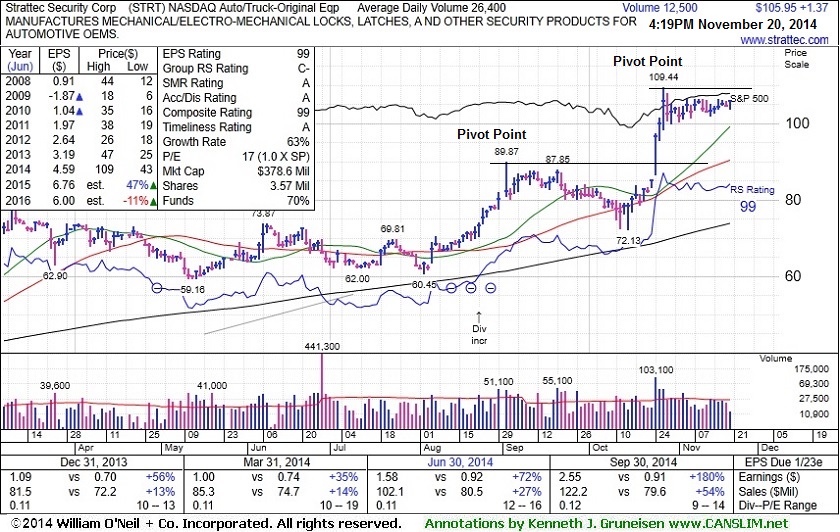
Formed New Advanced "3-Weeks Tight" Base
Kenneth J. Gruneisen - Passed the CAN SLIM® Master's Exam
Strattec Security Corp (STRT +$1.42 or +1.36% to $106.00) has been stubbornly holding its ground near its 52-week high. Its color code was changed to yellow after having formed an advanced "3-weeks tight" base and a new pivot point is cited based on its 10/28/14 high. The Auto/Truck - Original Equipment firm has no resistance remaining due to overhead supply. Subsequent volume-driven gains for new highs may trigger a new (or add-on) technical buy signal. Prior highs in the $89 area coincide with its 50 DMA line ($90) defining important near-term support to watch on pullbacks.
It was last shown in this FSU section on 11/04/14 with annotated graphs under the headline, "Stock With Small Supply Quickly Got Extended From Prior Base". It has traded up as much as +53.1% since first highlighted in yellow at $71.47 with pivot point based on its 6/06/14 high plus 10 cents in the 8/22/14 mid-day report (read here).
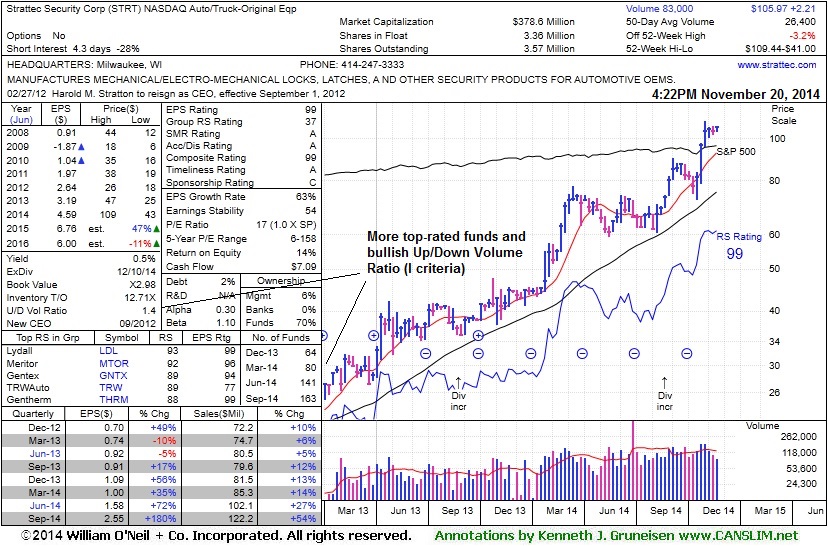
The thinly-traded stock has a small supply (S criteria) of only 3.36 million shares in the public float which can contribute to greater price volatility in the event of institutional buying or selling. Quarterly earnings increases through Sep '14 were above the +25% minimum guideline satisfy the C criteria and its annual earnings (A criteria) history has been strong. Increasing ownership by top-rated funds (I criteria) is a reassuring sign. The number of top-rated funds owning its shares rose from 59 in Sep '14 to 163 in Sep '14, a very reassuring sign concerning the I criteria. Its current Up/Down Volume Ratio of 1.4 is an unbiased indication its shares have been under accumulation over the past 50 days.
|
|
|
Color Codes Explained :
Y - Better candidates highlighted by our
staff of experts.
G - Previously featured
in past reports as yellow but may no longer be buyable under the
guidelines.
***Last / Change / Volume data in this table is the closing quote data***
Symbol/Exchange
Company Name
Industry Group |
PRICE |
CHANGE
(%Change) |
Day High |
Volume
(% DAV)
(% 50 day avg vol) |
52 Wk Hi
% From Hi |
Featured
Date |
Price
Featured |
Pivot Featured |
|
Max Buy |
ACT
-
NYSE
Actavis plc
Medical-Generic Drugs
|
$258.49
|
-7.55
-2.84% |
$267.20
|
5,875,054
194.35% of 50 DAV
50 DAV is 3,023,000
|
$270.34
-4.38%
|
6/20/2014
|
$216.53
|
PP = $230.87
|
|
MB = $242.41
|
 Most Recent Note - 11/20/2014 12:11:23 PM
G - Pulling back after spiking to new 52-week highs with volume-driven gains after announcing plans to acquire Allergan (AGN) for $66 Billion. Did not form a sound new base and its color code was changed to green while getting extended from prior highs. Its 50 DMA line ($240) defines support where a violation would raise concerns.
>>> FEATURED STOCK ARTICLE : New Highs Following Deep "V" Shaped Pullback - Not a Sound Base - 11/6/2014
View all notes |
Set NEW NOTE alert |
CANSLIM.net Company Profile |
SEC
News |
Chart |
Request a new note
C
A N
S L
I M


|
AFSI
-
NASDAQ
Amtrust Financial Svcs
INSURANCE - Property and; Casualty Insurance
|
$51.66
|
+0.36
0.70% |
$52.12
|
763,703
75.46% of 50 DAV
50 DAV is 1,012,000
|
$53.80
-3.98%
|
10/17/2014
|
$45.24
|
PP = $46.02
|
|
MB = $48.32
|
Most Recent Note - 11/20/2014 5:22:29 PM
G - Hovering near its 52-week high after a streak of gains. Recent lows near $42 and its 50 DMA line define important near-term support.
>>> FEATURED STOCK ARTICLE : 50-Day Average Acted as Support Following Analyst Downgrade - 11/5/2014
View all notes |
Set NEW NOTE alert |
CANSLIM.net Company Profile |
SEC
News |
Chart |
Request a new note
C
A N
S L
I M
|
ALXN
-
NASDAQ
Alexion Pharmaceuticals
DRUGS - Drug Manufacturers - Other
|
$192.55
|
+0.59
0.31% |
$193.23
|
553,538
45.97% of 50 DAV
50 DAV is 1,204,000
|
$197.64
-2.58%
|
10/23/2014
|
$184.01
|
PP = $185.53
|
|
MB = $194.81
|
Most Recent Note - 11/18/2014 5:37:15 PM
Y - Posted a gain today with below average volume. Still trading above its pivot point and below its "max buy" level. Prior highs in the $180 area define initial support to watch on pullbacks.
>>> FEATURED STOCK ARTICLE : New High Close With Gain on Light Volume - 11/10/2014
View all notes |
Set NEW NOTE alert |
CANSLIM.net Company Profile |
SEC
News |
Chart |
Request a new note
C
A N
S L
I M
|
BIDU
-
NASDAQ
Baidu Inc Ads
INTERNET - Internet Information Providers
|
$238.39
|
-2.03
-0.84% |
$241.51
|
2,138,116
54.84% of 50 DAV
50 DAV is 3,899,000
|
$251.99
-5.40%
|
10/30/2014
|
$234.08
|
PP = $231.51
|
|
MB = $243.09
|
Most Recent Note - 11/20/2014 5:24:16 PM
Y - Fell for a 4th consecutive loss today on light volume, consolidating below its "max buy" level . Prior highs near $230 define near-term support to watch on pullbacks.
>>> FEATURED STOCK ARTICLE : Consolidating Back Below "Max Buy" Level - 11/17/2014
View all notes |
Set NEW NOTE alert |
CANSLIM.net Company Profile |
SEC
News |
Chart |
Request a new note
C
A N
S L
I M
|
EPAM
-
NYSE
Epam Systems Inc
COMPUTER SOFTWARE and SERVICES - Information Technology Service
|
$48.50
|
+0.08
0.17% |
$48.74
|
208,235
47.87% of 50 DAV
50 DAV is 435,000
|
$50.34
-3.66%
|
10/23/2014
|
$45.21
|
PP = $46.09
|
|
MB = $48.39
|
Most Recent Note - 11/20/2014 5:19:55 PM
G - Still stubbornly holding its ground above its "max buy" level. Prior highs in the $44 area defining initial support above its 50 DMA line ($43.12).
>>> FEATURED STOCK ARTICLE : Consolidating Above Prior Highs Following Technical Breakout - 11/11/2014
View all notes |
Set NEW NOTE alert |
CANSLIM.net Company Profile |
SEC
News |
Chart |
Request a new note
C
A N
S L
I M
|
Symbol/Exchange
Company Name
Industry Group |
PRICE |
CHANGE
(%Change) |
Day High |
Volume
(% DAV)
(% 50 day avg vol) |
52 Wk Hi
% From Hi |
Featured
Date |
Price
Featured |
Pivot Featured |
|
Max Buy |
FB
-
NASDAQ
Facebook Inc Cl A
INTERNET
|
$73.60
|
+0.27
0.37% |
$73.99
|
19,127,992
49.30% of 50 DAV
50 DAV is 38,799,000
|
$81.16
-9.31%
|
9/9/2014
|
$76.67
|
PP = $76.84
|
|
MB = $80.68
|
Most Recent Note - 11/20/2014 5:21:28 PM
G - Volume totals have been cooling and recent gains have lacked volume conviction. Its outlook gets worse the longer it lingers below its 50 DMA line.
>>> FEATURED STOCK ARTICLE : Following Violation 50-Day Average Acted as Resistance - 11/14/2014
View all notes |
Set NEW NOTE alert |
CANSLIM.net Company Profile |
SEC
News |
Chart |
Request a new note
C
A N
S L
I M
|
FLT
-
NYSE
Fleetcor Technologies
DIVERSIFIED SERVICES - Business/Management Services
|
$155.08
|
+4.59
3.05% |
$157.91
|
1,756,499
248.44% of 50 DAV
50 DAV is 707,000
|
$153.52
1.02%
|
10/31/2014
|
$148.50
|
PP = $146.29
|
|
MB = $153.60
|
Most Recent Note - 11/20/2014 12:32:36 PM
G - Hitting new 52-week and all-time highs and rallying above its "max buy level" with today's gain backed by above average volume and its color code is changed to green.
>>> FEATURED STOCK ARTICLE : Consolidation Continues Above Prior Highs - 11/18/2014
View all notes |
Set NEW NOTE alert |
CANSLIM.net Company Profile |
SEC
News |
Chart |
Request a new note
C
A N
S L
I M
|
ILMN
-
NASDAQ
Illumina Inc
DRUGS - Biotechnology
|
$186.26
|
-3.77
-1.98% |
$189.36
|
900,073
70.87% of 50 DAV
50 DAV is 1,270,000
|
$197.37
-5.63%
|
10/22/2014
|
$188.77
|
PP = $182.27
|
|
MB = $191.38
|
Most Recent Note - 11/18/2014 5:32:33 PM
Y - Rallied back near its "max buy" level with today's 2nd consecutive gain. Prior highs near $182 acted as support on the recent pullback. More damaging losses would raise concerns and trigger a technical sell signal.
>>> FEATURED STOCK ARTICLE : Consolidating Above Prior Highs Which Define Initial Support - 11/7/2014
View all notes |
Set NEW NOTE alert |
CANSLIM.net Company Profile |
SEC
News |
Chart |
Request a new note
C
A N
S L
I M
|
NBCB
-
NASDAQ
First N B C Bank Hldg
Banks-Southeast
|
$37.02
|
+0.30
0.82% |
$37.25
|
96,057
126.39% of 50 DAV
50 DAV is 76,000
|
$38.18
-3.04%
|
10/31/2014
|
$36.31
|
PP = $35.93
|
|
MB = $37.73
|
Most Recent Note - 11/19/2014 7:03:26 PM
Y - Fell today for a 5th consecutive session with below volume and its color code was changed to yellow after pulling back below its "max buy" level. Prior highs near $34 define near-term support to watch on pullbacks. See the latest FSU analysis for the additional details and new annotated graphs.
>>> FEATURED STOCK ARTICLE : Fifth Consecutive Loss While Retreating From Highs - 11/19/2014
View all notes |
Set NEW NOTE alert |
CANSLIM.net Company Profile |
SEC
News |
Chart |
Request a new note
C
A N
S L
I M
|
PANW
-
NYSE
Palo Alto Networks
Computer Sftwr-Security
|
$109.04
|
+1.71
1.59% |
$109.27
|
1,551,101
77.97% of 50 DAV
50 DAV is 1,989,300
|
$112.11
-2.74%
|
7/30/2014
|
$84.21
|
PP = $85.88
|
|
MB = $90.17
|
Most Recent Note - 11/18/2014 5:36:00 PM
G - Ended today with a 2nd small loss on light volume. Its 50 DMA line ($101.92) defines near-term support to watch. It has not formed a sound base.
>>> FEATURED STOCK ARTICLE : Finished Near Session Low With Small Gain on Light Volume - 11/13/2014
View all notes |
Set NEW NOTE alert |
CANSLIM.net Company Profile |
SEC
News |
Chart |
Request a new note
C
A N
S L
I M
|
Symbol/Exchange
Company Name
Industry Group |
PRICE |
CHANGE
(%Change) |
Day High |
Volume
(% DAV)
(% 50 day avg vol) |
52 Wk Hi
% From Hi |
Featured
Date |
Price
Featured |
Pivot Featured |
|
Max Buy |
SNCR
-
NASDAQ
Synchronoss Technologies
COMPUTER SOFTWARE andamp; SERVICES - Application Software
|
$43.12
|
+0.87
2.06% |
$43.85
|
1,285,002
204.29% of 50 DAV
50 DAV is 629,000
|
$54.05
-20.22%
|
10/27/2014
|
$46.40
|
PP = $47.81
|
|
MB = $50.20
|
Most Recent Note - 11/19/2014 6:44:41 PM
G - Gapped down today and violated its 50 DMA line with a damaging volume-driven loss raising concern and triggering a technical sell signal. It may find support near prior lows in the $41 area, but a rebound above the 50 DMA line is needed for its outlook to improve.
>>> FEATURED STOCK ARTICLE : Loss on Heavy Volume a Sign of Distributional Pressure - 11/12/2014
View all notes |
Set NEW NOTE alert |
CANSLIM.net Company Profile |
SEC
News |
Chart |
Request a new note
C
A N
S L
I M
|
STRT
-
NASDAQ
Strattec Security Corp
AUTOMOTIVE - Auto Parts
|
$105.76
|
+1.18
1.13% |
$106.00
|
14,078
54.15% of 50 DAV
50 DAV is 26,000
|
$109.44
-3.36%
|
11/20/2014
|
$105.76
|
PP = $109.54
|
|
MB = $115.02
|
Most Recent Note - 11/20/2014 4:44:18 PM
Y - Color code is changed to yellow after forming an advanced "3-weeks tight" base. Volume-driven gains for new highs may trigger a new (or add-on) technical buy signal. Prior highs coincide with its 50 DMA line defining important near-term support to watch on pullbacks. See the latest FSU analysis for more details and new annotated graphs.
>>> FEATURED STOCK ARTICLE : Formed New Advanced "3-Weeks Tight" Base - 11/20/2014
View all notes |
Set NEW NOTE alert |
CANSLIM.net Company Profile |
SEC
News |
Chart |
Request a new note
C
A N
S L
I M
|
|
|
|
THESE ARE NOT BUY RECOMMENDATIONS!
Comments contained in the body of this report are technical
opinions only. The material herein has been obtained
from sources believed to be reliable and accurate, however,
its accuracy and completeness cannot be guaranteed.
This site is not an investment advisor, hence it does
not endorse or recommend any securities or other investments.
Any recommendation contained in this report may not
be suitable for all investors and it is not to be deemed
an offer or solicitation on our part with respect to
the purchase or sale of any securities. All trademarks,
service marks and trade names appearing in this report
are the property of their respective owners, and are
likewise used for identification purposes only.
This report is a service available
only to active Paid Premium Members.
You may opt-out of receiving report notifications
at any time. Questions or comments may be submitted
by writing to Premium Membership Services 665 S.E. 10 Street, Suite 201 Deerfield Beach, FL 33441-5634 or by calling 1-800-965-8307
or 954-785-1121.
|
|
|

