You are not logged in.
This means you
CAN ONLY VIEW reports that were published prior to Sunday, October 20, 2024.
You
MUST UPGRADE YOUR MEMBERSHIP if you want to see any current reports.
AFTER MARKET UPDATE - TUESDAY, NOVEMBER 18TH, 2014
Previous After Market Report Next After Market Report >>>
|
|
|
|
DOW |
+40.07 |
17,687.82 |
+0.23% |
|
Volume |
714,046,590 |
+6% |
|
Volume |
1,539,861,830 |
-1% |
|
NASDAQ |
+31.44 |
4,702.44 |
+0.67% |
|
Advancers |
1,876 |
59% |
|
Advancers |
1,747 |
60% |
|
S&P 500 |
+10.48 |
2,051.80 |
+0.51% |
|
Decliners |
1,225 |
38% |
|
Decliners |
1,093 |
37% |
|
Russell 2000 |
+6.50 |
1,170.73 |
+0.56% |
|
52 Wk Highs |
182 |
|
|
52 Wk Highs |
107 |
|
|
S&P 600 |
+2.86 |
675.87 |
+0.42% |
|
52 Wk Lows |
39 |
|
|
52 Wk Lows |
57 |
|
|
 |
Breadth Positive as Major Averages Rose
Kenneth J. Gruneisen - Passed the CAN SLIM® Master's Exam
Stocks advanced on Tuesday's session. The Dow rose 40 points to an all-time high of 17,687. The S&P gained 10 points to record level of 2,051. The NASDAQ added 31 points to close at 4,702. The volume totals were reported mixed, higher than the prior session total on the NYSE and lighter on the Nasdaq exchange. Breadth was positive as advancers led decliners by a 3-2 margin on the NYSE and by nearly 9-5 on the Nasdaq exchange. There were 64 high-ranked companies from the CANSLIM.net Leaders List that made new 52-week highs and appeared on the CANSLIM.net BreakOuts Page, up from the prior session total of 47 stocks. New 52-week highs expanded and outnumbered new 52-week lows on the NYSE and on the Nasdaq exchange. There were gains for 6 of the 12 high-ranked companies currently on the Featured Stocks Page. Disciplined investors know that new buying efforts may be made under the fact-based investment system only in stocks meeting all key criteria.
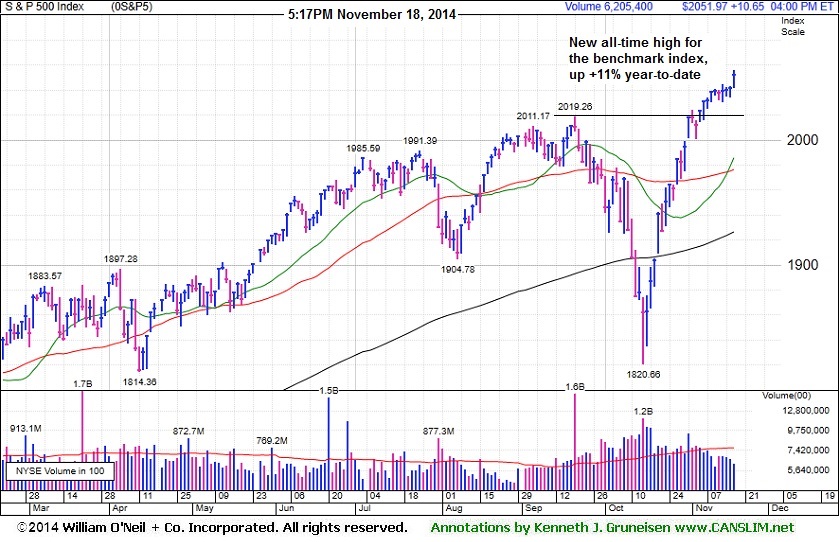
PICTURED: The S&P 500 index is at a new all-time high, up +11% year-to-date.
The major averages finished higher following encouraging news from overseas. Japan's prime minster called for a delay of an expected sales tax hike next year. In Europe, a survey of German investor sentiment for November came in ahead of consensus projections. On the U.S. economic front, producer prices increased +0.2% in October as rising food costs offset a decline in energy. A separate report showed homebuilder sentiment improved more-than-expected this month.
Nine of 10 sectors were up on the session. Health care and materials were the best performing groups. Medtronic (MDT +4.74%) rallied. Activis (ACT +8.74%) rallied a day after it announced it would buy Botox maker Allergan (AGN +2.02%) for $66 billion. Shares of Newmont Mining (NEM +3.43%) in sympathy with gold's advance. Telecom was the lone sector lower with Verizon (VZ -0.35%) edging lower. Among earnings, Home Depot (HD -2.02%) and Urban Outfitters (URBN -6.62%) as both companies' quarterly results missed consensus estimates.
Treasuries were up with the 10-year gaining 6/32 to yield 2.32%. In commodities, WTI crude lost -1.3% to $74.32/barrel on the NYMEX. COMEX gold futures rose +1.1% to $1,196.30/ounce.
Large gains on 10/21/14 backed by higher volume totals while leadership (stocks hitting new 52-week highs) expanded met the definition of a "follow-through day" confirming a new uptrend for the market (M criteria). The S&P 500 Index, Nasdaq Composite Index, and the Dow Jones Industrial Average have collectively rebounded above their respective 50-day and 200-day moving average (DMA) lines, technically putting the market in a healthier stance.
The CANSLIM.net Featured Stocks Page shows the most action-worthy candidates and their latest notes and a Headline Link directs members to the latest detailed analysis with data-packed graphs annotated by a Certified expert along with links to additional resources. The Premium Member Homepage includes "dynamic archives" to all prior pay reports published.
|
 Kenneth J. Gruneisen started out as a licensed stockbroker in August 1987, a couple of months prior to the historic stock market crash that took the Dow Jones Industrial Average down -22.6% in a single day. He has published daily fact-based fundamental and technical analysis on high-ranked stocks online for two decades. Through FACTBASEDINVESTING.COM, Kenneth provides educational articles, news, market commentary, and other information regarding proven investment systems that work in good times and bad.
Comments contained in the body of this report are technical opinions only and are not necessarily those of Gruneisen Growth Corp. The material herein has been obtained from sources believed to be reliable and accurate, however, its accuracy and completeness cannot be guaranteed. Our firm, employees, and customers may effect transactions, including transactions contrary to any recommendation herein, or have positions in the securities mentioned herein or options with respect thereto. Any recommendation contained in this report may not be suitable for all investors and it is not to be deemed an offer or solicitation on our part with respect to the purchase or sale of any securities. |
|
 |
Tech Sector and Gold & Silver Index Rose
Kenneth J. Gruneisen - Passed the CAN SLIM® Master's Exam
The Networking Index ($NWX +1.08%), Biotechnology Index ($BTK +1.81%), and the Semiconductor Index ($SOX +1.90%) posted unanimous gains on Tuesday. The Gold & Silver Index ($XAU +4.39%) was a standout gainer. Energy-related shares were mixed as the Oil Services Index ($OSX -0.94%) fell and the Integrated Oil Index ($XOI +0.56%) rose. The Broker/Dealer Index ($XBD +0.71%) posted a gain while the Bank Index ($BKX -0.11%) edged lower. The Retail Index ($RLX -0.23%) also finished slightly lower.
Charts courtesy www.stockcharts.com
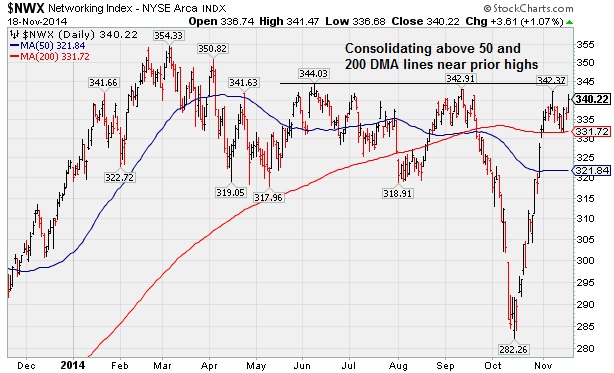
PICTURED: The Networking Index ($NWX +1.08%) is consolidating above its 50-day and 200-day moving average (DMA) lines near prior highs.
| Oil Services |
$OSX |
240.62 |
-2.29 |
-0.94% |
-14.38% |
| Integrated Oil |
$XOI |
1,435.11 |
+8.01 |
+0.56% |
-4.53% |
| Semiconductor |
$SOX |
654.77 |
+12.22 |
+1.90% |
+22.38% |
| Networking |
$NWX |
340.24 |
+3.63 |
+1.08% |
+5.03% |
| Broker/Dealer |
$XBD |
176.59 |
+1.24 |
+0.71% |
+9.98% |
| Retail |
$RLX |
972.57 |
-2.21 |
-0.23% |
+3.25% |
| Gold & Silver |
$XAU |
75.10 |
+3.16 |
+4.39% |
-10.75% |
| Bank |
$BKX |
72.63 |
-0.08 |
-0.11% |
+4.87% |
| Biotech |
$BTK |
3,321.87 |
+59.15 |
+1.81% |
+42.54% |
|
|
|
 |
Consolidation Continues Above Prior Highs
Kenneth J. Gruneisen - Passed the CAN SLIM® Master's Exam
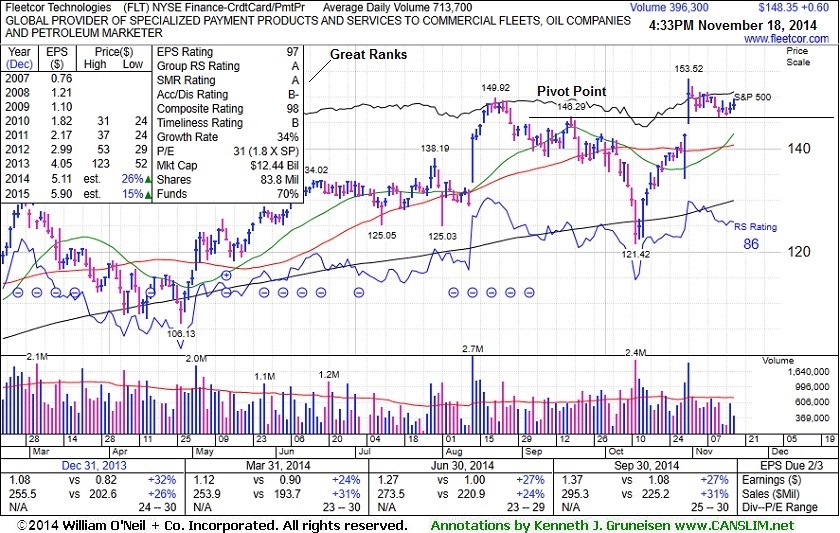
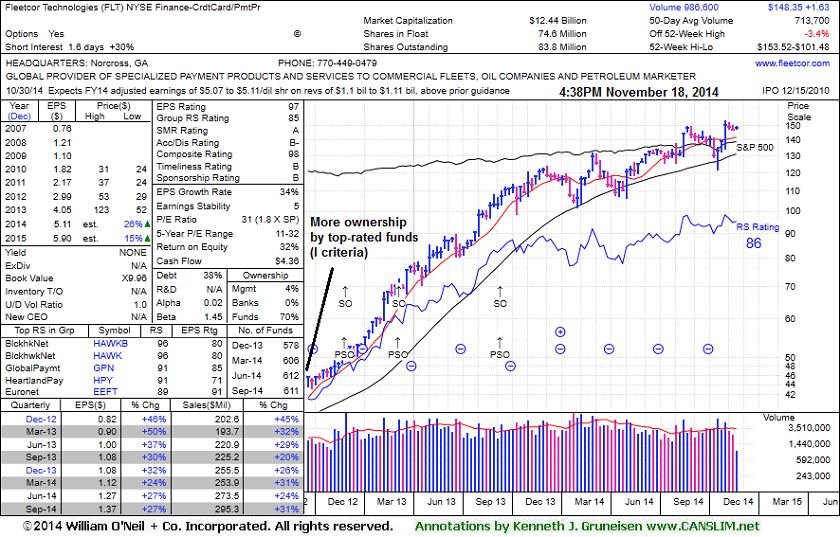
FleetCor Technologies, Inc's (FLT +$0.56 or +0.38% to $148.31) is still consolidating with volume totals cooling after highlighted in yellow in the 10/31/14 mid-day report (read here) clinching a convincing technical buy signal. Prior highs acted as support during its recent consolidation and it remains trading above its pivot point and below its "max buy" level. FLT last appeared in this FSU section on 10/31/14 with annotated graphs under the headline, "Strong Finish Following Gap Up After Earnings News". It finished strong after highlighted in yellow with new pivot point cited based on its 9/18/14 high in a "double bottom" base (read here).
It reported earnings +27% on +31% sales revenues for the Sep '14 quarter, continuing its strong earnings history with results above the +25% minimum guideline (C criteria). Its Relative Strength rating of 86 remains above the 80+ minimum guideline for buy candidates.
The company hails from the Finance - Credit Card Payment Processing group which saw big gains in recent weeks from Visa (V) and MasterCard (MA). Impressive strength and leadership from other firms in the same industry group is a reassurance concerning the L criteria. The company completed a Secondary Offering on 9/11/13. Prior Secondary Offerings on 3/14/12, 6/11/12, 11/29/12, and 3/08/13 were previously noted, "Such offerings often are a short-term hindrance to upward price progress yet typically result in broader institutional ownership interest." The number of top-rated funds owning its shares rose from 193 in Mar '12 to 611 in Sep '14, a reassuring sign concerning the I criteria.
|
|
|
Color Codes Explained :
Y - Better candidates highlighted by our
staff of experts.
G - Previously featured
in past reports as yellow but may no longer be buyable under the
guidelines.
***Last / Change / Volume data in this table is the closing quote data***
Symbol/Exchange
Company Name
Industry Group |
PRICE |
CHANGE
(%Change) |
Day High |
Volume
(% DAV)
(% 50 day avg vol) |
52 Wk Hi
% From Hi |
Featured
Date |
Price
Featured |
Pivot Featured |
|
Max Buy |
ACT
-
NYSE
Actavis plc
Medical-Generic Drugs
|
$247.94
|
+4.17
1.71% |
$255.51
|
16,697,883
695.75% of 50 DAV
50 DAV is 2,400,000
|
$254.41
-2.54%
|
6/20/2014
|
$216.53
|
PP = $230.87
|
|
MB = $242.41
|
 Most Recent Note - 11/17/2014 12:15:21 PM
Y - Announced plans to acquire Allergan (AGN) for $66 Billion. Its 50 DMA line ($238.67) defines support where a violation would raise concerns.
>>> FEATURED STOCK ARTICLE : New Highs Following Deep "V" Shaped Pullback - Not a Sound Base - 11/6/2014
View all notes |
Set NEW NOTE alert |
CANSLIM.net Company Profile |
SEC
News |
Chart |
Request a new note
C
A N
S L
I M


|
AFSI
-
NASDAQ
Amtrust Financial Svcs
INSURANCE - Property and; Casualty Insurance
|
$52.61
|
+0.13
0.25% |
$53.21
|
1,028,627
104.85% of 50 DAV
50 DAV is 981,000
|
$53.80
-2.21%
|
10/17/2014
|
$45.24
|
PP = $46.02
|
|
MB = $48.32
|
Most Recent Note - 11/14/2014 6:16:10 PM
G - Posted a 5th consecutive gain today on near average volume, finishing near its 52-week high. Recent lows near $42 and its 50 DMA line define important near-term support.
>>> FEATURED STOCK ARTICLE : 50-Day Average Acted as Support Following Analyst Downgrade - 11/5/2014
View all notes |
Set NEW NOTE alert |
CANSLIM.net Company Profile |
SEC
News |
Chart |
Request a new note
C
A N
S L
I M
|
ALXN
-
NASDAQ
Alexion Pharmaceuticals
DRUGS - Drug Manufacturers - Other
|
$186.78
|
-1.98
-1.05% |
$191.34
|
929,165
76.47% of 50 DAV
50 DAV is 1,215,000
|
$197.64
-5.49%
|
10/23/2014
|
$184.01
|
PP = $185.53
|
|
MB = $194.81
|
Most Recent Note - 11/14/2014 6:14:22 PM
Y - Pulled back today on higher volume but below average volume, still trading above its pivot point and below its "max buy" level. Prior highs in the $180 area define initial support to watch on pullbacks.
>>> FEATURED STOCK ARTICLE : New High Close With Gain on Light Volume - 11/10/2014
View all notes |
Set NEW NOTE alert |
CANSLIM.net Company Profile |
SEC
News |
Chart |
Request a new note
C
A N
S L
I M
|
BIDU
-
NASDAQ
Baidu Inc Ads
INTERNET - Internet Information Providers
|
$244.15
|
-5.55
-2.22% |
$250.00
|
4,376,033
114.05% of 50 DAV
50 DAV is 3,837,000
|
$251.99
-3.11%
|
10/30/2014
|
$234.08
|
PP = $231.51
|
|
MB = $243.09
|
Most Recent Note - 11/17/2014 5:17:44 PM
Y - Pulled back below its "max buy" level and its color code was changed to yellow. Prior highs near $230 define near-term support to watch on pullbacks. See the latest FSU analysis for more details and new annotated graphs.
>>> FEATURED STOCK ARTICLE : Consolidating Back Below "Max Buy" Level - 11/17/2014
View all notes |
Set NEW NOTE alert |
CANSLIM.net Company Profile |
SEC
News |
Chart |
Request a new note
C
A N
S L
I M
|
EPAM
-
NYSE
Epam Systems Inc
COMPUTER SOFTWARE and SERVICES - Information Technology Service
|
$49.69
|
+0.05
0.10% |
$50.03
|
455,075
108.87% of 50 DAV
50 DAV is 418,000
|
$50.00
-0.62%
|
10/23/2014
|
$45.21
|
PP = $46.09
|
|
MB = $48.39
|
Most Recent Note - 11/13/2014 6:06:17 PM
G - Rallied with +24% above average volume today for a new high close. Color code is changed to green after rising above its "max buy" level. Prior highs in the $44 area defining initial support above its 50 DMA line ($43.12).
>>> FEATURED STOCK ARTICLE : Consolidating Above Prior Highs Following Technical Breakout - 11/11/2014
View all notes |
Set NEW NOTE alert |
CANSLIM.net Company Profile |
SEC
News |
Chart |
Request a new note
C
A N
S L
I M
|
Symbol/Exchange
Company Name
Industry Group |
PRICE |
CHANGE
(%Change) |
Day High |
Volume
(% DAV)
(% 50 day avg vol) |
52 Wk Hi
% From Hi |
Featured
Date |
Price
Featured |
Pivot Featured |
|
Max Buy |
FB
-
NASDAQ
Facebook Inc Cl A
INTERNET
|
$74.24
|
-0.64
-0.85% |
$75.66
|
28,701,191
73.51% of 50 DAV
50 DAV is 39,042,000
|
$81.16
-8.53%
|
9/9/2014
|
$76.67
|
PP = $76.84
|
|
MB = $80.68
|
Most Recent Note - 11/14/2014 6:09:43 PM
G - Recent gains have lacked volume conviction and it encountered resistance at its 50 DMA line following a violation on 3 times average volume on 10/29/14 that raised concerns and triggered a technical sell signal. See the latest FSU analysis for more details and new annotated graphs.
>>> FEATURED STOCK ARTICLE : Following Violation 50-Day Average Acted as Resistance - 11/14/2014
View all notes |
Set NEW NOTE alert |
CANSLIM.net Company Profile |
SEC
News |
Chart |
Request a new note
C
A N
S L
I M
|
FLT
-
NYSE
Fleetcor Technologies
DIVERSIFIED SERVICES - Business/Management Services
|
$147.75
|
+1.03
0.70% |
$149.07
|
590,309
83.26% of 50 DAV
50 DAV is 709,000
|
$153.52
-3.76%
|
10/31/2014
|
$148.50
|
PP = $146.29
|
|
MB = $153.60
|
Most Recent Note - 11/14/2014 6:21:27 PM
Y - Consolidating with volume totals cooling after highlighted in yellow in the 10/31/14 mid-day report (read here) clinching a convincing technical buy signal. It remains trading above its pivot point and below its "max buy" level.
>>> FEATURED STOCK ARTICLE : Strong Finish Following Gap Up After Earnings News - 10/31/2014
View all notes |
Set NEW NOTE alert |
CANSLIM.net Company Profile |
SEC
News |
Chart |
Request a new note
C
A N
S L
I M
|
ILMN
-
NASDAQ
Illumina Inc
DRUGS - Biotechnology
|
$182.91
|
+2.41
1.34% |
$184.40
|
1,301,341
102.47% of 50 DAV
50 DAV is 1,270,000
|
$197.37
-7.33%
|
10/22/2014
|
$188.77
|
PP = $182.27
|
|
MB = $191.38
|
Most Recent Note - 11/17/2014 5:44:13 PM
Y - Managed a "positive reversal" today. Consolidating above its pivot point and below its "max buy" level. Previously noted - "Prior highs near $182 define initial support to watch on pullbacks."
>>> FEATURED STOCK ARTICLE : Consolidating Above Prior Highs Which Define Initial Support - 11/7/2014
View all notes |
Set NEW NOTE alert |
CANSLIM.net Company Profile |
SEC
News |
Chart |
Request a new note
C
A N
S L
I M
|
NBCB
-
NASDAQ
First N B C Bank Hldg
Banks-Southeast
|
$36.88
|
-0.61
-1.63% |
$37.72
|
71,025
87.69% of 50 DAV
50 DAV is 81,000
|
$38.18
-3.40%
|
10/31/2014
|
$36.31
|
PP = $35.93
|
|
MB = $37.73
|
Most Recent Note - 11/13/2014 12:24:15 PM
G - Touching another new 52-week high today, rising further above its "max buy" level. Held its ground stubbornly following a streak of volume-driven gains. No resistance remains due to overhead supply. Prior highs near $34 define near-term support to watch on pullbacks.
>>> FEATURED STOCK ARTICLE : Financial Firm at 52-Week High Tallied 8th Consecutive Gain - 11/3/2014
View all notes |
Set NEW NOTE alert |
CANSLIM.net Company Profile |
SEC
News |
Chart |
Request a new note
C
A N
S L
I M
|
PANW
-
NYSE
Palo Alto Networks
Computer Sftwr-Security
|
$109.35
|
-1.43
-1.29% |
$112.11
|
1,216,924
55.40% of 50 DAV
50 DAV is 2,196,700
|
$111.45
-1.88%
|
7/30/2014
|
$84.21
|
PP = $85.88
|
|
MB = $90.17
|
Most Recent Note - 11/13/2014 6:00:37 PM
G - Hit a new all-time high today but finished near the session low with a small gain on light volume. Its 50 DMA line ($100.71) defines near-term support to watch. It has not formed a sound base. See the latest FSU analysis for more details and new annotated graphs.
>>> FEATURED STOCK ARTICLE : Finished Near Session Low With Small Gain on Light Volume - 11/13/2014
View all notes |
Set NEW NOTE alert |
CANSLIM.net Company Profile |
SEC
News |
Chart |
Request a new note
C
A N
S L
I M
|
Symbol/Exchange
Company Name
Industry Group |
PRICE |
CHANGE
(%Change) |
Day High |
Volume
(% DAV)
(% 50 day avg vol) |
52 Wk Hi
% From Hi |
Featured
Date |
Price
Featured |
Pivot Featured |
|
Max Buy |
SNCR
-
NASDAQ
Synchronoss Technologies
COMPUTER SOFTWARE andamp; SERVICES - Application Software
|
$47.57
|
-0.81
-1.67% |
$48.31
|
728,460
127.58% of 50 DAV
50 DAV is 571,000
|
$54.05
-11.99%
|
10/27/2014
|
$46.40
|
PP = $47.81
|
|
MB = $50.20
|
Most Recent Note - 11/17/2014 5:48:09 PM
G - Down today for another loss on higher volume and above average volume, a sign of distributional pressure. Testing support at prior highs in the $47 area and its 50 DMA line ($46.36) on pullbacks.
>>> FEATURED STOCK ARTICLE : Loss on Heavy Volume a Sign of Distributional Pressure - 11/12/2014
View all notes |
Set NEW NOTE alert |
CANSLIM.net Company Profile |
SEC
News |
Chart |
Request a new note
C
A N
S L
I M
|
STRT
-
NASDAQ
Strattec Security Corp
AUTOMOTIVE - Auto Parts
|
$104.42
|
+0.66
0.64% |
$106.50
|
23,423
90.09% of 50 DAV
50 DAV is 26,000
|
$109.44
-4.59%
|
9/19/2014
|
$86.06
|
PP = $89.97
|
|
MB = $94.47
|
Most Recent Note - 11/13/2014 12:44:03 PM
G - Still stubbornly holding its ground near its 52-week high, possibly forming an advanced "3-weeks tight" base. Prior highs in the $88 area coincide with its 50 DMA line ($88.50) defining important near-term support to watch on pullbacks.
>>> FEATURED STOCK ARTICLE : Stock With Small Supply Quickly Got Extended From Prior Base - 11/4/2014
View all notes |
Set NEW NOTE alert |
CANSLIM.net Company Profile |
SEC
News |
Chart |
Request a new note
C
A N
S L
I M
|
|
|
|
THESE ARE NOT BUY RECOMMENDATIONS!
Comments contained in the body of this report are technical
opinions only. The material herein has been obtained
from sources believed to be reliable and accurate, however,
its accuracy and completeness cannot be guaranteed.
This site is not an investment advisor, hence it does
not endorse or recommend any securities or other investments.
Any recommendation contained in this report may not
be suitable for all investors and it is not to be deemed
an offer or solicitation on our part with respect to
the purchase or sale of any securities. All trademarks,
service marks and trade names appearing in this report
are the property of their respective owners, and are
likewise used for identification purposes only.
This report is a service available
only to active Paid Premium Members.
You may opt-out of receiving report notifications
at any time. Questions or comments may be submitted
by writing to Premium Membership Services 665 S.E. 10 Street, Suite 201 Deerfield Beach, FL 33441-5634 or by calling 1-800-965-8307
or 954-785-1121.
|
|
|

