You are not logged in.
This means you
CAN ONLY VIEW reports that were published prior to Tuesday, March 25, 2025.
You
MUST UPGRADE YOUR MEMBERSHIP if you want to see any current reports.
AFTER MARKET UPDATE - WEDNESDAY, NOVEMBER 16TH, 2011
Previous After Market Report Next After Market Report >>>
|
|
|
|
DOW |
-190.57 |
11,905.59 |
-1.58% |
|
Volume |
919,217,510 |
+18% |
|
Volume |
1,902,535,120 |
+16% |
|
NASDAQ |
-46.59 |
2,639.61 |
-1.73% |
|
Advancers |
706 |
23% |
|
Advancers |
680 |
26% |
|
S&P 500 |
-20.90 |
1,236.91 |
-1.66% |
|
Decliners |
2,325 |
75% |
|
Decliners |
1,883 |
71% |
|
Russell 2000 |
-13.22 |
729.86 |
-1.78% |
|
52 Wk Highs |
40 |
|
|
52 Wk Highs |
34 |
|
|
S&P 600 |
-7.53 |
403.73 |
-1.83% |
|
52 Wk Lows |
31 |
|
|
52 Wk Lows |
74 |
|
|
 |
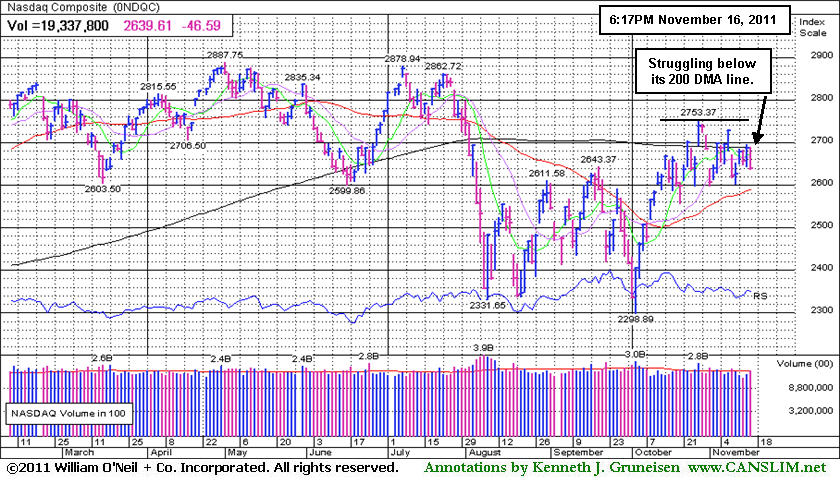
Major Averages Fall With Volume Increase Indicating Distribution
Kenneth J. Gruneisen - Passed the CAN SLIM® Master's Exam
The major averages couldn't muster a late-day rally this time around. Higher volume totals were reported on both major exchanges indicating distributional pressure from the institutional crowd. Declining issues outnumbered advancing issues by more than 3-1 on the NYSE and by nearly 3-1 on the Nasdaq exchange. New 52-week lows still outnumbered new 52-week highs on the Nasdaq exchange, however new 52-week highs outnumbered new 52-week lows on the NYSE for a fourth consecutive session. There were 29 high-ranked companies from the CANSLIM.net Leaders List that made new 52-week highs and appeared on the CANSLIM.net BreakOuts Page, down from the prior session total of 38 stocks. There were losses for 17 of the 18 high-ranked companies currently included on the Featured Stocks Page.
Stocks extended losses after Fitch Ratings said U.S. banks have manageable exposure to stressed European markets, but risks of a negative shock are rising. Earlier declines came from negative headlines out of Europe. Bank of England policy makers said that failure to resolve the debt turmoil could damage the global economy. The Spanish economy did not grow in the third quarter, adding to contagion fears.
A batch of encouraging economic data was overlooked. Consumer prices fell for the first time in four months, but prices outside of food and energy posted a slight increase. Industrial production was higher than expected and capacity utilization also increased and U.S. homebuilder sentiment hit its highest level since May 2010. Financial and materials led losers, while oil's rally above $100 gave energy stocks a boost.
Retailers reported mixed earnings. Target Corp (TGT -0.45%) was off despite posting a higher quarterly profit. Abercrombie & Fitch Co (ANF -13.64%) tumbled after missing estimates by a large margin. In technology, Dell Inc (DELL -3.20%) fell after forecasting slow sales growth for the fourth quarter. Applied Materials, NetApp and Limited Brands reported results after-the-bell.
Our monthly newsletter CANSLIM.net News will be published soon with an informative review of current market conditions, leading groups, and best buy candidates. Via the Premium Member Homepage links to all prior reports and webcasts are always available.
PICTURED: The Nasdaq Composite Index is struggling below its 200-day moving average line. Recent chart highs define near-term resistance above that important long-term average.
|
 Kenneth J. Gruneisen started out as a licensed stockbroker in August 1987, a couple of months prior to the historic stock market crash that took the Dow Jones Industrial Average down -22.6% in a single day. He has published daily fact-based fundamental and technical analysis on high-ranked stocks online for two decades. Through FACTBASEDINVESTING.COM, Kenneth provides educational articles, news, market commentary, and other information regarding proven investment systems that work in good times and bad.
Comments contained in the body of this report are technical opinions only and are not necessarily those of Gruneisen Growth Corp. The material herein has been obtained from sources believed to be reliable and accurate, however, its accuracy and completeness cannot be guaranteed. Our firm, employees, and customers may effect transactions, including transactions contrary to any recommendation herein, or have positions in the securities mentioned herein or options with respect thereto. Any recommendation contained in this report may not be suitable for all investors and it is not to be deemed an offer or solicitation on our part with respect to the purchase or sale of any securities. |
|
 |
Weak Financial Group Lead Decliners
Kenneth J. Gruneisen - Passed the CAN SLIM® Master's Exam
The Broker/Dealer Index ($XBD -4.04%) and Bank Index ($BKX -1.93%) were a negative influence creating a drag on the major averages, however there were widespread losses on Wednesday. The defensive groups including the Healthcare Index ($HMO -3.40%) and Gold & Silver Index ($XAU -1.95%) lost ground. The tech sector saw unanimous losses from the Internet Index ($IIX -1.87%), Networking Index ($NWX -1.79%), Biotechnology Index ($BTK -1.79%), and Semiconductor Index ($SOX -0.59%). The Retail Index ($RLX -1.55%) also slumped. The Oil Services Index ($OSX +0.42%) finished with a small gain but the Integrated Oil Index ($XOI -1.61%) ended in the red.
Charts courtesy www.stockcharts.com
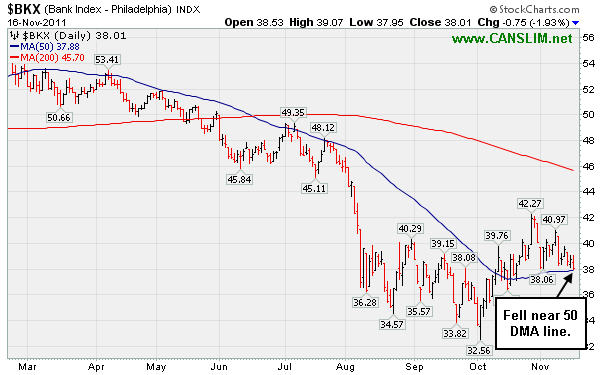
PICTURED: The Bank Index ($BKX -1.93%) fell near its 50-day moving average. Further deterioration in the financial influential groups would not bode well for the latest rally's outlook.
| Oil Services |
$OSX |
235.77 |
+0.99 |
+0.42% |
-3.81% |
| Healthcare |
$HMO |
2,199.34 |
-77.34 |
-3.40% |
+29.99% |
| Integrated Oil |
$XOI |
1,214.48 |
-19.93 |
-1.61% |
+0.11% |
| Semiconductor |
$SOX |
389.92 |
-2.31 |
-0.59% |
-5.32% |
| Networking |
$NWX |
237.76 |
-4.33 |
-1.79% |
-15.25% |
| Internet |
$IIX |
295.44 |
-5.64 |
-1.87% |
-3.99% |
| Broker/Dealer |
$XBD |
81.33 |
-3.43 |
-4.04% |
-33.07% |
| Retail |
$RLX |
538.60 |
-8.48 |
-1.55% |
+5.94% |
| Gold & Silver |
$XAU |
205.19 |
-4.08 |
-1.95% |
-9.44% |
| Bank |
$BKX |
38.01 |
-0.75 |
-1.93% |
-27.20% |
| Biotech |
$BTK |
1,060.34 |
-19.30 |
-1.79% |
-18.29% |
|
|
|
 |
Not An Encouraging Volume Pattern On Weekly Graph
Kenneth J. Gruneisen - Passed the CAN SLIM® Master's Exam
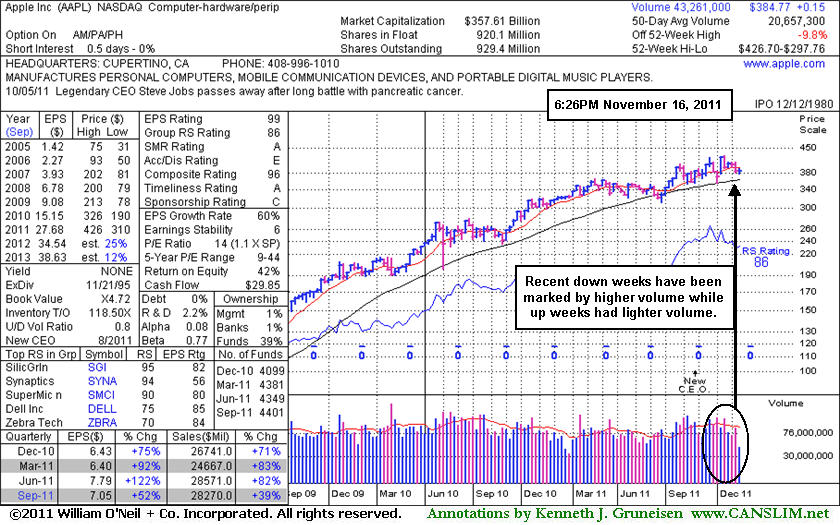
Apple Inc (AAPL -$4.06 or -1.04% to $384.77) slumped to a close -9.8% off its 52-week high today. Its weekly graph below shows that recent down weeks were marked by higher volume totals while up weeks had lighter volume. Its 200-day moving average (DMA) line defines the next important chart support to watch, meanwhile the longer it lingers below its 50 DMA line the worse its outlook gets. It reported earnings +52% on +39% sales revenues for the quarter ended September 30, 2011 versus the year ago period, marking the tech leader's weakest increases in sales and earnings in any quarter since the Dec '09. It has not formed a sound base pattern. Disciplined investors probably did not do any recent accumulating, and they might sooner choose a fresh breakout which more closely matches the winning models of the fact-based investment system.
It was noted as already heavily owned by the institutional crowd in its last appearance in this FSU section on 10/20/11 with an annotated daily graph under the the headline, "Trouble Attracting New Interest for Heavily Owned Tech Leader." The data now shows that there was a slight improvement in the number of top-rated funds reportedly owning its shares as it increased from 4,349 in Jun '11 to 4,401 in Sep '11.
In the past it found support near its 200-day moving average (DMA) line and narrowly avoided undercutting the mid-point (low point) between the 2 prior chart highs, a violation which would have completed the noted double top pattern and triggered a technical sell signal. Half-hearted (volume-wise) gains actually helped it rally back again for yet another new all-time high in the interim, before its rare earnings disappointment.
Prior reports have cautioned "With the largest market cap of all publicly traded firms, AAPL does not fit the mold of a small growth firm unknown by the institutional crowd which would be more typical of the winning models of the fact-based investment system."
|
|
|
Color Codes Explained :
Y - Better candidates highlighted by our
staff of experts.
G - Previously featured
in past reports as yellow but may no longer be buyable under the
guidelines.
***Last / Change / Volume data in this table is the closing quote data***
Symbol/Exchange
Company Name
Industry Group |
PRICE |
CHANGE
(%Change) |
Day High |
Volume
(% DAV)
(% 50 day avg vol) |
52 Wk Hi
% From Hi |
Featured
Date |
Price
Featured |
Pivot Featured |
|
Max Buy |
AAPL
-
NASDAQ
Apple Inc
COMPUTER HARDWARE - Personal Computers
|
$384.77
|
-4.06
-1.04% |
$391.14
|
12,453,260
61.23% of 50 DAV
50 DAV is 20,337,600
|
$426.70
-9.83%
|
9/16/2011
|
$399.14
|
PP = $404.60
|
|
MB = $424.83
|
 Most Recent Note - 11/16/2011 5:18:37 PM
G - Slumped to a close -9.8% off its 52-week high today. Gains in recent weeks lacked volume conviction while it has endured distributional pressure. Its 200 DMA line defines the next important chart support to watch.
>>> The latest Featured Stock Update with an annotated graph appeared on 11/16/2011. Click here.
View all notes |
Alert me of new notes |
CANSLIM.net Company Profile |
SEC |
Zacks Reports |
StockTalk |
News |
Chart |
Request a new note
C
A N
S L
I M


|
ADS
-
NYSE
Alliance Data Sys Corp
COMPUTER SOFTWARE and SERVICES - Information and Delivery Service
|
$99.83
|
-1.52
-1.50% |
$102.69
|
720,627
75.86% of 50 DAV
50 DAV is 949,900
|
$107.18
-6.86%
|
10/21/2011
|
$97.94
|
PP = $101.15
|
|
MB = $106.21
|
Most Recent Note - 11/16/2011 5:21:41 PM
Y - Volume totals have been below average while it has sputtered just under its pivot point and prior chart highs in the $101 area. The next important support to watch is its 50 DMA line.
>>> The latest Featured Stock Update with an annotated graph appeared on 10/21/2011. Click here.
View all notes |
Alert me of new notes |
CANSLIM.net Company Profile |
SEC |
Zacks Reports |
StockTalk |
News |
Chart |
Request a new note
C
A N
S L
I M
|
ALXN
-
NASDAQ
Alexion Pharmaceuticals
DRUGS - Drug Manufacturers - Other
|
$66.17
|
-1.15
-1.71% |
$67.36
|
1,247,901
82.03% of 50 DAV
50 DAV is 1,521,300
|
$70.42
-6.04%
|
9/15/2011
|
$63.20
|
PP = $60.81
|
|
MB = $63.85
|
Most Recent Note - 11/16/2011 5:24:21 PM
Y - Holding its ground after recently finding support near its 50 DMA line. Color code was changed to yellow however a new pivot point was not cited. See latest FSU analysis for more details and a new annotated daily graph.
>>> The latest Featured Stock Update with an annotated graph appeared on 11/14/2011. Click here.
View all notes |
Alert me of new notes |
CANSLIM.net Company Profile |
SEC |
Zacks Reports |
StockTalk |
News |
Chart |
Request a new note
C
A N
S L
I M
|
CATM
-
NASDAQ
Cardtronics Inc
DIVERSIFIED SERVICES - Business/Management Services
|
$26.23
|
-0.31
-1.17% |
$26.93
|
301,173
71.42% of 50 DAV
50 DAV is 421,700
|
$28.46
-7.84%
|
11/8/2011
|
$25.99
|
PP = $25.95
|
|
MB = $27.25
|
Most Recent Note - 11/16/2011 5:25:53 PM
Y - Volume totals have been cooling while consolidating above prior highs in the $26 area which acted as support following its 11/08/11 breakout.
>>> The latest Featured Stock Update with an annotated graph appeared on 11/8/2011. Click here.
View all notes |
Alert me of new notes |
CANSLIM.net Company Profile |
SEC |
Zacks Reports |
StockTalk |
News |
Chart |
Request a new note
C
A N
S L
I M
|
CELG
-
NASDAQ
Celgene Corp
DRUGS - Drug Manufacturers - Major
|
$64.87
|
-0.54
-0.83% |
$65.82
|
3,054,267
79.50% of 50 DAV
50 DAV is 3,841,700
|
$68.25
-4.95%
|
9/16/2011
|
$61.21
|
PP = $62.59
|
|
MB = $65.72
|
Most Recent Note - 11/16/2011 5:26:51 PM
Y -Still consolidating above its 50 DMA line defining important near-term chart support. A violation of its short-term average and recent chart low ($62.71 on 11/01/11) would raise concerns and trigger technical sell signals.
>>> The latest Featured Stock Update with an annotated graph appeared on 11/7/2011. Click here.
View all notes |
Alert me of new notes |
CANSLIM.net Company Profile |
SEC |
Zacks Reports |
StockTalk |
News |
Chart |
Request a new note
C
A N
S L
I M
|
Symbol/Exchange
Company Name
Industry Group |
PRICE |
CHANGE
(%Change) |
Day High |
Volume
(% DAV)
(% 50 day avg vol) |
52 Wk Hi
% From Hi |
Featured
Date |
Price
Featured |
Pivot Featured |
|
Max Buy |
CEVA
-
NASDAQ
Ceva Inc
ELECTRONICS - Semiconductor - Specialized
|
$30.59
|
-0.27
-0.87% |
$31.63
|
298,010
126.12% of 50 DAV
50 DAV is 236,300
|
$35.60
-14.07%
|
10/28/2011
|
$34.38
|
PP = $35.70
|
|
MB = $37.49
|
Most Recent Note - 11/16/2011 5:31:03 PM
Y - Traded up then reversed into the red today, still consolidating above prior highs since its gap up on 10/27/11 helped it break out of a "double bottom" base pattern. In the 10/28/11 mid-day report (read here) it was featured again in yellow with pivot point based on its 52-week high plus 10 cents while rallying from a larger cup shaped base. It has encountered distributional pressure since, while volume-driven gains above its pivot point are needed to trigger a new (or add-on) technical buy signal.
>>> The latest Featured Stock Update with an annotated graph appeared on 11/2/2011. Click here.
View all notes |
Alert me of new notes |
CANSLIM.net Company Profile |
SEC |
Zacks Reports |
StockTalk |
News |
Chart |
Request a new note
C
A N
S L
I M
|
FEIC
-
NASDAQ
F E I Co
ELECTRONICS - Diversified Electronics
|
$39.79
|
-1.47
-3.56% |
$41.78
|
361,617
82.77% of 50 DAV
50 DAV is 436,900
|
$42.25
-5.82%
|
10/28/2011
|
$40.31
|
PP = $40.88
|
|
MB = $42.92
|
Most Recent Note - 11/16/2011 5:32:52 PM
Y - Pulled back today on light volume and slumped back below its pivot point. Disciplined investors limit losses if a stock falls more than -7% from their purchase price.
>>> The latest Featured Stock Update with an annotated graph appeared on 10/28/2011. Click here.
View all notes |
Alert me of new notes |
CANSLIM.net Company Profile |
SEC |
Zacks Reports |
StockTalk |
News |
Chart |
Request a new note
C
A N
S L
I M
|
GNC
-
NYSE
G N C Holdings Inc
RETAIL - Drug Stores
|
$27.10
|
-0.07
-0.26% |
$27.99
|
2,884,818
224.62% of 50 DAV
50 DAV is 1,284,300
|
$27.33
-0.84%
|
10/26/2011
|
$24.60
|
PP = $24.80
|
|
MB = $26.04
|
Most Recent Note - 11/16/2011 5:34:22 PM
G - Hit another new 52-week high today then made a negative reversal for a loss on more than 2 times average volume. Completed a Secondary Offering on 10/15/11. Recent chart lows (near $23.80) define near term support to watch above its 50 DMA line.
>>> The latest Featured Stock Update with an annotated graph appeared on 10/26/2011. Click here.
View all notes |
Alert me of new notes |
CANSLIM.net Company Profile |
SEC |
Zacks Reports |
StockTalk |
News |
Chart |
Request a new note
C
A N
S L
I M
|
HMSY
-
NASDAQ
H M S Holdings Corp
COMPUTER SOFTWARE and SERVICES - Healthcare Information Service
|
$29.11
|
-0.86
-2.87% |
$29.89
|
674,672
99.42% of 50 DAV
50 DAV is 678,600
|
$31.99
-9.00%
|
10/27/2011
|
$26.44
|
PP = $28.37
|
|
MB = $29.79
|
Most Recent Note - 11/16/2011 5:36:11 PM
G - Today was its 3rd consecutive loss following a negative reversal on 11/14/11 after hitting a new all-time high. Prior highs in the $27-28 area define support to watch on pullbacks.
>>> The latest Featured Stock Update with an annotated graph appeared on 11/4/2011. Click here.
View all notes |
Alert me of new notes |
CANSLIM.net Company Profile |
SEC |
Zacks Reports |
StockTalk |
News |
Chart |
Request a new note
C
A N
S L
I M
|
ISRG
-
NASDAQ
Intuitive Surgical Inc
HEALTH SERVICES - Medical Appliances and Equipment
|
$438.46
|
-10.31
-2.30% |
$447.00
|
421,452
102.12% of 50 DAV
50 DAV is 412,700
|
$449.06
-2.36%
|
10/19/2011
|
$424.69
|
PP = $415.29
|
|
MB = $436.05
|
Most Recent Note - 11/16/2011 5:37:36 PM
G - Loss today on average volume following 4 consecutive gains on lighter volume. Volume totals have been cooling in recent weeks while holding its ground and rising. See the latest FSU analysis for more details and a new annotated weekly graph.
>>> The latest Featured Stock Update with an annotated graph appeared on 11/15/2011. Click here.
View all notes |
Alert me of new notes |
CANSLIM.net Company Profile |
SEC |
Zacks Reports |
StockTalk |
News |
Chart |
Request a new note
C
A N
S L
I M
|
Symbol/Exchange
Company Name
Industry Group |
PRICE |
CHANGE
(%Change) |
Day High |
Volume
(% DAV)
(% 50 day avg vol) |
52 Wk Hi
% From Hi |
Featured
Date |
Price
Featured |
Pivot Featured |
|
Max Buy |
MG
-
NYSE
Mistras Group Inc
DIVERSIFIED SERVICES - Bulding and Faci;ity Management Services
|
$22.50
|
-0.25
-1.10% |
$22.78
|
123,243
59.51% of 50 DAV
50 DAV is 207,100
|
$23.51
-4.30%
|
10/28/2011
|
$22.49
|
PP = $23.61
|
|
MB = $24.79
|
Most Recent Note - 11/16/2011 5:49:57 PM
Y - Small loss today on light volume following a solid gain today backed by above average volume. Perched within striking distance of all-time high. Its 50 DMA line and prior highs define chart support near $21.
>>> The latest Featured Stock Update with an annotated graph appeared on 11/11/2011. Click here.
View all notes |
Alert me of new notes |
CANSLIM.net Company Profile |
SEC |
Zacks Reports |
StockTalk |
News |
Chart |
Request a new note
C
A N
S L
I M
|
MKTX
-
NASDAQ
Marketaxess Holdings Inc
FINANCIAL SERVICES - Investment Brokerage - Nationa
|
$27.77
|
-1.04
-3.61% |
$28.58
|
191,814
79.23% of 50 DAV
50 DAV is 242,100
|
$31.45
-11.70%
|
10/28/2011
|
$29.79
|
PP = $31.05
|
|
MB = $32.60
|
Most Recent Note - 11/16/2011 6:16:18 PM
Y - Loss today has it testing support near its 50 DMA line. Its Relative Strength line did not lead the way as it hit recent new highs, it has slumped.
>>> The latest Featured Stock Update with an annotated graph appeared on 10/31/2011. Click here.
View all notes |
Alert me of new notes |
CANSLIM.net Company Profile |
SEC |
Zacks Reports |
StockTalk |
News |
Chart |
Request a new note
C
A N
S L
I M
|
OSIS
-
NASDAQ
O S I Systems Inc
ELECTRONICS - Semiconductor Equipment and Mate
|
$44.38
|
-2.16
-4.64% |
$46.43
|
157,122
105.88% of 50 DAV
50 DAV is 148,400
|
$47.39
-6.35%
|
11/1/2011
|
$42.07
|
PP = $45.57
|
|
MB = $47.85
|
Most Recent Note - 11/16/2011 5:58:57 PM
Y - Considerable loss today with higher (near average) volume was indicative of distributional pressure. Previously noted - "Lighter than average behind last week's gains, not indicative of great institutional (I criteria) buying demand. Volume-driven gains above its pivot point may trigger a technical buy signal."
>>> The latest Featured Stock Update with an annotated graph appeared on 11/1/2011. Click here.
View all notes |
Alert me of new notes |
CANSLIM.net Company Profile |
SEC |
Zacks Reports |
StockTalk |
News |
Chart |
Request a new note
C
A N
S L
I M
|
RAX
-
NYSE
Rackspace Hosting Inc
INTERNET - Internet Software and; Services
|
$42.67
|
-0.63
-1.45% |
$43.60
|
1,319,683
82.97% of 50 DAV
50 DAV is 1,590,600
|
$46.50
-8.23%
|
11/8/2011
|
$44.28
|
PP = $46.27
|
|
MB = $48.58
|
Most Recent Note - 11/16/2011 6:01:06 PM
Y - Consolidating -8.2% off its 52-week high after a 19-week cup shaped base pattern. Volume driven gains above its pivot point may trigger a technical buy signal.
>>> The latest Featured Stock Update with an annotated graph appeared on 11/10/2011. Click here.
View all notes |
Alert me of new notes |
CANSLIM.net Company Profile |
SEC |
Zacks Reports |
StockTalk |
News |
Chart |
Request a new note
C
A N
S L
I M
|
SWI
-
NYSE
Solarwinds Inc
COMPUTER SOFTWARE and SERVICES - Application Software
|
$31.31
|
+0.63
2.05% |
$31.69
|
1,528,564
130.40% of 50 DAV
50 DAV is 1,172,200
|
$31.49
-0.57%
|
10/27/2011
|
$27.78
|
PP = $25.62
|
|
MB = $26.90
|
Most Recent Note - 11/16/2011 6:02:16 PM
G - Up today with above average volume for a best-ever close. It is extended from its previous base pattern. Prior highs in the $25-26 area define initial chart support to watch on pullbacks.
>>> The latest Featured Stock Update with an annotated graph appeared on 10/27/2011. Click here.
View all notes |
Alert me of new notes |
CANSLIM.net Company Profile |
SEC |
Zacks Reports |
StockTalk |
News |
Chart |
Request a new note
C
A N
S L
I M
|
Symbol/Exchange
Company Name
Industry Group |
PRICE |
CHANGE
(%Change) |
Day High |
Volume
(% DAV)
(% 50 day avg vol) |
52 Wk Hi
% From Hi |
Featured
Date |
Price
Featured |
Pivot Featured |
|
Max Buy |
TDG
-
NYSE
Transdigm Group Inc
AEROSPACE/DEFENSE - Aerospace/Defense Products and; Services
|
$97.12
|
-1.28
-1.30% |
$98.51
|
376,837
91.24% of 50 DAV
50 DAV is 413,000
|
$99.70
-2.59%
|
11/9/2011
|
$98.45
|
PP = $95.14
|
|
MB = $99.90
|
Most Recent Note - 11/16/2011 6:03:45 PM
Y - Still hovering near its 52-week high today, holding its ground above its pivot point but below its "max buy" level. A volume-driven gain on 11/08/11 helped it break out from a 19-week base. Due to report earnings on Thursday, November 17th for the quarter ended September 30, 2011.
>>> The latest Featured Stock Update with an annotated graph appeared on 11/9/2011. Click here.
View all notes |
Alert me of new notes |
CANSLIM.net Company Profile |
SEC |
Zacks Reports |
StockTalk |
News |
Chart |
Request a new note
C
A N
S L
I M
|
UA
-
NYSE
Under Armour Inc Cl A
CONSUMER NON-DURABLES - Textile - Apparel Clothing
|
$80.85
|
-2.43
-2.92% |
$83.42
|
543,816
40.94% of 50 DAV
50 DAV is 1,328,400
|
$87.40
-7.49%
|
10/25/2011
|
$82.43
|
PP = $80.80
|
|
MB = $84.84
|
Most Recent Note - 11/16/2011 6:04:54 PM
Y - Quietly consolidating just above its pivot point and below its "max buy" level. No resistance remains due to overhead supply following its recent spurt of volume-driven gains. Prior highs near $80 define initial support above its 50 DMA line.
>>> The latest Featured Stock Update with an annotated graph appeared on 11/3/2011. Click here.
View all notes |
Alert me of new notes |
CANSLIM.net Company Profile |
SEC |
Zacks Reports |
StockTalk |
News |
Chart |
Request a new note
C
A N
S L
I M
|
V
-
NYSE
Visa Inc Cl A
DIVERSIFIED SERVICES - Business/Management Services
|
$93.40
|
-2.01
-2.11% |
$95.00
|
3,249,841
61.26% of 50 DAV
50 DAV is 5,305,100
|
$95.87
-2.58%
|
10/24/2011
|
$94.21
|
PP = $94.85
|
|
MB = $99.59
|
Most Recent Note - 11/16/2011 6:14:30 PM
Y - Small loss today with light volume, slumping back below its pivot point. Perched within close striking distance of its 52-week high, yet it did not trigger a proper new technical buy signal since recently highlighted in yellow as an ideal looking set-up. A volume-driven gain to new highs would be a reassuring sign of institutional buying demand. Meanwhile, its 50 DMA line defines near-term chart support to watch.
>>> The latest Featured Stock Update with an annotated graph appeared on 10/24/2011. Click here.
View all notes |
Alert me of new notes |
CANSLIM.net Company Profile |
SEC |
Zacks Reports |
StockTalk |
News |
Chart |
Request a new note
C
A N
S L
I M
|
|
|
|
THESE ARE NOT BUY RECOMMENDATIONS!
Comments contained in the body of this report are technical
opinions only. The material herein has been obtained
from sources believed to be reliable and accurate, however,
its accuracy and completeness cannot be guaranteed.
This site is not an investment advisor, hence it does
not endorse or recommend any securities or other investments.
Any recommendation contained in this report may not
be suitable for all investors and it is not to be deemed
an offer or solicitation on our part with respect to
the purchase or sale of any securities. All trademarks,
service marks and trade names appearing in this report
are the property of their respective owners, and are
likewise used for identification purposes only.
This report is a service available
only to active Paid Premium Members.
You may opt-out of receiving report notifications
at any time. Questions or comments may be submitted
by writing to Premium Membership Services 665 S.E. 10 Street, Suite 201 Deerfield Beach, FL 33441-5634 or by calling 1-800-965-8307
or 954-785-1121.
|
|
|

