You are not logged in.
This means you
CAN ONLY VIEW reports that were published prior to Wednesday, April 30, 2025.
You
MUST UPGRADE YOUR MEMBERSHIP if you want to see any current reports.
AFTER MARKET UPDATE - TUESDAY, NOVEMBER 15TH, 2011
Previous After Market Report Next After Market Report >>>
|
|
|
|
DOW |
+17.18 |
12,096.16 |
+0.14% |
|
Volume |
781,029,070 |
+10% |
|
Volume |
1,641,124,000 |
+21% |
|
NASDAQ |
+28.98 |
2,686.20 |
+1.09% |
|
Advancers |
1,895 |
61% |
|
Advancers |
1,712 |
65% |
|
S&P 500 |
+6.03 |
1,257.81 |
+0.48% |
|
Decliners |
1,113 |
36% |
|
Decliners |
830 |
31% |
|
Russell 2000 |
+10.19 |
743.08 |
+1.39% |
|
52 Wk Highs |
52 |
|
|
52 Wk Highs |
44 |
|
|
S&P 600 |
+5.55 |
411.26 |
+1.37% |
|
52 Wk Lows |
27 |
|
|
52 Wk Lows |
73 |
|
|
 |
Indices Rise With Better But Still Below Average Volume
Kenneth J. Gruneisen - Passed the CAN SLIM® Master's Exam
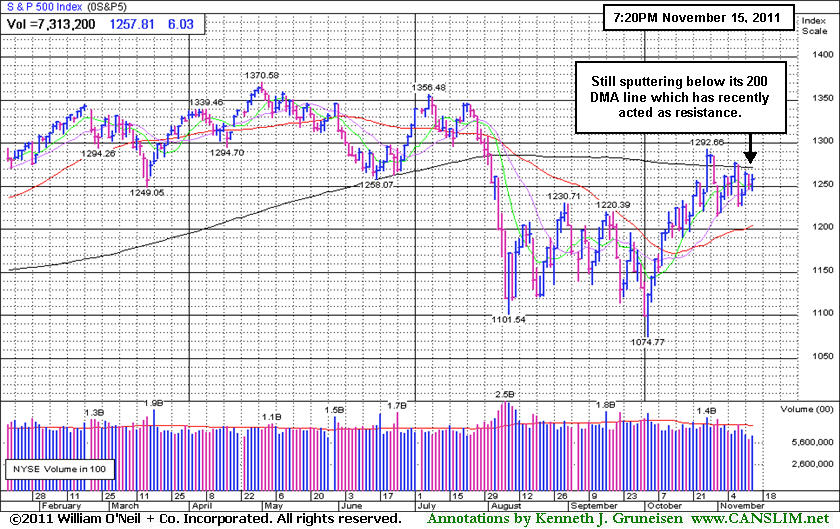
The major averages managed to finish in the green after a volatile trading day. The reported volume totals were slightly higher on both major exchanges. Advancing issues outnumbered declining issues by about 3-2 on the NYSE and 2-1 on the Nasdaq exchange. New 52-week lows still outnumbered new 52-week highs on the Nasdaq exchange, however new 52-week highs outnumbered new 52-week lows on the NYSE for a third consecutive session. There were 38 high-ranked companies from the CANSLIM.net Leaders List that made new 52-week highs and appeared on the CANSLIM.net BreakOuts Page, up from the prior session total of 28 stocks. There were gains for 15 of the 18 high-ranked companies currently included on the Featured Stocks Page.
Stocks fluctuated early on as investors weighed concerns about rising European bond yields against a handful of encouraging economic data reports. Inflation readings were better-than-expected. Retail sales increased 0.5% versus a consensus estimate of a 0.3% boost and a 1.1% rise in September. A gauge of manufacturing in New York rose in November, ending five straight months of contraction. U.S. business inventories remained flat in September. Later in the session, stocks were buoyed by reports that Italian Prime Minister Mario Monti will meet Italy's President to form the nation's next new government.
Technology stocks helped lead the advance. Intel Corp (INTC +2.88%) rose after Warren Buffet said his firm invested in the company, which spurred a rally in semiconductors. Among earnings, Wal-Mart Stores Inc (WMT -2.43%) tumbled after narrowly missing profit expectations. The Home Depot Inc (HD -0.47%) inched lower despite beating earnings estimates and raising its dividend and outlook. Staples Inc (SPLS -3.64%) fell after reporting lower-than-expected sales and slashing its profit forecast.
Our monthly newsletter CANSLIM.net News will be published soon with an informative review of current market conditions, leading groups, and best buy candidates. Via the Premium Member Homepage links to all prior reports and webcasts are always available.
PICTURED: The S&P 500 Index is still sputtering below its 200-day moving average (DMA) line which has recently acted as resistance.
|
 Kenneth J. Gruneisen started out as a licensed stockbroker in August 1987, a couple of months prior to the historic stock market crash that took the Dow Jones Industrial Average down -22.6% in a single day. He has published daily fact-based fundamental and technical analysis on high-ranked stocks online for two decades. Through FACTBASEDINVESTING.COM, Kenneth provides educational articles, news, market commentary, and other information regarding proven investment systems that work in good times and bad.
Comments contained in the body of this report are technical opinions only and are not necessarily those of Gruneisen Growth Corp. The material herein has been obtained from sources believed to be reliable and accurate, however, its accuracy and completeness cannot be guaranteed. Our firm, employees, and customers may effect transactions, including transactions contrary to any recommendation herein, or have positions in the securities mentioned herein or options with respect thereto. Any recommendation contained in this report may not be suitable for all investors and it is not to be deemed an offer or solicitation on our part with respect to the purchase or sale of any securities. |
|
 |
Tech Sector Led Broader Market
Kenneth J. Gruneisen - Passed the CAN SLIM® Master's Exam
The tech sector helped lead the market higher on Tuesday as the Networking Index ($NWX +0.82%), Internet Index ($IIX +1.02%), and Semiconductor Index ($SOX +1.47%) posted gains, meanwhile the Biotechnology Index ($BTK -0.31%) lagged and the Retail Index ($RLX +0.00%) finished flat. Commodity-linked groups were quiet as the Integrated Oil Index ($XOI -0.26%) and Oil Services Index ($OSX +0.27%) were mixed and little changed and the Gold & Silver Index ($XAU +0.09%) ended barely above unchanged. The Healthcare Index ($HMO +0.38%) posted a small gain and the Broker/Dealer Index ($XBD +0.14%) and Bank Index ($BKX +0.49%) also edged higher.
Charts courtesy www.stockcharts.com
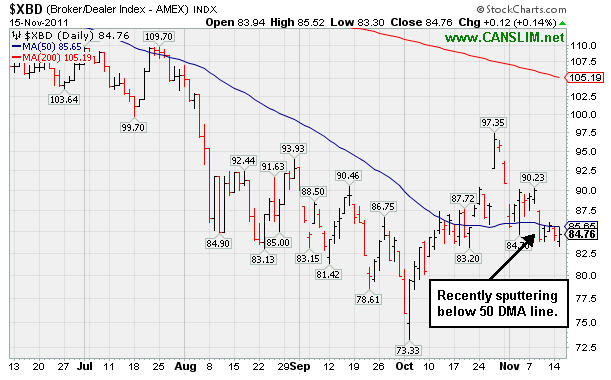
PICTURED: The Broker/Dealer Index ($XBD +0.14%) has been recently sputtering below its 50-day moving average line.
| Oil Services |
$OSX |
234.78 |
+0.64 |
+0.27% |
-4.22% |
| Healthcare |
$HMO |
2,276.69 |
+8.51 |
+0.38% |
+34.56% |
| Integrated Oil |
$XOI |
1,234.40 |
-3.18 |
-0.26% |
+1.75% |
| Semiconductor |
$SOX |
392.23 |
+5.67 |
+1.47% |
-4.76% |
| Networking |
$NWX |
242.10 |
+1.96 |
+0.82% |
-13.71% |
| Internet |
$IIX |
301.08 |
+3.04 |
+1.02% |
-2.16% |
| Broker/Dealer |
$XBD |
84.76 |
+0.12 |
+0.14% |
-30.25% |
| Retail |
$RLX |
547.08 |
+0.02 |
+0.00% |
+7.61% |
| Gold & Silver |
$XAU |
209.27 |
+0.18 |
+0.09% |
-7.64% |
| Bank |
$BKX |
38.76 |
+0.19 |
+0.49% |
-25.76% |
| Biotech |
$BTK |
1,079.64 |
-3.37 |
-0.31% |
-16.80% |
|
|
|
 |
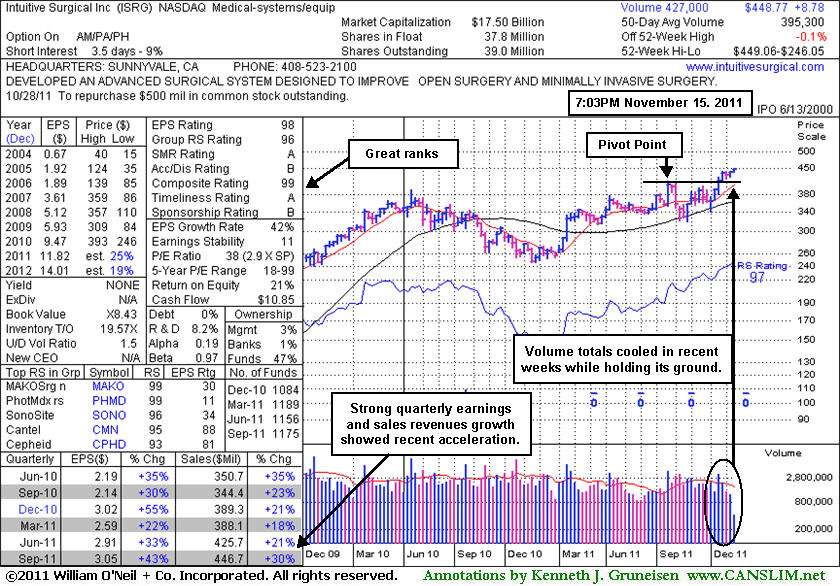
Volume Totals Cooling Following Recent Breakout
Kenneth J. Gruneisen - Passed the CAN SLIM® Master's Exam
Intuitive Surgical Inc (ISRG +$8.29 or +1.88% to $448.77) inched to a new all-time high today with its 4th consecutive gain backed by light volume. No resistance from overhead supply remains. Prior highs define important support to watch on pullbacks. Its last appearance in this FSU section was on 10/18/11 with an annotated graph included under the headline, "Breakaway Gap Triggered Fresh Technical Buy Signal." The breakaway gap for a new 52-week and all-time high was backed my more than 3 times average volume, triggering a technical buy signal. Its powerful rally to new high territory was recognized as a fresh and reassuring sign of institutional accumulation (the investment system's I criteria). That report also stated - "Some investors may dismiss such a 'high-priced' stock as if it lacks the potential to produce big gains, but experienced investors and institutional investors know that the price of the shares has no bearing on their upside potential. More often, higher priced stocks are actually superior buy candidates, and the market has priced the companies' shares at highs for legitimate reasons, not by accident."
It reported earnings +43% on +30% sales revenues for the quarter ended September 30, 2011 versus the year ago period. Accelerating sales revenues and earnings increases in recent quarterly comparisons are a reassuring sign, and it has a great annual earnings (A criteria) history. This company's small supply (S criteria) of only 39 million shares outstanding can lead to greater volatility in the event of any abrupt institutional buying or selling. The number of top-rated funds owning its shares increased from 1,156 in Jun '11 to 1,175 in Sep '11. Its annual earnings history (the A criteria) has been very impressive.
An earlier appearance in this FSU section was on 5/03/10 with an annotated graph included under the headline, "Sales Revenues And Earnings Showed Acceleration In Latest Quarter". That report stated - "Subsequent violations of its recent chart low or 50-day moving average (DMA) line could raise more serious concerns and trigger sell signals." Soon afterward those violations occurred, and based on the weak action it was dropped from the Featured Stocks list on 5/07/10. It went through a long deep consolidation before rebounding impressively. It has continued to show impressive sales revenues and earnings growth. Long time members may recall that ISRG was first featured in yellow in CANSLIM.net reports in the summer of 2004 and it traded up more than 13-fold within a three and a half year time span after that initial appearance as a noteworthy buy candidate.
|
|
|
Color Codes Explained :
Y - Better candidates highlighted by our
staff of experts.
G - Previously featured
in past reports as yellow but may no longer be buyable under the
guidelines.
***Last / Change / Volume data in this table is the closing quote data***
Symbol/Exchange
Company Name
Industry Group |
PRICE |
CHANGE
(%Change) |
Day High |
Volume
(% DAV)
(% 50 day avg vol) |
52 Wk Hi
% From Hi |
Featured
Date |
Price
Featured |
Pivot Featured |
|
Max Buy |
AAPL
-
NASDAQ
Apple Inc
COMPUTER HARDWARE - Personal Computers
|
$388.83
|
+9.57
2.52% |
$389.50
|
15,389,590
75.67% of 50 DAV
50 DAV is 20,337,600
|
$426.70
-8.88%
|
9/16/2011
|
$399.14
|
PP = $404.60
|
|
MB = $424.83
|
Most Recent Note - 11/11/2011 3:29:29 PM
G - Slumping below its 50 DMA line and raising concerns with a 3rd consecutive loss. Gains in recent weeks lacked volume conviction while it has endured distributional pressure. Its 200 DMA line defines the next important chart support to watch.
>>> The latest Featured Stock Update with an annotated graph appeared on 10/20/2011. Click here.
View all notes |
Alert me of new notes |
CANSLIM.net Company Profile |
SEC |
Zacks Reports |
StockTalk |
News |
Chart |
Request a new note
C
A N
S L
I M


|
ADS
-
NYSE
Alliance Data Sys Corp
COMPUTER SOFTWARE and SERVICES - Information and Delivery Service
|
$101.35
|
-0.16
-0.16% |
$102.09
|
680,883
71.68% of 50 DAV
50 DAV is 949,900
|
$107.18
-5.44%
|
10/21/2011
|
$97.94
|
PP = $101.15
|
|
MB = $106.21
|
Most Recent Note - 11/11/2011 3:31:48 PM
Y - Volume totals have been cooling while consolidating near its pivot point in recent weeks. Prior chart highs in the $101 define support to watch well above its 50 DMA line.
>>> The latest Featured Stock Update with an annotated graph appeared on 10/21/2011. Click here.
View all notes |
Alert me of new notes |
CANSLIM.net Company Profile |
SEC |
Zacks Reports |
StockTalk |
News |
Chart |
Request a new note
C
A N
S L
I M
|
ALXN
-
NASDAQ
Alexion Pharmaceuticals
DRUGS - Drug Manufacturers - Other
|
$67.32
|
+0.51
0.76% |
$67.70
|
1,822,970
119.83% of 50 DAV
50 DAV is 1,521,300
|
$70.42
-4.40%
|
9/15/2011
|
$63.20
|
PP = $60.81
|
|
MB = $63.85
|
Most Recent Note - 11/14/2011 5:37:07 PM
Y - Posted a solid gain today with higher volume, finding support near its 50 DMA line. Color code is changed to yellow however a new pivot point is not being cited. See latest FSU analysis for more details and a new annotated daily graph.
>>> The latest Featured Stock Update with an annotated graph appeared on 11/14/2011. Click here.
View all notes |
Alert me of new notes |
CANSLIM.net Company Profile |
SEC |
Zacks Reports |
StockTalk |
News |
Chart |
Request a new note
C
A N
S L
I M
|
CATM
-
NASDAQ
Cardtronics Inc
DIVERSIFIED SERVICES - Business/Management Services
|
$26.54
|
+0.17
0.64% |
$26.62
|
298,623
70.81% of 50 DAV
50 DAV is 421,700
|
$28.46
-6.75%
|
11/8/2011
|
$25.99
|
PP = $25.95
|
|
MB = $27.25
|
Most Recent Note - 11/11/2011 1:55:14 PM
Y - Poised to possibly finish the week with its best ever close if the quiet gap up gain today holds up. Prior highs in the $26 area acted as support following its 11/08/11 breakout. See the latest FSU analysis for more details and an annotated graph.
>>> The latest Featured Stock Update with an annotated graph appeared on 11/8/2011. Click here.
View all notes |
Alert me of new notes |
CANSLIM.net Company Profile |
SEC |
Zacks Reports |
StockTalk |
News |
Chart |
Request a new note
C
A N
S L
I M
|
CELG
-
NASDAQ
Celgene Corp
DRUGS - Drug Manufacturers - Major
|
$65.41
|
+0.39
0.60% |
$65.76
|
2,478,481
64.52% of 50 DAV
50 DAV is 3,841,700
|
$68.25
-4.16%
|
9/16/2011
|
$61.21
|
PP = $62.59
|
|
MB = $65.72
|
Most Recent Note - 11/11/2011 12:37:56 PM
Y -Still consolidating just above its 50 DMA line defining important near-term chart support. A violation of its short-term average and recent chart low ($62.71 on 11/01/11) would raise concerns and trigger technical sell signals.
>>> The latest Featured Stock Update with an annotated graph appeared on 11/7/2011. Click here.
View all notes |
Alert me of new notes |
CANSLIM.net Company Profile |
SEC |
Zacks Reports |
StockTalk |
News |
Chart |
Request a new note
C
A N
S L
I M
|
Symbol/Exchange
Company Name
Industry Group |
PRICE |
CHANGE
(%Change) |
Day High |
Volume
(% DAV)
(% 50 day avg vol) |
52 Wk Hi
% From Hi |
Featured
Date |
Price
Featured |
Pivot Featured |
|
Max Buy |
CEVA
-
NASDAQ
Ceva Inc
ELECTRONICS - Semiconductor - Specialized
|
$30.86
|
+1.19
4.01% |
$30.89
|
183,826
77.79% of 50 DAV
50 DAV is 236,300
|
$35.60
-13.31%
|
10/28/2011
|
$34.38
|
PP = $35.70
|
|
MB = $37.49
|
 Most Recent Note - 11/15/2011 2:55:24 PM
Y - Up today, still consolidating above prior highs since its gap up on 10/27/11 helped it break out of a "double bottom" base pattern. In the 10/28/11 mid-day report (read here) it was featured again in yellow with pivot point based on its 52-week high plus 10 cents while rallying from a larger cup shaped base. It has encountered distributional pressure since, while volume-driven gains above its pivot point are needed to trigger a new (or add-on) technical buy signal.
>>> The latest Featured Stock Update with an annotated graph appeared on 11/2/2011. Click here.
View all notes |
Alert me of new notes |
CANSLIM.net Company Profile |
SEC |
Zacks Reports |
StockTalk |
News |
Chart |
Request a new note
C
A N
S L
I M
|
FEIC
-
NASDAQ
F E I Co
ELECTRONICS - Diversified Electronics
|
$41.26
|
+1.83
4.64% |
$41.45
|
350,981
80.33% of 50 DAV
50 DAV is 436,900
|
$42.25
-2.34%
|
10/28/2011
|
$40.31
|
PP = $40.88
|
|
MB = $42.92
|
Most Recent Note - 11/15/2011 2:58:46 PM
Y - Up today, perched within close striking distance of a best ever close and very near its pivot point. Disciplined investors limit losses if a stock falls more than -7% from their purchase price.
>>> The latest Featured Stock Update with an annotated graph appeared on 10/28/2011. Click here.
View all notes |
Alert me of new notes |
CANSLIM.net Company Profile |
SEC |
Zacks Reports |
StockTalk |
News |
Chart |
Request a new note
C
A N
S L
I M
|
GNC
-
NYSE
G N C Holdings Inc
RETAIL - Drug Stores
|
$27.17
|
+0.21
0.78% |
$27.33
|
1,004,959
78.25% of 50 DAV
50 DAV is 1,284,300
|
$27.13
0.15%
|
10/26/2011
|
$24.60
|
PP = $24.80
|
|
MB = $26.04
|
Most Recent Note - 11/11/2011 2:02:43 PM
G - Rallying above its "max buy" level today. Cooling volume totals have been noted as an indication that few are rushing for the exits following the recent Secondary Offering completed on 10/15/11. Recent chart lows (near $23.80) define near term support to watch above its 50 DMA line.
>>> The latest Featured Stock Update with an annotated graph appeared on 10/26/2011. Click here.
View all notes |
Alert me of new notes |
CANSLIM.net Company Profile |
SEC |
Zacks Reports |
StockTalk |
News |
Chart |
Request a new note
C
A N
S L
I M
|
HMSY
-
NASDAQ
H M S Holdings Corp
COMPUTER SOFTWARE and SERVICES - Healthcare Information Service
|
$29.97
|
-0.47
-1.54% |
$30.43
|
633,238
93.32% of 50 DAV
50 DAV is 678,600
|
$31.99
-6.31%
|
10/27/2011
|
$26.44
|
PP = $28.37
|
|
MB = $29.79
|
Most Recent Note - 11/11/2011 2:04:23 PM
G - Small gap up today has it poised for a possible best-ever close. Prior highs in the $27-28 area define support to watch on pullbacks.
>>> The latest Featured Stock Update with an annotated graph appeared on 11/4/2011. Click here.
View all notes |
Alert me of new notes |
CANSLIM.net Company Profile |
SEC |
Zacks Reports |
StockTalk |
News |
Chart |
Request a new note
C
A N
S L
I M
|
ISRG
-
NASDAQ
Intuitive Surgical Inc
HEALTH SERVICES - Medical Appliances and Equipment
|
$448.77
|
+8.29
1.88% |
$449.06
|
224,421
54.38% of 50 DAV
50 DAV is 412,700
|
$447.50
0.28%
|
10/19/2011
|
$424.69
|
PP = $415.29
|
|
MB = $436.05
|
Most Recent Note - 11/15/2011 7:12:32 PM
G - Posted a 4th consecutive gain today on light volume. Volume totals have been cooling in recent weeks while holding its ground and rising. See the latest FSU analysis for more details and a new annotated weekly graph.
>>> The latest Featured Stock Update with an annotated graph appeared on 11/15/2011. Click here.
View all notes |
Alert me of new notes |
CANSLIM.net Company Profile |
SEC |
Zacks Reports |
StockTalk |
News |
Chart |
Request a new note
C
A N
S L
I M
|
Symbol/Exchange
Company Name
Industry Group |
PRICE |
CHANGE
(%Change) |
Day High |
Volume
(% DAV)
(% 50 day avg vol) |
52 Wk Hi
% From Hi |
Featured
Date |
Price
Featured |
Pivot Featured |
|
Max Buy |
MG
-
NYSE
Mistras Group Inc
DIVERSIFIED SERVICES - Bulding and Faci;ity Management Services
|
$22.75
|
+1.02
4.69% |
$23.00
|
239,505
115.65% of 50 DAV
50 DAV is 207,100
|
$23.51
-3.23%
|
10/28/2011
|
$22.49
|
PP = $23.61
|
|
MB = $24.79
|
Most Recent Note - 11/15/2011 2:53:31 PM
Y - Solid gain today backed by above average volume has it perched within striking distance of a best-ever close. Volume totals have been cooling while consolidating above its 50 DMA line and prior highs defining chart support near $21. See the latest FSU analysis for more details and a new annotated weekly graph.
>>> The latest Featured Stock Update with an annotated graph appeared on 11/11/2011. Click here.
View all notes |
Alert me of new notes |
CANSLIM.net Company Profile |
SEC |
Zacks Reports |
StockTalk |
News |
Chart |
Request a new note
C
A N
S L
I M
|
MKTX
-
NASDAQ
Marketaxess Holdings Inc
FINANCIAL SERVICES - Investment Brokerage - Nationa
|
$28.81
|
+0.72
2.56% |
$29.05
|
118,725
49.04% of 50 DAV
50 DAV is 242,100
|
$31.45
-8.39%
|
10/28/2011
|
$29.79
|
PP = $31.05
|
|
MB = $32.60
|
Most Recent Note - 11/11/2011 3:37:37 PM
Y - With quiet volume behind today's gain it is holding its ground near its 50 DMA line. Its Relative Strength line did not lead the way as it hit recent new highs, it has slumped.
>>> The latest Featured Stock Update with an annotated graph appeared on 10/31/2011. Click here.
View all notes |
Alert me of new notes |
CANSLIM.net Company Profile |
SEC |
Zacks Reports |
StockTalk |
News |
Chart |
Request a new note
C
A N
S L
I M
|
OSIS
-
NASDAQ
O S I Systems Inc
ELECTRONICS - Semiconductor Equipment and Mate
|
$46.54
|
+0.59
1.28% |
$46.82
|
93,454
62.97% of 50 DAV
50 DAV is 148,400
|
$47.39
-1.79%
|
11/1/2011
|
$42.07
|
PP = $45.57
|
|
MB = $47.85
|
Most Recent Note - 11/11/2011 4:41:37 PM
Y - Small gain on light volume today finishing -2.1% off its new 52-week high (N criteria) touched earlier this week with gains lacking great volume. Previously noted - "Lighter than average behind last week's gains, not indicative of great institutional (I criteria) buying demand. Volume-driven gains above its pivot point may trigger a technical buy signal."
>>> The latest Featured Stock Update with an annotated graph appeared on 11/1/2011. Click here.
View all notes |
Alert me of new notes |
CANSLIM.net Company Profile |
SEC |
Zacks Reports |
StockTalk |
News |
Chart |
Request a new note
C
A N
S L
I M
|
RAX
-
NYSE
Rackspace Hosting Inc
INTERNET - Internet Software and; Services
|
$43.30
|
+1.06
2.51% |
$43.53
|
1,457,052
91.60% of 50 DAV
50 DAV is 1,590,600
|
$46.50
-6.87%
|
11/8/2011
|
$44.28
|
PP = $46.27
|
|
MB = $48.58
|
Most Recent Note - 11/11/2011 3:39:18 PM
Y - Still working on the right side of a 19-week cup shaped base pattern. See the latest FSU analysis for more details and an annotated weekly graph.
>>> The latest Featured Stock Update with an annotated graph appeared on 11/10/2011. Click here.
View all notes |
Alert me of new notes |
CANSLIM.net Company Profile |
SEC |
Zacks Reports |
StockTalk |
News |
Chart |
Request a new note
C
A N
S L
I M
|
SWI
-
NYSE
Solarwinds Inc
COMPUTER SOFTWARE and SERVICES - Application Software
|
$30.68
|
-0.19
-0.62% |
$31.00
|
1,476,959
126.00% of 50 DAV
50 DAV is 1,172,200
|
$31.49
-2.57%
|
10/27/2011
|
$27.78
|
PP = $25.62
|
|
MB = $26.90
|
Most Recent Note - 11/11/2011 4:31:37 PM
G - Small gap up today for an 8th consecutive gain into new high territory. It is extended from its previous base pattern. Prior highs in the $25-26 area define initial chart support to watch on pullbacks.
>>> The latest Featured Stock Update with an annotated graph appeared on 10/27/2011. Click here.
View all notes |
Alert me of new notes |
CANSLIM.net Company Profile |
SEC |
Zacks Reports |
StockTalk |
News |
Chart |
Request a new note
C
A N
S L
I M
|
Symbol/Exchange
Company Name
Industry Group |
PRICE |
CHANGE
(%Change) |
Day High |
Volume
(% DAV)
(% 50 day avg vol) |
52 Wk Hi
% From Hi |
Featured
Date |
Price
Featured |
Pivot Featured |
|
Max Buy |
TDG
-
NYSE
Transdigm Group Inc
AEROSPACE/DEFENSE - Aerospace/Defense Products and; Services
|
$98.40
|
+0.98
1.01% |
$98.82
|
438,530
106.18% of 50 DAV
50 DAV is 413,000
|
$98.93
-0.54%
|
11/9/2011
|
$98.45
|
PP = $95.14
|
|
MB = $99.90
|
Most Recent Note - 11/11/2011 4:35:05 PM
Y - Hovering near its 52-week high today. A volume-driven gain on 11/08/11 helped it break out from a 19-week base. Due to report earnings on Thursday, November 17th for the quarter ended September 30, 2011. See the latest FSU analysis for more details and a new annotated graph.
>>> The latest Featured Stock Update with an annotated graph appeared on 11/9/2011. Click here.
View all notes |
Alert me of new notes |
CANSLIM.net Company Profile |
SEC |
Zacks Reports |
StockTalk |
News |
Chart |
Request a new note
C
A N
S L
I M
|
UA
-
NYSE
Under Armour Inc Cl A
CONSUMER NON-DURABLES - Textile - Apparel Clothing
|
$83.28
|
+0.33
0.40% |
$83.81
|
796,018
59.92% of 50 DAV
50 DAV is 1,328,400
|
$87.40
-4.71%
|
10/25/2011
|
$82.43
|
PP = $80.80
|
|
MB = $84.84
|
Most Recent Note - 11/11/2011 2:09:33 PM
Y - Rising with light volume today, still consolidating above its pivot point and below its "max buy" level. No resistance remains due to overhead supply following its recent spurt of volume-driven gains. Prior highs near $80 define initial support above its 50 DMA line.
>>> The latest Featured Stock Update with an annotated graph appeared on 11/3/2011. Click here.
View all notes |
Alert me of new notes |
CANSLIM.net Company Profile |
SEC |
Zacks Reports |
StockTalk |
News |
Chart |
Request a new note
C
A N
S L
I M
|
V
-
NYSE
Visa Inc Cl A
DIVERSIFIED SERVICES - Business/Management Services
|
$95.63
|
+1.81
1.93% |
$95.82
|
3,538,237
66.70% of 50 DAV
50 DAV is 5,305,100
|
$95.87
-0.25%
|
10/24/2011
|
$94.21
|
PP = $94.85
|
|
MB = $99.59
|
Most Recent Note - 11/11/2011 2:13:05 PM
Y - Today's gain with light volume has it inching above its pivot point and poised for possibly its best close ever. Perched within close striking distance of its 52-week high, yet it did not trigger a proper new technical buy signal since recently highlighted in yellow as an ideal looking set-up. A volume-driven gain to new highs would be a reassuring sign of institutional buying demand. Meanwhile, its 50 DMA line defines near-term chart support to watch.
>>> The latest Featured Stock Update with an annotated graph appeared on 10/24/2011. Click here.
View all notes |
Alert me of new notes |
CANSLIM.net Company Profile |
SEC |
Zacks Reports |
StockTalk |
News |
Chart |
Request a new note
C
A N
S L
I M
|
|
|
|
THESE ARE NOT BUY RECOMMENDATIONS!
Comments contained in the body of this report are technical
opinions only. The material herein has been obtained
from sources believed to be reliable and accurate, however,
its accuracy and completeness cannot be guaranteed.
This site is not an investment advisor, hence it does
not endorse or recommend any securities or other investments.
Any recommendation contained in this report may not
be suitable for all investors and it is not to be deemed
an offer or solicitation on our part with respect to
the purchase or sale of any securities. All trademarks,
service marks and trade names appearing in this report
are the property of their respective owners, and are
likewise used for identification purposes only.
This report is a service available
only to active Paid Premium Members.
You may opt-out of receiving report notifications
at any time. Questions or comments may be submitted
by writing to Premium Membership Services 665 S.E. 10 Street, Suite 201 Deerfield Beach, FL 33441-5634 or by calling 1-800-965-8307
or 954-785-1121.
|
|
|

