You are not logged in.
This means you
CAN ONLY VIEW reports that were published prior to Monday, February 26, 2024.
You
MUST UPGRADE YOUR MEMBERSHIP if you want to see any current reports.
AFTER MARKET UPDATE - MONDAY, NOVEMBER 11TH, 2019
Previous After Market Report Next After Market Report >>>
|
|
|
|
DOW |
+10.25 |
27,691.49 |
+0.04% |
|
Volume |
760,272,700 |
-8% |
|
Volume |
1,706,330,910 |
-14% |
|
NASDAQ |
-11.03 |
8,464.28 |
-0.13% |
|
Advancers |
1,267 |
45% |
|
Advancers |
1,417 |
46% |
|
S&P 500 |
-6.07 |
3,087.01 |
-0.20% |
|
Decliners |
1,578 |
55% |
|
Decliners |
1,656 |
54% |
|
Russell 2000 |
-4.09 |
1,594.77 |
-0.26% |
|
52 Wk Highs |
92 |
|
|
52 Wk Highs |
91 |
|
|
S&P 600 |
-2.94 |
985.62 |
-0.30% |
|
52 Wk Lows |
52 |
|
|
52 Wk Lows |
95 |
|
|
 |
Major Indices Were Little Changed and Remain Near Record Highs
Kenneth J. Gruneisen - Passed the CAN SLIM® Master's Exam
The Dow gained 10 points closing at a record high, while the S&P 500 lost 0.2%. The Nasdaq Composite ticked down 0.1%. Decliners led advancers by a 5-4 margin on the NYSE and 8-7 on the Nasdaq exchange. Volume totals reported were lighter than the prior session on both major exchanges. There were 44 high-ranked companies from the Leaders List that hit a new 52-week high and were listed on the BreakOuts Page, versus the total of 33 on the prior session. New 52-week highs totals solidly outnumbered new 52-week lows totals on the NYSE but new lows slightly outnumbered new highs on the Nasdaq exchange. The major indices (M criteria) are in a "confirmed uptrend" after enduring distributional pressure in recent weeks. The Featured Stocks Page provides the most timely analysis on high-ranked leaders. Charts used courtesy of www.stockcharts.com
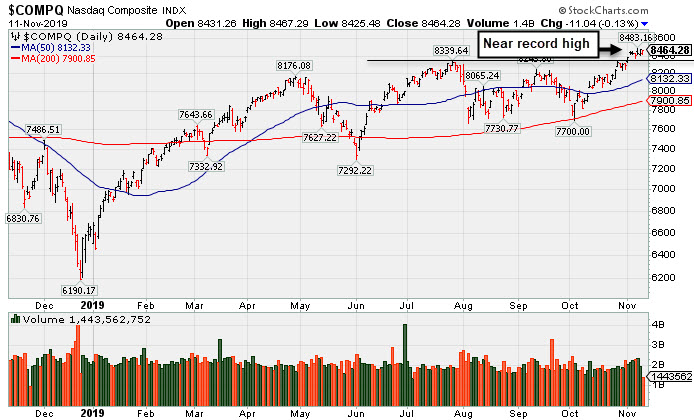
PICTURED: The Nasdaq Composite Index is hovering near its record high.
U.S. equities finished the day mixed as investors weighed U.S.-China trade developments and escalating tensions in Hong Kong. Over the weekend President Trump commented that negotiations with China are moving along “very nicely,” but made clear that an agreement has not been reached and tariffs would not be eliminated. A violent turn of protests in Hong Kong further promoted a perceived “risk-off” mood around the globe. Today’s mixed session follows a record setting week on Wall Street, in which the Dow and S&P 500 both topped all-time highs and recorded their fifth straight weekly advance, the longest such streak since February. There were no notable economic data releases today, and bond markets were closed in observance of the Veteran’s Day holiday.
Eight of 11 S&P 500 sectors finished the session in negative territory with the Real Estate and Industrial sectors advancing. In corporate news, Boeing (BA +4.55%) rose after announcing that it expects to resume deliveries of the 737 MAX in December, as well as resume commercial flights in January 2020. Alibaba (BABA -0.24%) ended the day essentially flat, despite the Chinese e-commerce giant breaking the record for sales figure during its “Singles’ Day” event. Shares of Walgreens Boots Alliance (WBA +5.08%) rose amid news private equity firm KKR formally offered to take the pharmacy retail giant private. Shares of Tesla (TSLA +2.36%) rose after receiving a price target increase on Wall Street.
|
 Kenneth J. Gruneisen started out as a licensed stockbroker in August 1987, a couple of months prior to the historic stock market crash that took the Dow Jones Industrial Average down -22.6% in a single day. He has published daily fact-based fundamental and technical analysis on high-ranked stocks online for two decades. Through FACTBASEDINVESTING.COM, Kenneth provides educational articles, news, market commentary, and other information regarding proven investment systems that work in good times and bad.
Comments contained in the body of this report are technical opinions only and are not necessarily those of Gruneisen Growth Corp. The material herein has been obtained from sources believed to be reliable and accurate, however, its accuracy and completeness cannot be guaranteed. Our firm, employees, and customers may effect transactions, including transactions contrary to any recommendation herein, or have positions in the securities mentioned herein or options with respect thereto. Any recommendation contained in this report may not be suitable for all investors and it is not to be deemed an offer or solicitation on our part with respect to the purchase or sale of any securities. |
|
 |
| Oil Services |
$OSX |
69.74 |
-0.46 |
-0.66% |
-13.47% |
| Integrated Oil |
$XOI |
1,254.26 |
-4.80 |
-0.38% |
+8.21% |
| Semiconductor |
$SOX |
1,727.59 |
-9.19 |
-0.53% |
+49.55% |
| Networking |
$NWX |
583.11 |
-2.59 |
-0.44% |
+19.33% |
| Broker/Dealer |
$XBD |
273.57 |
-0.62 |
-0.23% |
+15.27% |
| Retail |
$RLX |
2,387.53 |
-9.44 |
-0.39% |
+22.35% |
| Gold & Silver |
$XAU |
91.53 |
-0.16 |
-0.17% |
+29.54% |
| Bank |
$BKX |
109.21 |
-0.51 |
-0.46% |
+27.30% |
| Biotech |
$BTK |
4,547.86 |
-34.82 |
-0.76% |
+7.75% |
|
|
|
 |
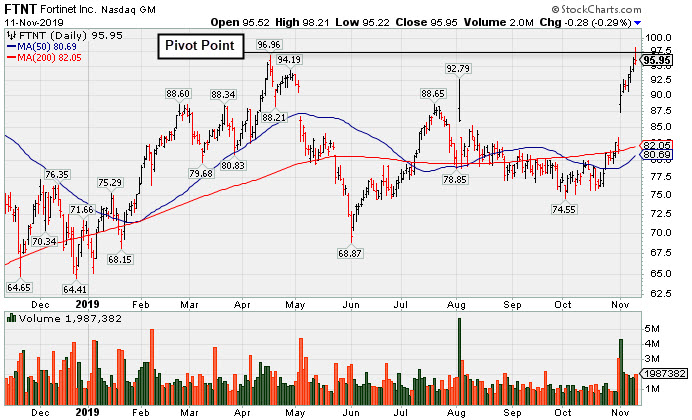
Reversed Into Red Today After Touching New High
Kenneth J. Gruneisen - Passed the CAN SLIM® Master's Exam
Fortinet Inc (FTNT -$0.28 or -0.29% to $95.95) finished lower after highlighted in yellow with new pivot point cited based on its 4/16/19 high plus 10 cents in the earlier mid-day report (read here). There was a "negative reversal" after hitting a new all-time high today, breaking a streak of 3 consecutive volume-driven gains. Subsequent gains and a strong close above the pivot point backed by at least +40% above average volume is needed to trigger a proper new (or add-on) technical buy signal.
FTNT gapped up on 11/01/19 helping its outlook to improve. Bullish action came after it reported earnings +37% on +21% sales revenues for the Sep '19 quarter versus the year ago period, its 7th consecutive quarterly comparison with earnings above the +25% minimum guideline (C criteria). It was last shown in this FSU section on 4/10/19 with an annotated graph under the headline, "Volume-Driven Gain Cleared Flat Base and Little Resistance Remains". It was dropped from the Featured Stocks list on 5/13/19 due to weak technical action, however, its fundamentals remained strong. Annual earnings (A criteria) have been improving since FY '14, also helping it match with the fact-based investment system's guidelines.
The number of top-rated funds owning its shares rose from 960 in Jun '18 to 1,557 in Sep '19, a reassuring sign concerning the I criteria. Its current Up/Down Volume ratio of 1.4 is an unbiased indication its shares have been under accumulation over the past 50 days. It has a Timeliness rating of A and Sponsorship rating of B.
Charts courtesy of www.stockcharts.com
 |
|
|
Color Codes Explained :
Y - Better candidates highlighted by our
staff of experts.
G - Previously featured
in past reports as yellow but may no longer be buyable under the
guidelines.
***Last / Change / Volume data in this table is the closing quote data***
Symbol/Exchange
Company Name
Industry Group |
PRICE |
CHANGE
(%Change) |
Day High |
Volume
(% DAV)
(% 50 day avg vol) |
52 Wk Hi
% From Hi |
Featured
Date |
Price
Featured |
Pivot Featured |
|
Max Buy |
 MLR
-
NYSE
MLR
-
NYSE
Miller Industries Inc
AUTOMOTIVE - Auto Parts
|
$34.99
|
-0.03
-0.09% |
$36.05
|
47,992
117.05% of 50 DAV
50 DAV is 41,000
|
$37.70
-7.19%
|
9/24/2019
|
$34.00
|
PP = $35.36
|
|
MB = $37.13
|
Most Recent Note - 11/8/2019 12:34:21 PM
Y - Retreating from its 52-week high with today's 3rd consecutive loss with above average volume. Prior highs in the $35 area define initial support above its 50 DMA line ($33.40). Fundamentals remain strong.
>>> FEATURED STOCK ARTICLE : Hit New High But Did Not Close Session Above Pivot Point - 10/29/2019 |
View all notes |
Set NEW NOTE alert |
Company Profile |
SEC
News |
Chart |
Request a new note
C
A
S
I |
CCBG
-
NASDAQ
Capital City Bk Gp
BANKING - Regional - Mid-Atlantic Banks
|
$29.75
|
-0.22
-0.73% |
$30.12
|
20,638
58.97% of 50 DAV
50 DAV is 35,000
|
$30.85
-3.57%
|
9/13/2019
|
$27.03
|
PP = $27.05
|
|
MB = $28.40
|
Most Recent Note - 11/7/2019 5:37:18 PM
G - There was a "negative reversal" after hitting another new 52-week high today. Extended from the prior base. Prior highs define important support to watch along with its 50 DMA line ($27.07).
>>> FEATURED STOCK ARTICLE : Noted "Positive Reversal" on Volatile Session After Earnings - 10/31/2019 |
View all notes |
Set NEW NOTE alert |
Company Profile |
SEC
News |
Chart |
Request a new note
C
A
S
I |
FTNT
-
NASDAQ
Fortinet Inc
Computer Sftwr-Security
|
$95.95
|
-0.28
-0.29% |
$98.21
|
1,982,259
151.78% of 50 DAV
50 DAV is 1,306,000
|
$96.96
-1.04%
|
11/11/2019
|
$97.14
|
PP = $97.06
|
|
MB = $101.91
|
 Most Recent Note - 11/11/2019 5:32:45 PM
Y - Broke a streak of 3 consecutive volume-driven gains as it touched a new high but reversed into the red today after highlighted in yellow with new pivot point cited based on its 4/16/19 high plus 10 cents. Subsequent gains and strong close above the pivot point backed by at least +40% above average volume is needed to trigger a proper new (or add-on) technical buy signal. Gapped up on 11/01/19 helping its outlook to improve. Bullish action came after it reported earnings +37% on +21% sales revenues for the Sep '19 quarter versus the year ago period. See the latest FSU analysis for more details and a new annotated graph.
>>> FEATURED STOCK ARTICLE : Reversed Into Red Today After Touching New High - 11/11/2019 |
View all notes |
Set NEW NOTE alert |
Company Profile |
SEC
News |
Chart |
Request a new note
C
A
S
I |
AUDC
-
NASDAQ
Audiocodes Ltd
ELECTRONICS - Scientific and Technical Instrum
|
$21.44
|
+0.16
0.75% |
$21.51
|
434,126
175.76% of 50 DAV
50 DAV is 247,000
|
$22.50
-4.71%
|
9/13/2019
|
$19.68
|
PP = $19.84
|
|
MB = $20.83
|
Most Recent Note - 11/11/2019 12:44:57 PM
G - Rebounded from early lows today below its "max buy" level. Reported earnings +26% on +15% sales revenues for the Sep '19 quarter. Its 50 DMA line ($19.31) and recent low ($17.54 on 10/08/19) define important near-term support levels to watch.
>>> FEATURED STOCK ARTICLE : Audiocodes is Quietly Perched Near its All-Time High - 11/7/2019 |
View all notes |
Set NEW NOTE alert |
Company Profile |
SEC
News |
Chart |
Request a new note
C
A
S
I |
CHDN
-
NASDAQ
Churchill Downs Inc
LEISURE - Gaming Activities
|
$126.26
|
+1.09
0.87% |
$126.85
|
190,061
67.88% of 50 DAV
50 DAV is 280,000
|
$135.32
-6.70%
|
10/8/2019
|
$129.77
|
PP = $132.83
|
|
MB = $139.47
|
Most Recent Note - 11/11/2019 11:46:18 AM
G - Technically, meeting resistance at its 50 DMA line ($126.53) when trying to rebound following damaging volume-driven losses last week. Reported Sep '19 earnings +4% on +38% sales revenues versus the year ago period, its 2nd consecutive quarterly comparison below the +25% minimum earnings guideline (C criteria), raising greater fundamental concerns.
>>> FEATURED STOCK ARTICLE : Perched at Record High at Time of Quarterly Report - 10/30/2019 |
View all notes |
Set NEW NOTE alert |
Company Profile |
SEC
News |
Chart |
Request a new note
C
A
S
I |
Symbol/Exchange
Company Name
Industry Group |
PRICE |
CHANGE
(%Change) |
Day High |
Volume
(% DAV)
(% 50 day avg vol) |
52 Wk Hi
% From Hi |
Featured
Date |
Price
Featured |
Pivot Featured |
|
Max Buy |
LULU
-
NASDAQ
Lululemon Athletica
MANUFACTURING - Textile Manufacturing
|
$207.19
|
+3.06
1.50% |
$207.19
|
1,244,825
62.87% of 50 DAV
50 DAV is 1,980,000
|
$209.02
-0.88%
|
9/6/2019
|
$201.25
|
PP = $194.35
|
|
MB = $204.07
|
Most Recent Note - 11/11/2019 11:49:05 AM
G - After wedging higher with gains lacking great volume conviction it found prompt support again near its 50 DMA line ($197.41). The prior low ($185.36 on 10/03/19) defines the next important near-term support.
>>> FEATURED STOCK ARTICLE : Testing 50-Day Moving Average With Loss on Above Average Volume - 11/4/2019 |
View all notes |
Set NEW NOTE alert |
Company Profile |
SEC
News |
Chart |
Request a new note
C
A
S
I |
CPRT
-
NASDAQ
Copart Inc
SPECIALTY RETAIL - Auto Dealerships
|
$82.97
|
+1.51
1.85% |
$83.00
|
1,053,858
68.43% of 50 DAV
50 DAV is 1,540,000
|
$85.31
-2.74%
|
9/5/2019
|
$79.13
|
PP = $79.84
|
|
MB = $83.83
|
Most Recent Note - 11/11/2019 11:47:40 AM
Y - Still consolidating below its "max buy" level and finding support above its 50 DMA line ($81.47). The 50 DMA line defines near-term support above the prior low ($76.35 on 10/03/19). Wedged to new all-time highs with recent gains lacking great volume conviction.
>>> FEATURED STOCK ARTICLE : Testing Support at 50-Day Moving Average - 11/6/2019 |
View all notes |
Set NEW NOTE alert |
Company Profile |
SEC
News |
Chart |
Request a new note
C
A
S
I |
NMIH
-
NASDAQ
N M I Holdings Inc Cl A
Finance-MrtgandRel Svc
|
$32.42
|
-0.49
-1.49% |
$32.90
|
563,100
139.04% of 50 DAV
50 DAV is 405,000
|
$33.54
-3.34%
|
11/8/2019
|
$32.89
|
PP = $31.44
|
|
MB = $33.01
|
Most Recent Note - 11/8/2019 5:48:14 PM
Y - Finished strong today after highlighted in yellow with pivot point cited based on its 6/10/19 high plus 10 cents. Technically it broke out on the prior session with a gain backed by +273% above average volume hitting a new all-time high. Tallied another volume-driven gain today. Reported earnings +54% on +42% sales revenues for the Sep '19 quarter, and prior quarterly comparisons were also well above the +25% minimum guideline (C criteria). After years of losses it had profitable years for FY '16, '17, and '18. See the latest FSU analysis for more details and a new annotated graph.
>>> FEATURED STOCK ARTICLE : Hit New High With Volume-Driven Gains - 11/8/2019 |
View all notes |
Set NEW NOTE alert |
Company Profile |
SEC
News |
Chart |
Request a new note
C
A
S
I |
BLD
-
NYSE
Topbuild Corp
Bldg-Constr Prds/Misc
|
$106.31
|
+0.93
0.88% |
$106.54
|
174,462
61.00% of 50 DAV
50 DAV is 286,000
|
$111.48
-4.64%
|
5/17/2019
|
$82.19
|
PP = $87.31
|
|
MB = $91.68
|
Most Recent Note - 11/11/2019 11:43:43 AM
G - Consolidating after getting very extended from any sound base with volume-driven gains last week for new all-time highs. Reported earnings +24% on +5% sales revenues for the Sep '19 quarter versus the year ago period, just below the +25% minimum guideline (C criteria). Found prompt support near its 50 DMA line ($97.78) during its ongoing ascent.
>>> FEATURED STOCK ARTICLE : Pulling Back After Recently Wedging Into New High Territory - 10/23/2019 |
View all notes |
Set NEW NOTE alert |
Company Profile |
SEC
News |
Chart |
Request a new note
C
A
S
I |
|
|
|
THESE ARE NOT BUY RECOMMENDATIONS!
Comments contained in the body of this report are technical
opinions only. The material herein has been obtained
from sources believed to be reliable and accurate, however,
its accuracy and completeness cannot be guaranteed.
This site is not an investment advisor, hence it does
not endorse or recommend any securities or other investments.
Any recommendation contained in this report may not
be suitable for all investors and it is not to be deemed
an offer or solicitation on our part with respect to
the purchase or sale of any securities. All trademarks,
service marks and trade names appearing in this report
are the property of their respective owners, and are
likewise used for identification purposes only.
This report is a service available
only to active Paid Premium Members.
You may opt-out of receiving report notifications
at any time. Questions or comments may be submitted
by writing to Premium Membership Services 665 S.E. 10 Street, Suite 201 Deerfield Beach, FL 33441-5634 or by calling 1-800-965-8307
or 954-785-1121.
|
|
|

