You are not logged in.
This means you
CAN ONLY VIEW reports that were published prior to Monday, April 14, 2025.
You
MUST UPGRADE YOUR MEMBERSHIP if you want to see any current reports.
AFTER MARKET UPDATE - MONDAY, NOVEMBER 3RD, 2014
Previous After Market Report Next After Market Report >>>
|
|
|
|
DOW |
-24.28 |
17,366.24 |
-0.14% |
|
Volume |
779,836,700 |
-24% |
|
Volume |
1,879,227,190 |
-15% |
|
NASDAQ |
+8.17 |
4,638.91 |
+0.18% |
|
Advancers |
1,527 |
48% |
|
Advancers |
1,360 |
45% |
|
S&P 500 |
-0.24 |
2,017.81 |
-0.01% |
|
Decliners |
1,573 |
49% |
|
Decliners |
1,544 |
52% |
|
Russell 2000 |
-3.31 |
1,170.20 |
-0.28% |
|
52 Wk Highs |
249 |
|
|
52 Wk Highs |
146 |
|
|
S&P 600 |
-1.65 |
677.85 |
-0.24% |
|
52 Wk Lows |
28 |
|
|
52 Wk Lows |
44 |
|
|
 |
Major Averages Ended Mixed With Lighter Volume Totals
Kenneth J. Gruneisen - Passed the CAN SLIM® Master's Exam
The major averages ended mixed and little changed on Monday. The volume totals were reported lighter than the prior session totals on the NYSE and on the Nasdaq exchange. Breadth was slightly negative as decliners narrowly led decliners on the NYSE and on the Nasdaq exchange. There were 100 high-ranked companies from the CANSLIM.net Leaders List that made new 52-week highs and appeared on the CANSLIM.net BreakOuts Page, down from the prior session total of 157 stocks. The new 52-week highs totals contracted yet still easily outnumbered new 52-week lows on the NYSE and on the Nasdaq exchange. There were gains for 5 of the 12 high-ranked companies currently on the Featured Stocks Page, a list which recently gained several new companies as broader market conditions improved. Disciplined investors know that new buying efforts may be made under the fact-based investment system only in stocks meeting all key criteria.
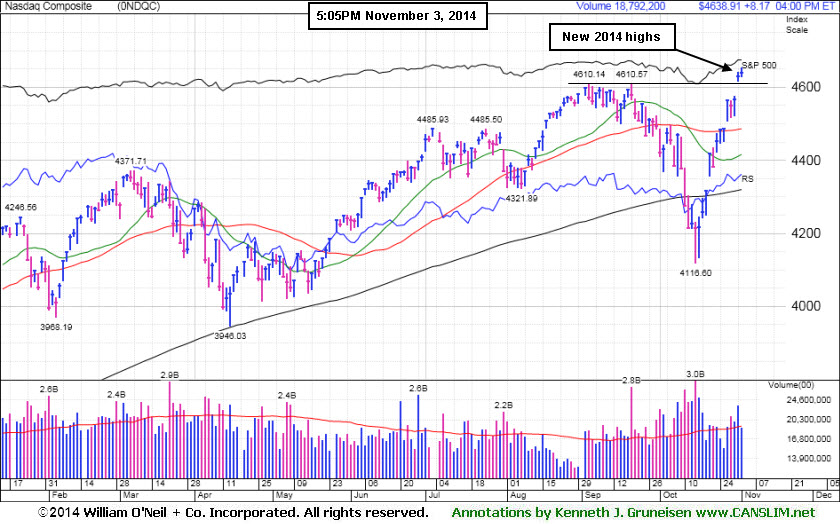
PICTURED: The Nasdaq Composite Index added to Friday's gap up gain and hit another new 2014 high.
The major averages toggled between gains and losses as investors weighed a mixed round of economic data. A final reading of manufacturing sentiment for October fell more than analysts projected. Similarly, construction spending for the month of September declined -0.4% versus a projected +0.7% increase. A gauge of factory activity unexpectedly increased in October to the highest level since March of 2011.
On the earnings front shares of Loews (L -1.10%) edged lower and Affiliated Managers (AMG -3.31%) fell after both companies reported disappointing earnings results.
Six of 10 sectors in the S&P 500 were up on the session. Utilities and tech were the best performing groups as Duke Energy (DUK +0.28%) and Apple (AAPL +1.3%) rose. Energy was the biggest decliner as the price of crude oil fell sharply, and Exxon Mobil (XOM -1.5%) fell with many others.
Treasuries were lower with the 10-year note down 2/32 to yield 2.34%. In commodities, WTI crude fell on the NYMEX by 2.7% to $78.23 per barrel. On the COMEX gold lost -0.5% to $1165.20 per ounce.
Large gains on 10/21/14 backed by higher volume totals while leadership (stocks hitting new 52-week highs) expanded met the definition of a "follow-through day" confirming a new uptrend for the market (M criteria). The S&P 500 Index, Nasdaq Composite Index, and the Dow Jones Industrial Average have collectively rebounded above their respective 50-day and 200-day moving average (DMA) lines, technically putting the market in a healthier stance.
The CANSLIM.net Featured Stocks Page shows the most action-worthy candidates and their latest notes and a Headline Link directs members to the latest detailed analysis with data-packed graphs annotated by a Certified expert along with links to additional resources. The Premium Member Homepage includes "dynamic archives" to all prior pay reports published.
|
 Kenneth J. Gruneisen started out as a licensed stockbroker in August 1987, a couple of months prior to the historic stock market crash that took the Dow Jones Industrial Average down -22.6% in a single day. He has published daily fact-based fundamental and technical analysis on high-ranked stocks online for two decades. Through FACTBASEDINVESTING.COM, Kenneth provides educational articles, news, market commentary, and other information regarding proven investment systems that work in good times and bad.
Comments contained in the body of this report are technical opinions only and are not necessarily those of Gruneisen Growth Corp. The material herein has been obtained from sources believed to be reliable and accurate, however, its accuracy and completeness cannot be guaranteed. Our firm, employees, and customers may effect transactions, including transactions contrary to any recommendation herein, or have positions in the securities mentioned herein or options with respect thereto. Any recommendation contained in this report may not be suitable for all investors and it is not to be deemed an offer or solicitation on our part with respect to the purchase or sale of any securities. |
|
 |
Tech Sector Showed Positive Bias
Kenneth J. Gruneisen - Passed the CAN SLIM® Master's Exam
The Retail Index ($RLX -0.24%) edged lower while the Bank Index ($BKX +0.15%) and the Broker/Dealer Index ($XBD +0.20%) inched higher. The tech sector had a positive bias as the Semiconductor Index ($SOX +0.61%) and the Networking Index ($NWX +0.94%) outpaced the Biotechnology Index ($BTK +0.21%). The Gold & Silver Index ($XAU +3.01%) bounced, meanwhile energy-related shares were weak as losses for the Oil Services Index ($OSX -2.67%) and the Integrated Oil Index ($XOI -2.05%) created a drag on the market.
Charts courtesy www.stockcharts.com
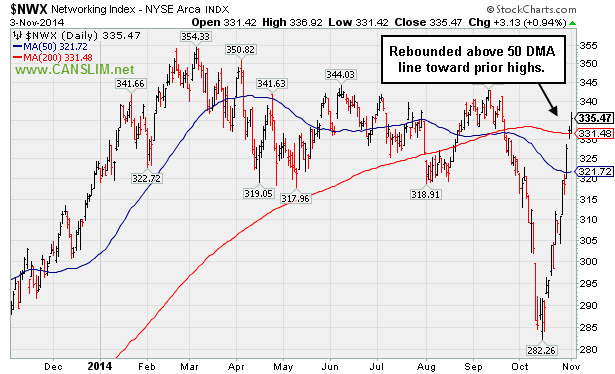
PICTURED: The Networking Index ($NWX +0.94%) rebounded above its 50-day moving average (DMA) line toward prior highs.
| Oil Services |
$OSX |
242.10 |
-6.64 |
-2.67% |
-13.85% |
| Integrated Oil |
$XOI |
1,454.66 |
-30.42 |
-2.05% |
-3.23% |
| Semiconductor |
$SOX |
644.77 |
+3.91 |
+0.61% |
+20.51% |
| Networking |
$NWX |
335.47 |
+3.13 |
+0.94% |
+3.56% |
| Broker/Dealer |
$XBD |
175.02 |
+0.35 |
+0.20% |
+9.01% |
| Retail |
$RLX |
951.92 |
-2.26 |
-0.24% |
+1.29% |
| Gold & Silver |
$XAU |
66.83 |
+1.95 |
+3.01% |
-20.58% |
| Bank |
$BKX |
72.25 |
+0.11 |
+0.15% |
+4.32% |
| Biotech |
$BTK |
3,361.48 |
+7.16 |
+0.21% |
+44.24% |
|
|
|
 |
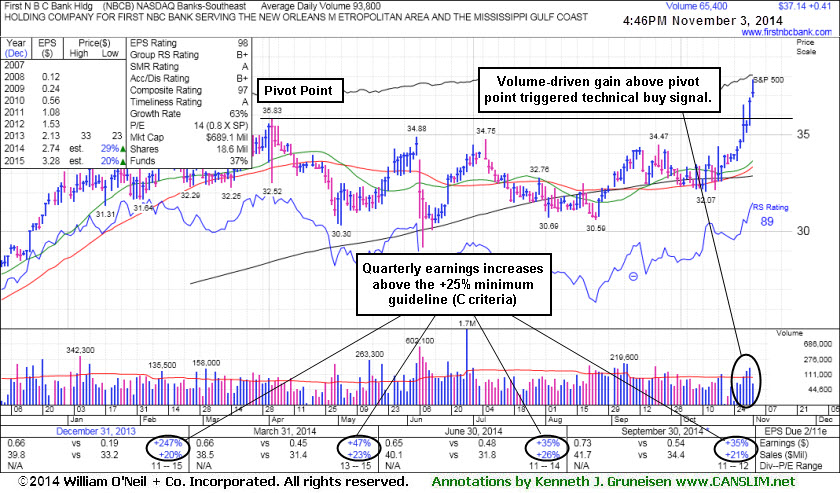
Financial Firm at 52-Week High Tallied 8th Consecutive Gain
Kenneth J. Gruneisen - Passed the CAN SLIM® Master's Exam
First N B C Bank Hldg (NBCB +$0.41 or +% to $37.14) hit another new 52-week high today. It finished strong after highlighted in yellow with pivot point cited based on its 4/02/14 high plus 10 cents in the 10/31/14 mid-day report (read here). The big gain above the pivot point backed by +79% above average volume clinched a technical buy signal. No resistance remains due to overhead supply after 8 consecutive gains. Its small supply of only 18.5 million shares (S criteria) outstanding can contribute to greater price volatility in the event of institutional buying or selling. Disciplined investors avoid chasing stocks more than +5% above their prior highs and always limit losses by selling any stocks that fall more than -7% from their purchase price.
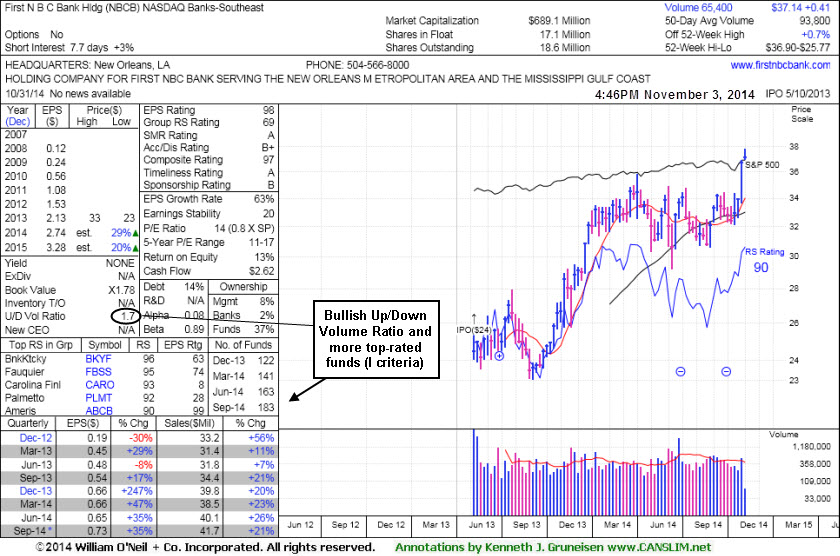
The high-ranked Bank holding company reported earnings +35% on +21% sales revenues for the Sep '14 quarter, its 4th consecutive quarterly comparison above the +25% minimum earnings guideline (C criteria). Annual earnings (A criteria) growth has also been strong. The current Up/Down Volume Ratio of 1.7 is an unbiased indication its shares have been under accumulation over the past 50 days. The number of top-rated funds owning its shares rose from 122 in Dec '13 to 183 in Sep '14, a reassuring sign concerning the I criteria.
|
|
|
Color Codes Explained :
Y - Better candidates highlighted by our
staff of experts.
G - Previously featured
in past reports as yellow but may no longer be buyable under the
guidelines.
***Last / Change / Volume data in this table is the closing quote data***
Symbol/Exchange
Company Name
Industry Group |
PRICE |
CHANGE
(%Change) |
Day High |
Volume
(% DAV)
(% 50 day avg vol) |
52 Wk Hi
% From Hi |
Featured
Date |
Price
Featured |
Pivot Featured |
|
Max Buy |
ACT
-
NYSE
Actavis plc
Medical-Generic Drugs
|
$247.50
|
+4.76
1.96% |
$249.35
|
2,399,466
112.28% of 50 DAV
50 DAV is 2,137,000
|
$249.94
-0.98%
|
6/20/2014
|
$216.53
|
PP = $230.87
|
|
MB = $242.41
|
Most Recent Note - 10/30/2014 3:13:16 PM
G - Color code is changed to green after rallying beyond its "max buy" level and hitting a new 52-week high today. Prior highs near $179 define initial support to watch on pullbacks.
>>> FEATURED STOCK ARTICLE : Quiet Gains Help Generic Drug Firm Rise Above 50-Day Average - 10/21/2014
View all notes |
Set NEW NOTE alert |
CANSLIM.net Company Profile |
SEC
News |
Chart |
Request a new note
C
A N
S L
I M


|
AFSI
-
NASDAQ
Amtrust Financial Svcs
INSURANCE - Property and; Casualty Insurance
|
$46.70
|
+1.83
4.08% |
$47.33
|
1,530,965
175.17% of 50 DAV
50 DAV is 874,000
|
$53.50
-12.71%
|
10/17/2014
|
$45.24
|
PP = $46.02
|
|
MB = $48.32
|
 Most Recent Note - 11/3/2014 6:16:59 PM
G - Recent low ($42.36 on 10/31/14) defines important near-term support. Tallied 2 consecutive gains with above average volume since halting its slide after slumping to its 50 DMA line ($43.22), abruptly retreating from its 52-week high last week following an analyst downgrade.
>>> FEATURED STOCK ARTICLE : Perched Near High After Rebounding From 200-Day Average - 10/17/2014
View all notes |
Set NEW NOTE alert |
CANSLIM.net Company Profile |
SEC
News |
Chart |
Request a new note
C
A N
S L
I M
|
ALXN
-
NASDAQ
Alexion Pharmaceuticals
DRUGS - Drug Manufacturers - Other
|
$191.04
|
-0.32
-0.17% |
$193.75
|
908,080
74.92% of 50 DAV
50 DAV is 1,212,000
|
$197.23
-3.14%
|
10/23/2014
|
$184.01
|
PP = $185.53
|
|
MB = $194.81
|
Most Recent Note - 11/3/2014 6:11:03 PM
Y - Holding its ground at its 52-week high volume totals cooling. Prior highs in the $180 area define initial support to watch on pullbacks.
>>> FEATURED STOCK ARTICLE : Finished Strong After Gapping Up Above Prior High - 10/23/2014
View all notes |
Set NEW NOTE alert |
CANSLIM.net Company Profile |
SEC
News |
Chart |
Request a new note
C
A N
S L
I M
|
BIDU
-
NASDAQ
Baidu Inc Ads
INTERNET - Internet Information Providers
|
$236.54
|
-2.23
-0.93% |
$240.56
|
3,506,215
95.62% of 50 DAV
50 DAV is 3,667,000
|
$242.62
-2.51%
|
10/30/2014
|
$234.08
|
PP = $231.51
|
|
MB = $243.09
|
Most Recent Note - 11/3/2014 6:13:26 PM
Y - Pulled back today for a small loss on lighter volume. Finished strong and clinched a convincing technical buy signal after highlighted in yellow with pivot point cited based on its 9/19/14 high plus 10 cents in the 10/30/14 mid-day report (read here). Prior highs near $230 define near-term support to watch on pullbacks.
>>> FEATURED STOCK ARTICLE : Technical Breakout on Triple Average Volume Following Strong Earnings - 10/30/2014
View all notes |
Set NEW NOTE alert |
CANSLIM.net Company Profile |
SEC
News |
Chart |
Request a new note
C
A N
S L
I M
|
EPAM
-
NYSE
Epam Systems Inc
COMPUTER SOFTWARE and SERVICES - Information Technology Service
|
$47.71
|
-0.03
-0.06% |
$47.97
|
652,380
168.57% of 50 DAV
50 DAV is 387,000
|
$48.99
-2.61%
|
10/23/2014
|
$45.21
|
PP = $46.09
|
|
MB = $48.39
|
Most Recent Note - 11/3/2014 12:15:04 PM
Y - Hovering near its 52-week high following a spurt of gains backed by above average volume. Near term support to watch is at prior highs in the $44 area. Rally recently cleared the pivot point cited triggering a technical buy signal.
>>> FEATURED STOCK ARTICLE : Pulled Back After Challenging Prior Highs - 10/24/2014
View all notes |
Set NEW NOTE alert |
CANSLIM.net Company Profile |
SEC
News |
Chart |
Request a new note
C
A N
S L
I M
|
Symbol/Exchange
Company Name
Industry Group |
PRICE |
CHANGE
(%Change) |
Day High |
Volume
(% DAV)
(% 50 day avg vol) |
52 Wk Hi
% From Hi |
Featured
Date |
Price
Featured |
Pivot Featured |
|
Max Buy |
FB
-
NASDAQ
Facebook Inc Cl A
INTERNET
|
$73.88
|
-1.11
-1.48% |
$75.52
|
40,378,320
103.33% of 50 DAV
50 DAV is 39,077,000
|
$81.16
-8.97%
|
9/9/2014
|
$76.67
|
PP = $76.84
|
|
MB = $80.68
|
Most Recent Note - 10/30/2014 1:01:31 PM
G - Falling again today with above average volume after a 50 DMA line violation on 3 times average volume raised concerns and triggered a technical sell signal on the prior session. Volume and volatility often increase near earnings news. The company reported earnings +59% on +59% sales for the Sep '14 quarter but warned of rising costs. Historic studies show that investors have a far better chance of success when buying as a stock is breaking out, not buying on pullbacks. See the latest FSU analysis for more details and annotated graphs.
>>> FEATURED STOCK ARTICLE : Gapped Down Following Latest Strong Earnings Report - 10/29/2014
View all notes |
Set NEW NOTE alert |
CANSLIM.net Company Profile |
SEC
News |
Chart |
Request a new note
C
A N
S L
I M
|
FLT
-
NYSE
Fleetcor Technologies
DIVERSIFIED SERVICES - Business/Management Services
|
$150.23
|
-0.33
-0.22% |
$152.14
|
728,593
101.62% of 50 DAV
50 DAV is 717,000
|
$153.52
-2.14%
|
10/31/2014
|
$148.50
|
PP = $146.29
|
|
MB = $153.60
|
Most Recent Note - 10/31/2014 5:58:07 PM
Y - Finished strong after highlighted in yellow with new pivot point cited based on its 9/18/14 high in a "double bottom" base in the earlier mid-day report (read here). Gapped up and hit a new 52-week high clinching a convincing technical buy signal. Reported earnings +27% on +31% sales revenues for the Sep '14 quarter, above the +25% minimum earnings guideline (C criteria). See the latest FSU analysis for more details and new annotated graphs.
>>> FEATURED STOCK ARTICLE : Strong Finish Following Gap Up After Earnings News - 10/31/2014
View all notes |
Set NEW NOTE alert |
CANSLIM.net Company Profile |
SEC
News |
Chart |
Request a new note
C
A N
S L
I M
|
ILMN
-
NASDAQ
Illumina Inc
DRUGS - Biotechnology
|
$194.33
|
+1.75
0.91% |
$196.83
|
1,044,519
82.77% of 50 DAV
50 DAV is 1,262,000
|
$197.37
-1.54%
|
10/22/2014
|
$188.77
|
PP = $182.27
|
|
MB = $191.38
|
Most Recent Note - 10/30/2014 3:06:47 PM
G - Color code is changed to green while hitting a new 52-week high today and rallying above its "max buy" level. Prior highs near $182 define near-term support to watch on pullbacks.
>>> FEATURED STOCK ARTICLE : Breakout Cleared "Double Bottom" Base Pattern - 10/22/2014
View all notes |
Set NEW NOTE alert |
CANSLIM.net Company Profile |
SEC
News |
Chart |
Request a new note
C
A N
S L
I M
|
NBCB
-
NASDAQ
First N B C Bank Hldg
Banks-Southeast
|
$37.14
|
+0.41
1.12% |
$37.83
|
65,477
70.41% of 50 DAV
50 DAV is 93,000
|
$36.90
0.65%
|
10/31/2014
|
$36.31
|
PP = $35.93
|
|
MB = $37.73
|
Most Recent Note - 11/3/2014 6:08:11 PM
Y - No resistance remains due to overhead supply after 8 consecutive gains. Finished strong after highlighted in yellow in the 10/31/14 mid-day report (read here). Reported earnings +35% on +21% sales revenues for the Sep '14 quarter, its 4th consecutive quarterly comparison above the +25% minimum earnings guideline (C criteria). See the latest FSU analysis for more details and new annotated graphs.
>>> FEATURED STOCK ARTICLE : Financial Firm at 52-Week High Tallied 8th Consecutive Gain - 11/3/2014
View all notes |
Set NEW NOTE alert |
CANSLIM.net Company Profile |
SEC
News |
Chart |
Request a new note
C
A N
S L
I M
|
PANW
-
NYSE
Palo Alto Networks
Computer Sftwr-Security
|
$105.96
|
+0.26
0.25% |
$106.78
|
1,322,892
57.84% of 50 DAV
50 DAV is 2,287,000
|
$108.50
-2.34%
|
7/30/2014
|
$84.21
|
PP = $85.88
|
|
MB = $90.17
|
Most Recent Note - 11/3/2014 6:09:43 PM
G - Stubbornly holding its ground with volume totals cooling while perched near its 52-week high, extended from any sound base. Its 50 DMA line ($97.27) defines important near-term support where a violation would trigger a technical sell signal.
>>> FEATURED STOCK ARTICLE : Rebound and Rally Leaves Tech Firm Extended From Base - 10/28/2014
View all notes |
Set NEW NOTE alert |
CANSLIM.net Company Profile |
SEC
News |
Chart |
Request a new note
C
A N
S L
I M
|
Symbol/Exchange
Company Name
Industry Group |
PRICE |
CHANGE
(%Change) |
Day High |
Volume
(% DAV)
(% 50 day avg vol) |
52 Wk Hi
% From Hi |
Featured
Date |
Price
Featured |
Pivot Featured |
|
Max Buy |
SNCR
-
NASDAQ
Synchronoss Technologies
COMPUTER SOFTWARE andamp; SERVICES - Application Software
|
$50.60
|
-1.07
-2.07% |
$52.14
|
669,150
129.68% of 50 DAV
50 DAV is 516,000
|
$53.47
-5.37%
|
10/27/2014
|
$46.40
|
PP = $47.81
|
|
MB = $50.20
|
Most Recent Note - 10/30/2014 3:10:36 PM
G - Color code is changed to green while rallying well above the "max buy" level cited. Prior highs in the $47 area define initial support to watch on pullbacks. Considerable gain on 10/28/14 was backed by more than 4 times average volume after reporting earnings +35% on +40% sales revenues for the Sep '14 quarter. See the latest FSU analysis for more details and an annotated daily graph.
>>> FEATURED STOCK ARTICLE : No Resistance Remains; Perched at Secondary Buy Point - 10/27/2014
View all notes |
Set NEW NOTE alert |
CANSLIM.net Company Profile |
SEC
News |
Chart |
Request a new note
C
A N
S L
I M
|
STRT
-
NASDAQ
Strattec Security Corp
AUTOMOTIVE - Auto Parts
|
$102.16
|
-1.56
-1.50% |
$104.34
|
26,434
94.41% of 50 DAV
50 DAV is 28,000
|
$109.44
-6.65%
|
9/19/2014
|
$86.06
|
PP = $89.97
|
|
MB = $94.47
|
Most Recent Note - 11/3/2014 6:18:36 PM
G - Hovering near its 52-week high, holding its ground after volume-driven gains. It is very extended beyond its "max buy" level. Prior highs in the $88 area define important near-term support to watch above its 50 DMA line.
>>> FEATURED STOCK ARTICLE : Building Base-On-Base Pattern Ahead of Earnings News - 10/20/2014
View all notes |
Set NEW NOTE alert |
CANSLIM.net Company Profile |
SEC
News |
Chart |
Request a new note
C
A N
S L
I M
|
|
|
|
THESE ARE NOT BUY RECOMMENDATIONS!
Comments contained in the body of this report are technical
opinions only. The material herein has been obtained
from sources believed to be reliable and accurate, however,
its accuracy and completeness cannot be guaranteed.
This site is not an investment advisor, hence it does
not endorse or recommend any securities or other investments.
Any recommendation contained in this report may not
be suitable for all investors and it is not to be deemed
an offer or solicitation on our part with respect to
the purchase or sale of any securities. All trademarks,
service marks and trade names appearing in this report
are the property of their respective owners, and are
likewise used for identification purposes only.
This report is a service available
only to active Paid Premium Members.
You may opt-out of receiving report notifications
at any time. Questions or comments may be submitted
by writing to Premium Membership Services 665 S.E. 10 Street, Suite 201 Deerfield Beach, FL 33441-5634 or by calling 1-800-965-8307
or 954-785-1121.
|
|
|

