You are not logged in.
This means you
CAN ONLY VIEW reports that were published prior to Sunday, October 20, 2024.
You
MUST UPGRADE YOUR MEMBERSHIP if you want to see any current reports.
AFTER MARKET UPDATE - TUESDAY, NOVEMBER 4TH, 2014
Previous After Market Report Next After Market Report >>>
|
|
|
|
DOW |
+17.60 |
17,383.84 |
+0.10% |
|
Volume |
812,230,000 |
+4% |
|
Volume |
1,786,411,310 |
-5% |
|
NASDAQ |
-15.27 |
4,623.64 |
-0.33% |
|
Advancers |
1,244 |
39% |
|
Advancers |
1,206 |
41% |
|
S&P 500 |
-5.71 |
2,012.10 |
-0.28% |
|
Decliners |
1,850 |
58% |
|
Decliners |
1,667 |
56% |
|
Russell 2000 |
-4.79 |
1,165.42 |
-0.41% |
|
52 Wk Highs |
207 |
|
|
52 Wk Highs |
92 |
|
|
S&P 600 |
-2.13 |
675.72 |
-0.31% |
|
52 Wk Lows |
76 |
|
|
52 Wk Lows |
49 |
|
|
 |
Leadership Contracted as Major Indices Ended Mixed
Kenneth J. Gruneisen - Passed the CAN SLIM® Master's Exam
Stocks took a breather on Tuesday. The S&P 500 fell from a fresh record high as it declined 5 points to 2,012. The NASDAQ Composite lost 15 points to 4,623. The volume totals were reported mixed, higher than the prior session totals on the NYSE and lower on the Nasdaq exchange. Breadth was negative as decliners led advancers by a 3-2 margin on the NYSE and 4-3 on the Nasdaq exchange. There were 65 high-ranked companies from the CANSLIM.net Leaders List that made new 52-week highs and appeared on the CANSLIM.net BreakOuts Page, down from the prior session total of 100 stocks. The new 52-week highs totals contracted yet still outnumbered new 52-week lows on the NYSE and on the Nasdaq exchange. There were gains for 8 of the 12 high-ranked companies currently on the Featured Stocks Page, a list which recently gained several new companies as broader market conditions improved. Disciplined investors know that new buying efforts may be made under the fact-based investment system only in stocks meeting all key criteria.
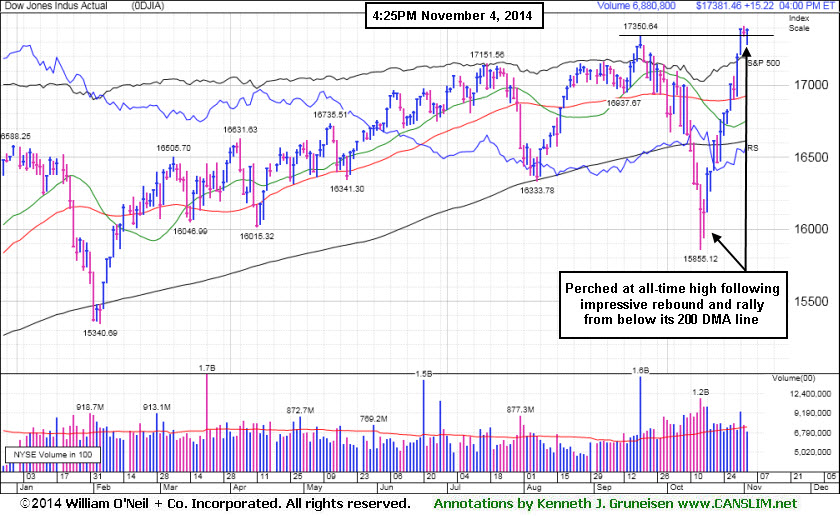
PICTURED: The Dow Jones Industrial Average declined as many as 90 points on Tuesday, yet finished up 17 points to 17383. The Blue Chip index is perched at its all-time high after rebounding and rallying quickly from below its 200-day moving average (DMA) line.
A drop in energy stocks dragged on the market as WTI crude slid to a three-year low amid news that Saudi Arabia cut prices for exports to the U.S. Schlumberger (SLB -2.45%) and Halliburton (HAL -5.01%) fell. Losses in the consumer discretionary sector also weighed on stocks. Priceline (PCLN -8.41%) fell after posting a disappointing fourth-quarter sales forecast. Michael Kors (KORS -8.42%) fell after same-store sales missed analyst estimates. On the upside, consumer staples rose. Archer Daniels Midland (ADM +4.85%) reported better-than-expected earnings results. Industrials also advanced. 3M (MMM +1.14%) helped the Dow edge higher.
Fed speak garnered some attention. St. Louis Fed President James Bullard said he is upbeat about the U.S. economy and there is no need for new stimulus measures as slowing growth in Europe and China is not affecting the U.S. recovery. On the economic front, factory orders fell -0.6% in September and the U.S. trade deficit unexpectedly expanded to a four-month high of $43 billion.Treasuries rose. The 10-year note gained 2/32 to yield 2.34%.
Large gains on 10/21/14 backed by higher volume totals while leadership (stocks hitting new 52-week highs) expanded met the definition of a "follow-through day" confirming a new uptrend for the market (M criteria). The S&P 500 Index, Nasdaq Composite Index, and the Dow Jones Industrial Average have collectively rebounded above their respective 50-day and 200-day moving average (DMA) lines, technically putting the market in a healthier stance.
The CANSLIM.net Featured Stocks Page shows the most action-worthy candidates and their latest notes and a Headline Link directs members to the latest detailed analysis with data-packed graphs annotated by a Certified expert along with links to additional resources. The Premium Member Homepage includes "dynamic archives" to all prior pay reports published.
|
 Kenneth J. Gruneisen started out as a licensed stockbroker in August 1987, a couple of months prior to the historic stock market crash that took the Dow Jones Industrial Average down -22.6% in a single day. He has published daily fact-based fundamental and technical analysis on high-ranked stocks online for two decades. Through FACTBASEDINVESTING.COM, Kenneth provides educational articles, news, market commentary, and other information regarding proven investment systems that work in good times and bad.
Comments contained in the body of this report are technical opinions only and are not necessarily those of Gruneisen Growth Corp. The material herein has been obtained from sources believed to be reliable and accurate, however, its accuracy and completeness cannot be guaranteed. Our firm, employees, and customers may effect transactions, including transactions contrary to any recommendation herein, or have positions in the securities mentioned herein or options with respect thereto. Any recommendation contained in this report may not be suitable for all investors and it is not to be deemed an offer or solicitation on our part with respect to the purchase or sale of any securities. |
|
 |
Commodity-Linked Groups and Retail Index Fell
Kenneth J. Gruneisen - Passed the CAN SLIM® Master's Exam
The Bank Index ($BKX -0.08%) finished flat and the Broker/Dealer Index ($XBD +0.33%) inched higher. The tech sector was mixed as the Semiconductor Index ($SOX -0.28%) edged lower and the Biotechnology Index ($BTK -0.97%) fell while the Networking Index ($NWX +0.40%) posted a modest gain. The Retail Index ($RLX -1.06%) was a negative influence on the major averages on Tuesday. The Gold & Silver Index ($XAU -3.71%) was a standout decliner as it more than erased the prior session's big bounce. Energy-related shares were weak as losses for the Oil Services Index ($OSX -3.27%) and the Integrated Oil Index ($XOI -1.67%) created a drag on the market.
Charts courtesy www.stockcharts.com
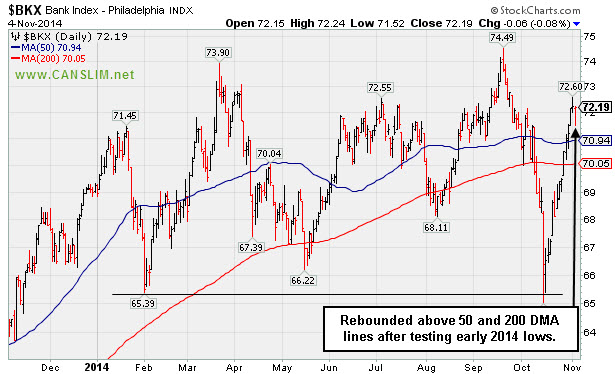
PICTURED: The Bank Index ($BKX -0.08%) has rebounded above its 50-day moving average (DMA) line after deep pullback below its 200 DMA line tested its early 2014 lows.
| Oil Services |
$OSX |
234.19 |
-7.91 |
-3.27% |
-16.67% |
| Integrated Oil |
$XOI |
1,430.35 |
-24.30 |
-1.67% |
-4.84% |
| Semiconductor |
$SOX |
642.99 |
-1.78 |
-0.28% |
+20.18% |
| Networking |
$NWX |
336.83 |
+1.35 |
+0.40% |
+3.98% |
| Broker/Dealer |
$XBD |
175.60 |
+0.58 |
+0.33% |
+9.37% |
| Retail |
$RLX |
941.82 |
-10.10 |
-1.06% |
+0.21% |
| Gold & Silver |
$XAU |
64.35 |
-2.48 |
-3.71% |
-23.53% |
| Bank |
$BKX |
72.19 |
-0.06 |
-0.08% |
+4.23% |
| Biotech |
$BTK |
3,328.74 |
-32.75 |
-0.97% |
+42.84% |
|
|
|
 |
Stock With Small Supply Quickly Got Extended From Prior Base
Kenneth J. Gruneisen - Passed the CAN SLIM® Master's Exam
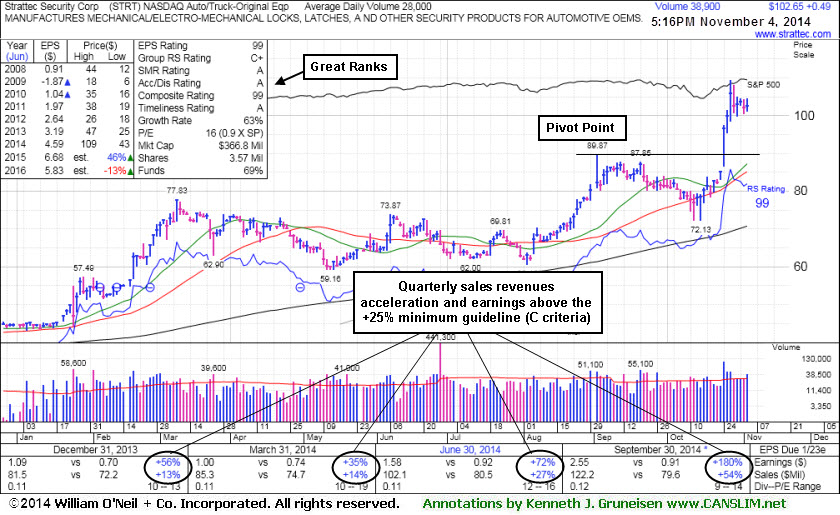
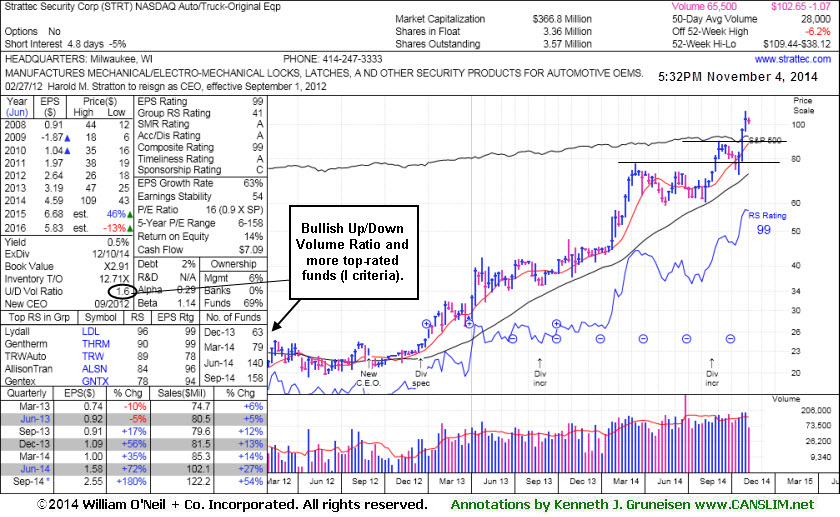
Strattec Security Corp (STRT +$0.49 or +0.48% to $102.65) is hovering near its 52-week high, stubbornly holding its ground after volume-driven gains. The Auto/Truck - Original Equipment firm is very extended beyond its "max buy" level. Prior highs in the $88 area define important near-term support to watch above its 50-day moving average (DMA) line.
STRT was last shown in this FSU section on 10/20/14 with annotated graphs under the headline, "Building Base-On-Base Pattern Ahead of Earnings News". A powerful volume-driven gain on 10/24/14 cleared its base-on-base pattern leaving no resistance remaining due to overhead supply. It has traded up as much as +53.1% since first highlighted in yellow at $71.47 with pivot point based on its 6/06/14 high plus 10 cents in the 8/22/14 mid-day report (read here).
The thinly-traded stock has a small supply (S criteria) of only 3.36 million shares in the public float which can contribute to greater price volatility in the event of institutional buying or selling. Quarterly earnings increases through Sep '14 were above the +25% minimum guideline satisfy the C criteria and its annual earnings (A criteria) history has been strong. Increasing ownership by top-rated funds (I criteria) is a reassuring sign. The number of top-rated funds owning its shares rose from 59 in Sep '14 to 158 in Sep '14, a very reassuring sign concerning the I criteria. Its current Up/Down Volume Ratio of 1.6 is an unbiased indication its shares have been under accumulation over the past 50 days.
|
|
|
Color Codes Explained :
Y - Better candidates highlighted by our
staff of experts.
G - Previously featured
in past reports as yellow but may no longer be buyable under the
guidelines.
***Last / Change / Volume data in this table is the closing quote data***
Symbol/Exchange
Company Name
Industry Group |
PRICE |
CHANGE
(%Change) |
Day High |
Volume
(% DAV)
(% 50 day avg vol) |
52 Wk Hi
% From Hi |
Featured
Date |
Price
Featured |
Pivot Featured |
|
Max Buy |
ACT
-
NYSE
Actavis plc
Medical-Generic Drugs
|
$245.32
|
-2.18
-0.88% |
$248.85
|
2,570,007
118.87% of 50 DAV
50 DAV is 2,162,000
|
$249.94
-1.85%
|
6/20/2014
|
$216.53
|
PP = $230.87
|
|
MB = $242.41
|
Most Recent Note - 10/30/2014 3:13:16 PM
G - Color code is changed to green after rallying beyond its "max buy" level and hitting a new 52-week high today. Prior highs near $179 define initial support to watch on pullbacks.
>>> FEATURED STOCK ARTICLE : Quiet Gains Help Generic Drug Firm Rise Above 50-Day Average - 10/21/2014
View all notes |
Set NEW NOTE alert |
CANSLIM.net Company Profile |
SEC
News |
Chart |
Request a new note
C
A N
S L
I M


|
AFSI
-
NASDAQ
Amtrust Financial Svcs
INSURANCE - Property and; Casualty Insurance
|
$49.88
|
+3.18
6.81% |
$51.80
|
2,041,129
228.83% of 50 DAV
50 DAV is 892,000
|
$53.50
-6.77%
|
10/17/2014
|
$45.24
|
PP = $46.02
|
|
MB = $48.32
|
 Most Recent Note - 11/4/2014 12:28:33 PM
G - Recent low ($42.36 on 10/31/14) defines important near-term support. Gapped up today tallying a 3rd consecutive gain with above average volume, rallying back toward its 52-week high. Found support at its 50 DMA line when abruptly retreating last week following an analyst downgrade.
>>> FEATURED STOCK ARTICLE : Perched Near High After Rebounding From 200-Day Average - 10/17/2014
View all notes |
Set NEW NOTE alert |
CANSLIM.net Company Profile |
SEC
News |
Chart |
Request a new note
C
A N
S L
I M
|
ALXN
-
NASDAQ
Alexion Pharmaceuticals
DRUGS - Drug Manufacturers - Other
|
$191.30
|
+0.26
0.14% |
$193.19
|
612,200
50.35% of 50 DAV
50 DAV is 1,216,000
|
$197.23
-3.01%
|
10/23/2014
|
$184.01
|
PP = $185.53
|
|
MB = $194.81
|
Most Recent Note - 11/3/2014 6:11:03 PM
Y - Holding its ground at its 52-week high volume totals cooling. Prior highs in the $180 area define initial support to watch on pullbacks.
>>> FEATURED STOCK ARTICLE : Finished Strong After Gapping Up Above Prior High - 10/23/2014
View all notes |
Set NEW NOTE alert |
CANSLIM.net Company Profile |
SEC
News |
Chart |
Request a new note
C
A N
S L
I M
|
BIDU
-
NASDAQ
Baidu Inc Ads
INTERNET - Internet Information Providers
|
$241.96
|
+5.42
2.29% |
$242.14
|
3,857,718
104.26% of 50 DAV
50 DAV is 3,700,000
|
$242.62
-0.27%
|
10/30/2014
|
$234.08
|
PP = $231.51
|
|
MB = $243.09
|
Most Recent Note - 11/4/2014 5:43:47 PM
Y - Gain today on lighter volume for a best-ever close but still finished below its "max buy" level. Prior highs near $230 define near-term support to watch on pullbacks.
>>> FEATURED STOCK ARTICLE : Technical Breakout on Triple Average Volume Following Strong Earnings - 10/30/2014
View all notes |
Set NEW NOTE alert |
CANSLIM.net Company Profile |
SEC
News |
Chart |
Request a new note
C
A N
S L
I M
|
EPAM
-
NYSE
Epam Systems Inc
COMPUTER SOFTWARE and SERVICES - Information Technology Service
|
$46.61
|
-1.10
-2.31% |
$49.94
|
2,025,081
512.68% of 50 DAV
50 DAV is 395,000
|
$48.99
-4.86%
|
10/23/2014
|
$45.21
|
PP = $46.09
|
|
MB = $48.39
|
Most Recent Note - 11/4/2014 12:45:25 PM
Y - Gapped up and hit a new 52-week high today then reversed into the red for a considerable loss on heavy volume undercutting prior highs in the $44 area. The latest FSU analysis (10/24/14) reminded members - "Keep in mind that the high-ranked Computer - Tech Services firm is due to report earnings for the Sep '14 quarter on 11/04/14. Volume and volatility often increase near earnings news."
>>> FEATURED STOCK ARTICLE : Pulled Back After Challenging Prior Highs - 10/24/2014
View all notes |
Set NEW NOTE alert |
CANSLIM.net Company Profile |
SEC
News |
Chart |
Request a new note
C
A N
S L
I M
|
Symbol/Exchange
Company Name
Industry Group |
PRICE |
CHANGE
(%Change) |
Day High |
Volume
(% DAV)
(% 50 day avg vol) |
52 Wk Hi
% From Hi |
Featured
Date |
Price
Featured |
Pivot Featured |
|
Max Buy |
FB
-
NASDAQ
Facebook Inc Cl A
INTERNET
|
$75.76
|
+1.88
2.54% |
$75.77
|
39,166,861
99.22% of 50 DAV
50 DAV is 39,474,000
|
$81.16
-6.65%
|
9/9/2014
|
$76.67
|
PP = $76.84
|
|
MB = $80.68
|
Most Recent Note - 10/30/2014 1:01:31 PM
G - Falling again today with above average volume after a 50 DMA line violation on 3 times average volume raised concerns and triggered a technical sell signal on the prior session. Volume and volatility often increase near earnings news. The company reported earnings +59% on +59% sales for the Sep '14 quarter but warned of rising costs. Historic studies show that investors have a far better chance of success when buying as a stock is breaking out, not buying on pullbacks. See the latest FSU analysis for more details and annotated graphs.
>>> FEATURED STOCK ARTICLE : Gapped Down Following Latest Strong Earnings Report - 10/29/2014
View all notes |
Set NEW NOTE alert |
CANSLIM.net Company Profile |
SEC
News |
Chart |
Request a new note
C
A N
S L
I M
|
FLT
-
NYSE
Fleetcor Technologies
DIVERSIFIED SERVICES - Business/Management Services
|
$148.53
|
-1.70
-1.13% |
$149.94
|
652,243
89.96% of 50 DAV
50 DAV is 725,000
|
$153.52
-3.25%
|
10/31/2014
|
$148.50
|
PP = $146.29
|
|
MB = $153.60
|
Most Recent Note - 10/31/2014 5:58:07 PM
Y - Finished strong after highlighted in yellow with new pivot point cited based on its 9/18/14 high in a "double bottom" base in the earlier mid-day report (read here). Gapped up and hit a new 52-week high clinching a convincing technical buy signal. Reported earnings +27% on +31% sales revenues for the Sep '14 quarter, above the +25% minimum earnings guideline (C criteria). See the latest FSU analysis for more details and new annotated graphs.
>>> FEATURED STOCK ARTICLE : Strong Finish Following Gap Up After Earnings News - 10/31/2014
View all notes |
Set NEW NOTE alert |
CANSLIM.net Company Profile |
SEC
News |
Chart |
Request a new note
C
A N
S L
I M
|
ILMN
-
NASDAQ
Illumina Inc
DRUGS - Biotechnology
|
$191.41
|
-2.92
-1.50% |
$194.50
|
791,808
62.40% of 50 DAV
50 DAV is 1,269,000
|
$197.37
-3.02%
|
10/22/2014
|
$188.77
|
PP = $182.27
|
|
MB = $191.38
|
Most Recent Note - 10/30/2014 3:06:47 PM
G - Color code is changed to green while hitting a new 52-week high today and rallying above its "max buy" level. Prior highs near $182 define near-term support to watch on pullbacks.
>>> FEATURED STOCK ARTICLE : Breakout Cleared "Double Bottom" Base Pattern - 10/22/2014
View all notes |
Set NEW NOTE alert |
CANSLIM.net Company Profile |
SEC
News |
Chart |
Request a new note
C
A N
S L
I M
|
NBCB
-
NASDAQ
First N B C Bank Hldg
Banks-Southeast
|
$37.32
|
+0.18
0.48% |
$37.39
|
33,472
36.38% of 50 DAV
50 DAV is 92,000
|
$37.83
-1.35%
|
10/31/2014
|
$36.31
|
PP = $35.93
|
|
MB = $37.73
|
Most Recent Note - 11/3/2014 6:08:11 PM
Y - No resistance remains due to overhead supply after 8 consecutive gains. Finished strong after highlighted in yellow in the 10/31/14 mid-day report (read here). Reported earnings +35% on +21% sales revenues for the Sep '14 quarter, its 4th consecutive quarterly comparison above the +25% minimum earnings guideline (C criteria). See the latest FSU analysis for more details and new annotated graphs.
>>> FEATURED STOCK ARTICLE : Financial Firm at 52-Week High Tallied 8th Consecutive Gain - 11/3/2014
View all notes |
Set NEW NOTE alert |
CANSLIM.net Company Profile |
SEC
News |
Chart |
Request a new note
C
A N
S L
I M
|
PANW
-
NYSE
Palo Alto Networks
Computer Sftwr-Security
|
$106.71
|
+0.75
0.71% |
$106.98
|
1,000,950
43.67% of 50 DAV
50 DAV is 2,292,000
|
$108.50
-1.65%
|
7/30/2014
|
$84.21
|
PP = $85.88
|
|
MB = $90.17
|
Most Recent Note - 11/3/2014 6:09:43 PM
G - Stubbornly holding its ground with volume totals cooling while perched near its 52-week high, extended from any sound base. Its 50 DMA line ($97.27) defines important near-term support where a violation would trigger a technical sell signal.
>>> FEATURED STOCK ARTICLE : Rebound and Rally Leaves Tech Firm Extended From Base - 10/28/2014
View all notes |
Set NEW NOTE alert |
CANSLIM.net Company Profile |
SEC
News |
Chart |
Request a new note
C
A N
S L
I M
|
Symbol/Exchange
Company Name
Industry Group |
PRICE |
CHANGE
(%Change) |
Day High |
Volume
(% DAV)
(% 50 day avg vol) |
52 Wk Hi
% From Hi |
Featured
Date |
Price
Featured |
Pivot Featured |
|
Max Buy |
SNCR
-
NASDAQ
Synchronoss Technologies
COMPUTER SOFTWARE andamp; SERVICES - Application Software
|
$50.80
|
+0.20
0.40% |
$51.23
|
513,177
98.12% of 50 DAV
50 DAV is 523,000
|
$53.47
-4.99%
|
10/27/2014
|
$46.40
|
PP = $47.81
|
|
MB = $50.20
|
Most Recent Note - 10/30/2014 3:10:36 PM
G - Color code is changed to green while rallying well above the "max buy" level cited. Prior highs in the $47 area define initial support to watch on pullbacks. Considerable gain on 10/28/14 was backed by more than 4 times average volume after reporting earnings +35% on +40% sales revenues for the Sep '14 quarter. See the latest FSU analysis for more details and an annotated daily graph.
>>> FEATURED STOCK ARTICLE : No Resistance Remains; Perched at Secondary Buy Point - 10/27/2014
View all notes |
Set NEW NOTE alert |
CANSLIM.net Company Profile |
SEC
News |
Chart |
Request a new note
C
A N
S L
I M
|
STRT
-
NASDAQ
Strattec Security Corp
AUTOMOTIVE - Auto Parts
|
$102.65
|
+0.49
0.48% |
$104.49
|
38,908
138.96% of 50 DAV
50 DAV is 28,000
|
$109.44
-6.20%
|
9/19/2014
|
$86.06
|
PP = $89.97
|
|
MB = $94.47
|
Most Recent Note - 11/4/2014 5:45:39 PM
G - Hovering near its 52-week high, extended from its prior base after volume-driven gains. Prior highs in the $88 area define important near-term support to watch above its 50 DMA line. See the latest FSU analysis for more details and new annotated graphs.
>>> FEATURED STOCK ARTICLE : Stock With Small Supply Quickly Got Extended From Prior Base - 11/4/2014
View all notes |
Set NEW NOTE alert |
CANSLIM.net Company Profile |
SEC
News |
Chart |
Request a new note
C
A N
S L
I M
|
|
|
|
THESE ARE NOT BUY RECOMMENDATIONS!
Comments contained in the body of this report are technical
opinions only. The material herein has been obtained
from sources believed to be reliable and accurate, however,
its accuracy and completeness cannot be guaranteed.
This site is not an investment advisor, hence it does
not endorse or recommend any securities or other investments.
Any recommendation contained in this report may not
be suitable for all investors and it is not to be deemed
an offer or solicitation on our part with respect to
the purchase or sale of any securities. All trademarks,
service marks and trade names appearing in this report
are the property of their respective owners, and are
likewise used for identification purposes only.
This report is a service available
only to active Paid Premium Members.
You may opt-out of receiving report notifications
at any time. Questions or comments may be submitted
by writing to Premium Membership Services 665 S.E. 10 Street, Suite 201 Deerfield Beach, FL 33441-5634 or by calling 1-800-965-8307
or 954-785-1121.
|
|
|

