You are not logged in.
This means you
CAN ONLY VIEW reports that were published prior to Tuesday, April 15, 2025.
You
MUST UPGRADE YOUR MEMBERSHIP if you want to see any current reports.
AFTER MARKET UPDATE - FRIDAY, OCTOBER 31ST, 2014
Previous After Market Report Next After Market Report >>>
|
|
|
|
DOW |
+195.10 |
17,390.52 |
+1.13% |
|
Volume |
1,024,583,500 |
+40% |
|
Volume |
2,209,904,020 |
+18% |
|
NASDAQ |
+64.60 |
4,630.74 |
+1.41% |
|
Advancers |
2,387 |
75% |
|
Advancers |
2,122 |
70% |
|
S&P 500 |
+23.40 |
2,018.05 |
+1.17% |
|
Decliners |
722 |
23% |
|
Decliners |
826 |
27% |
|
Russell 2000 |
+17.74 |
1,173.51 |
+1.53% |
|
52 Wk Highs |
341 |
|
|
52 Wk Highs |
241 |
|
|
S&P 600 |
+11.02 |
679.50 |
+1.65% |
|
52 Wk Lows |
57 |
|
|
52 Wk Lows |
45 |
|
|
 |
Major Averages Rallied for a Strong October Finish
Kenneth J. Gruneisen - Passed the CAN SLIM® Master's Exam
With Friday's gains, the major averages finished up for October. For the month, the Dow rose +1.9%, the S&P 500 gained +2.2% and the NASDAQ advanced +3%. The volume totals were reported higher than the prior session totals on the NYSE and on the Nasdaq exchange, a reassuring sign of more aggressive buying demand coming from the institutional crowd. Breadth was positive as advancers led decliners by a 3-1 margin on the NYSE and 5-2 on the Nasdaq exchange. Leadership expanded substantially as there were 157 high-ranked companies from the CANSLIM.net Leaders List that made new 52-week highs and appeared on the CANSLIM.net BreakOuts Page, up from the prior session total of 80 stocks. The new 52-week highs totals swelled and easily outnumbered new 52-week lows on the NYSE and on the Nasdaq exchange. There were gains for 8 of the 12 high-ranked companies currently on the Featured Stocks Page, a list which recently gained several new companies as broader market conditions improved. Disciplined investors know that new buying efforts may be made under the fact-based investment system only in stocks meeting all key criteria.
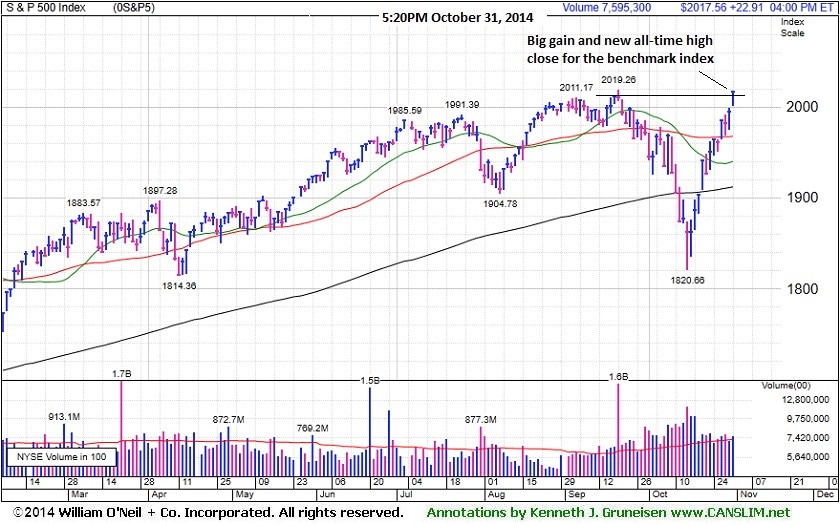
PICTURED: The benchmark S&P 500 Index advanced 23 points to close at a record level of 2,017.
Stocks ended a volatile October on a positive note. The Dow rose 195 points to an all-time high of 17,390. The NASDAQ climbed 65 points to 4,630.
The major averages rallied after the Bank of Japan unexpectedly increased its stimulus measures and the country's largest pension fund said it will increase its equity holdings. On the U.S. economic front, personal spending fell -0.2% in September while a gauge of consumer sentiment was revised to a seven year high.
Nine of 10 sectors in the S&P 500 were up on the session. Energy was the best performing group. Exxon (XOM +2.4%) and Chevron (CVX +2.4%) rose following their better-than-expected quarterly results. Among other earnings releases, GoPro (GPRO +13%) rose following the action camera maker’s increased its guidance. Shares of Starbucks (SBUX -2.3%) as sales trailed analyst projections. Utilities sat out the advance as Dominion Resources (D -0.4%) slipped.
Treasuries retreated with the benchmark 10-year notes down 7/32 to yield 2.33%. In commodities, WTI crude fell -0.6% to $80.60/barrel on the NYMEX. COMEX Gold futures dropped 2.3% to $1171.40/ounce.
Large gains on 10/21/14 backed by higher volume totals while leadership (stocks hitting new 52-week highs) expanded met the definition of a "follow-through day" confirming a new uptrend for the market (M criteria). The S&P 500 Index, Nasdaq Composite Index, and the Dow Jones Industrial Average have collectively rebounded above their respective 50-day and 200-day moving average (DMA) lines, technically putting the market in a healthier stance.
The CANSLIM.net Featured Stocks Page shows the most action-worthy candidates and their latest notes and a Headline Link directs members to the latest detailed analysis with data-packed graphs annotated by a Certified expert along with links to additional resources. The Premium Member Homepage includes "dynamic archives" to all prior pay reports published.
|
 Kenneth J. Gruneisen started out as a licensed stockbroker in August 1987, a couple of months prior to the historic stock market crash that took the Dow Jones Industrial Average down -22.6% in a single day. He has published daily fact-based fundamental and technical analysis on high-ranked stocks online for two decades. Through FACTBASEDINVESTING.COM, Kenneth provides educational articles, news, market commentary, and other information regarding proven investment systems that work in good times and bad.
Comments contained in the body of this report are technical opinions only and are not necessarily those of Gruneisen Growth Corp. The material herein has been obtained from sources believed to be reliable and accurate, however, its accuracy and completeness cannot be guaranteed. Our firm, employees, and customers may effect transactions, including transactions contrary to any recommendation herein, or have positions in the securities mentioned herein or options with respect thereto. Any recommendation contained in this report may not be suitable for all investors and it is not to be deemed an offer or solicitation on our part with respect to the purchase or sale of any securities. |
|
 |
Tech, Financial, Retail, and Energy-Related Groups Rose; XAU Down Big Again
Kenneth J. Gruneisen - Passed the CAN SLIM® Master's Exam
The Broker/Dealer Index ($XBD +2.18%) and Bank Index ($BKX +1.33%) were positive influences on the major averages on Friday, and the Retail Index ($RLX +1.27%) also underpinned the broad-based rally. The Semiconductor Index ($SOX +3.87%) led the tech sector and the Networking Index ($NWX +1.40%) also ratcheted higher, meanwhile the Biotechnology Index ($BTK +0.17%) only posted a very small gain. Energy-related shares also had a positive bias as the Oil Services Index ($OSX +1.55%) and the Integrated Oil Index ($XOI +1.58%) both posted gains.
Charts courtesy www.stockcharts.com
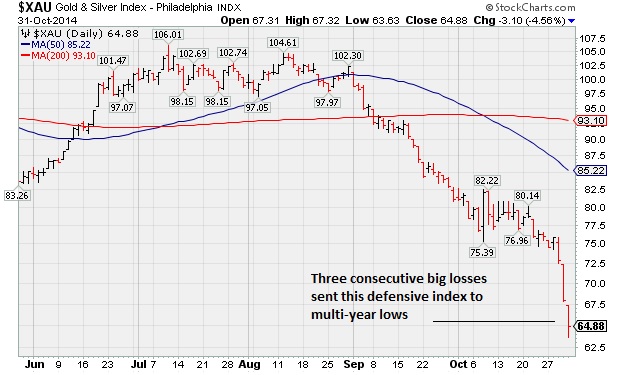
PICTURED: The Gold & Silver Index ($XAU -4.55%) was a standout decliner with a 3rd considerable loss sending the defensive index to multi-year lows.
| Oil Services |
$OSX |
248.74 |
+3.79 |
+1.55% |
-11.49% |
| Integrated Oil |
$XOI |
1,485.08 |
+23.11 |
+1.58% |
-1.20% |
| Semiconductor |
$SOX |
640.86 |
+23.90 |
+3.87% |
+19.78% |
| Networking |
$NWX |
332.34 |
+4.58 |
+1.40% |
+2.59% |
| Broker/Dealer |
$XBD |
174.67 |
+3.72 |
+2.18% |
+8.79% |
| Retail |
$RLX |
954.18 |
+11.98 |
+1.27% |
+1.53% |
| Gold & Silver |
$XAU |
64.88 |
-3.09 |
-4.55% |
-22.90% |
| Bank |
$BKX |
72.14 |
+0.95 |
+1.33% |
+4.16% |
| Biotech |
$BTK |
3,354.32 |
+5.65 |
+0.17% |
+43.94% |
|
|
|
 |
Strong Finish Following Gap Up After Earnings News
Kenneth J. Gruneisen - Passed the CAN SLIM® Master's Exam
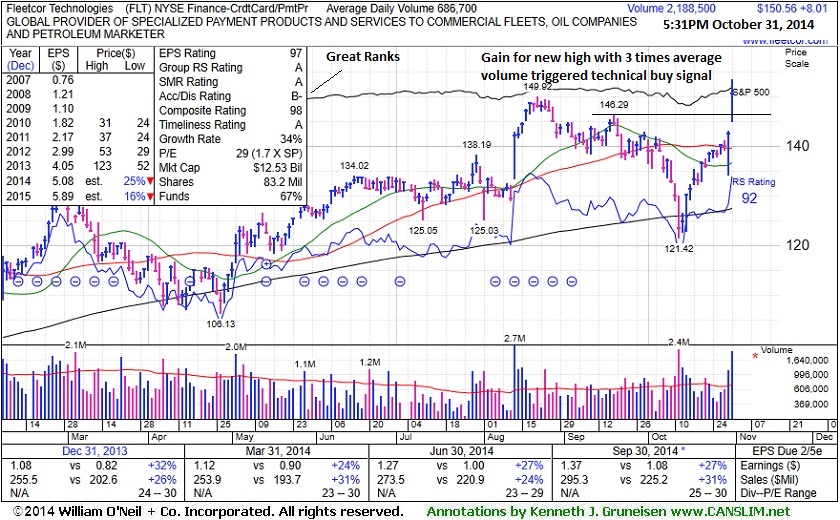
FleetCor Technologies, Inc's (FLT +$8.01 or +5.62% to $150.56) finished strong after highlighted in yellow with new pivot point cited based on its 9/18/14 high in a "double bottom" base (read here). It gapped up hitting a new 52-week high and clinched a convincing technical buy signal. It reported earnings +27% on +31% sales revenues for the Sep '14 quarter, continuing its strong earnings history with results above the +25% minimum guideline (C criteria).
FLT last appeared in this FSU section on 3/24/14 with annotated graphs under the headline, "Negated Recent Breakout and Testing Support at 50-Day Average", as its slump below its old high close ($122.70 on 12/02/13) raised concerns as it completely negated the prior breakout. Its Relative Strength rating has improved to 92, above the 80+ minimum guideline for buy candidates.
It found support at its 200 DMA line during its consolidation since last noted in the 8/25/14 mid-day report - "It did not form a sound base and made a choppy ascent since dropped from the Featured Stocks list on 4/07/14. Patient investors may watch for a new base to possibly form.
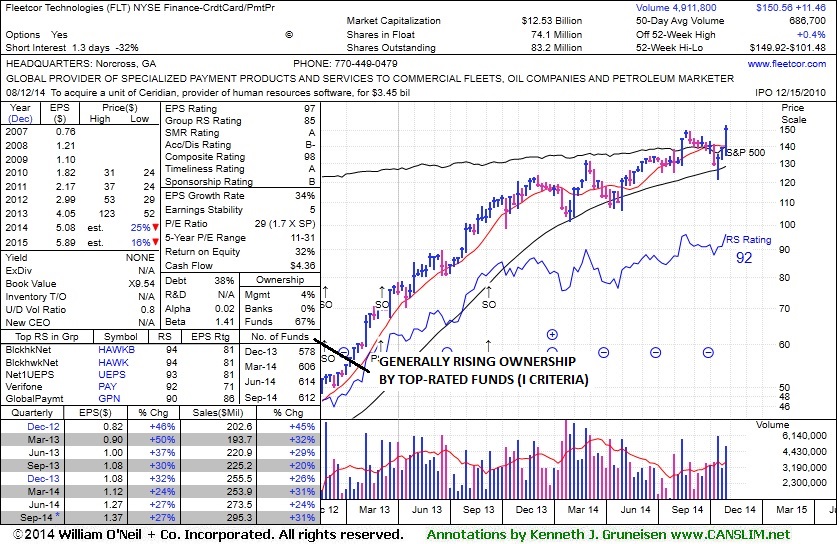
The company hails from the Finance - Credit Card Payment Processing group which saw big gains this week from Visa (V) and MasterCard (MA). and the impressive strength and leadership from other firms in the same industry group is a reassurance concerning the L criteria. The company completed a Secondary Offering on 9/11/13. Prior Secondary Offerings on 3/14/12, 6/11/12, 11/29/12, and 3/08/13 were previously noted, "Such offerings often are a short-term hindrance to upward price progress yet typically result in broader institutional ownership interest." The number of top-rated funds owning its shares rose from 193 in Mar '12 to 612 in Sep '14, a reassuring sign concerning the I criteria.
|
|
|
Color Codes Explained :
Y - Better candidates highlighted by our
staff of experts.
G - Previously featured
in past reports as yellow but may no longer be buyable under the
guidelines.
***Last / Change / Volume data in this table is the closing quote data***
Symbol/Exchange
Company Name
Industry Group |
PRICE |
CHANGE
(%Change) |
Day High |
Volume
(% DAV)
(% 50 day avg vol) |
52 Wk Hi
% From Hi |
Featured
Date |
Price
Featured |
Pivot Featured |
|
Max Buy |
ACT
-
NYSE
Actavis plc
Medical-Generic Drugs
|
$242.74
|
-0.47
-0.19% |
$247.38
|
1,744,217
81.32% of 50 DAV
50 DAV is 2,145,000
|
$249.94
-2.88%
|
6/20/2014
|
$216.53
|
PP = $230.87
|
|
MB = $242.41
|
Most Recent Note - 10/30/2014 3:13:16 PM
G - Color code is changed to green after rallying beyond its "max buy" level and hitting a new 52-week high today. Prior highs near $179 define initial support to watch on pullbacks.
>>> FEATURED STOCK ARTICLE : Quiet Gains Help Generic Drug Firm Rise Above 50-Day Average - 10/21/2014
View all notes |
Set NEW NOTE alert |
CANSLIM.net Company Profile |
SEC
News |
Chart |
Request a new note
C
A N
S L
I M


|
AFSI
-
NASDAQ
Amtrust Financial Svcs
INSURANCE - Property and; Casualty Insurance
|
$44.87
|
+0.76
1.72% |
$45.28
|
2,352,794
280.76% of 50 DAV
50 DAV is 838,000
|
$53.50
-16.13%
|
10/17/2014
|
$45.24
|
PP = $46.02
|
|
MB = $48.32
|
Most Recent Note - 10/30/2014 6:03:52 PM
G - Slumped back into the prior base today with another damaging volume-driven loss. Completely negated the recent technical breakout and raised concerns while slumping toward its 50 DMA line ($43.13). Abruptly retreated from its 52-week high following an analyst downgrade.
>>> FEATURED STOCK ARTICLE : Perched Near High After Rebounding From 200-Day Average - 10/17/2014
View all notes |
Set NEW NOTE alert |
CANSLIM.net Company Profile |
SEC
News |
Chart |
Request a new note
C
A N
S L
I M
|
ALXN
-
NASDAQ
Alexion Pharmaceuticals
DRUGS - Drug Manufacturers - Other
|
$191.36
|
-1.57
-0.81% |
$197.23
|
1,237,877
102.81% of 50 DAV
50 DAV is 1,204,000
|
$194.20
-1.46%
|
10/23/2014
|
$184.01
|
PP = $185.53
|
|
MB = $194.81
|
Most Recent Note - 10/28/2014 6:34:35 PM
Y - Inched higher for another new 52-week high with today's 4th consecutive gain backed by lighter volume. Prior highs in the $180 area define initial support to watch on pullbacks.
>>> FEATURED STOCK ARTICLE : Finished Strong After Gapping Up Above Prior High - 10/23/2014
View all notes |
Set NEW NOTE alert |
CANSLIM.net Company Profile |
SEC
News |
Chart |
Request a new note
C
A N
S L
I M
|
BIDU
-
NASDAQ
Baidu Inc Ads
INTERNET - Internet Information Providers
|
$238.77
|
+1.76
0.74% |
$242.62
|
6,253,139
174.13% of 50 DAV
50 DAV is 3,591,000
|
$237.55
0.51%
|
10/30/2014
|
$234.08
|
PP = $231.51
|
|
MB = $243.09
|
Most Recent Note - 10/30/2014 6:13:05 PM
Y - Finished strong and clinched a convincing technical buy signal after highlighted in yellow with pivot point cited based on its 9/19/14 high plus 10 cents in the earlier mid-day report (read here). Reported earnings +28% on +52% sales revenues for the Sep '14 quarter, its 3rd consecutive quarterly comparison with earnings above the +25% minimum guideline (C criteria). See the latest FSU analysis for more details and new annotated graphs.
>>> FEATURED STOCK ARTICLE : Technical Breakout on Triple Average Volume Following Strong Earnings - 10/30/2014
View all notes |
Set NEW NOTE alert |
CANSLIM.net Company Profile |
SEC
News |
Chart |
Request a new note
C
A N
S L
I M
|
EPAM
-
NYSE
Epam Systems Inc
COMPUTER SOFTWARE and SERVICES - Information Technology Service
|
$47.74
|
+0.60
1.27% |
$48.99
|
752,756
199.67% of 50 DAV
50 DAV is 377,000
|
$47.50
0.51%
|
10/23/2014
|
$45.21
|
PP = $46.09
|
|
MB = $48.39
|
 Most Recent Note - 10/31/2014 6:05:10 PM
Y - Traded near is "max buy" level today and hit a new 52-week high with another gain backed by above average volume. Near term support to watch is at prior highs in the $44 area. Rally recently cleared the pivot point cited triggering a technical buy signal.
>>> FEATURED STOCK ARTICLE : Pulled Back After Challenging Prior Highs - 10/24/2014
View all notes |
Set NEW NOTE alert |
CANSLIM.net Company Profile |
SEC
News |
Chart |
Request a new note
C
A N
S L
I M
|
Symbol/Exchange
Company Name
Industry Group |
PRICE |
CHANGE
(%Change) |
Day High |
Volume
(% DAV)
(% 50 day avg vol) |
52 Wk Hi
% From Hi |
Featured
Date |
Price
Featured |
Pivot Featured |
|
Max Buy |
FB
-
NASDAQ
Facebook Inc Cl A
INTERNET
|
$74.99
|
+0.88
1.19% |
$75.70
|
44,478,625
115.27% of 50 DAV
50 DAV is 38,588,000
|
$81.16
-7.60%
|
9/9/2014
|
$76.67
|
PP = $76.84
|
|
MB = $80.68
|
Most Recent Note - 10/30/2014 1:01:31 PM
G - Falling again today with above average volume after a 50 DMA line violation on 3 times average volume raised concerns and triggered a technical sell signal on the prior session. Volume and volatility often increase near earnings news. The company reported earnings +59% on +59% sales for the Sep '14 quarter but warned of rising costs. Historic studies show that investors have a far better chance of success when buying as a stock is breaking out, not buying on pullbacks. See the latest FSU analysis for more details and annotated graphs.
>>> FEATURED STOCK ARTICLE : Gapped Down Following Latest Strong Earnings Report - 10/29/2014
View all notes |
Set NEW NOTE alert |
CANSLIM.net Company Profile |
SEC
News |
Chart |
Request a new note
C
A N
S L
I M
|
FLT
-
NYSE
Fleetcor Technologies
DIVERSIFIED SERVICES - Business/Management Services
|
$150.56
|
+8.01
5.62% |
$153.52
|
2,188,590
319.04% of 50 DAV
50 DAV is 686,000
|
$149.92
0.43%
|
10/31/2014
|
$148.50
|
PP = $146.29
|
|
MB = $153.60
|
Most Recent Note - 10/31/2014 5:58:07 PM
Y - Finished strong after highlighted in yellow with new pivot point cited based on its 9/18/14 high in a "double bottom" base in the earlier mid-day report (read here). Gapped up and hit a new 52-week high clinching a convincing technical buy signal. Reported earnings +27% on +31% sales revenues for the Sep '14 quarter, above the +25% minimum earnings guideline (C criteria). See the latest FSU analysis for more details and new annotated graphs.
>>> FEATURED STOCK ARTICLE : Strong Finish Following Gap Up After Earnings News - 10/31/2014
View all notes |
Set NEW NOTE alert |
CANSLIM.net Company Profile |
SEC
News |
Chart |
Request a new note
C
A N
S L
I M
|
ILMN
-
NASDAQ
Illumina Inc
DRUGS - Biotechnology
|
$192.58
|
-0.84
-0.43% |
$197.37
|
1,247,778
99.11% of 50 DAV
50 DAV is 1,259,000
|
$194.77
-1.12%
|
10/22/2014
|
$188.77
|
PP = $182.27
|
|
MB = $191.38
|
Most Recent Note - 10/30/2014 3:06:47 PM
G - Color code is changed to green while hitting a new 52-week high today and rallying above its "max buy" level. Prior highs near $182 define near-term support to watch on pullbacks.
>>> FEATURED STOCK ARTICLE : Breakout Cleared "Double Bottom" Base Pattern - 10/22/2014
View all notes |
Set NEW NOTE alert |
CANSLIM.net Company Profile |
SEC
News |
Chart |
Request a new note
C
A N
S L
I M
|
NBCB
-
NASDAQ
First N B C Bank Hldg
Banks-Southeast
|
$36.73
|
+1.24
3.49% |
$36.90
|
168,645
179.41% of 50 DAV
50 DAV is 94,000
|
$36.57
0.44%
|
10/31/2014
|
$36.31
|
PP = $35.93
|
|
MB = $37.73
|
Most Recent Note - 10/31/2014 6:02:44 PM
Y - Finished strong after highlighted in yellow with pivot point cited based on its 4/02/14 high plus 10 cents in the earlier mid-day report (read here). The big gain above the pivot point backed by +79% above average volume clinched a technical buy signal. Hit a new 52-week high and no resistance remains due to overhead supply after 7 consecutive gains with ever-increasing volume. Reported earnings +35% on +21% sales revenues for the Sep '14 quarter, its 4th consecutive quarterly comparison above the +25% minimum earnings guideline (C criteria).
There are no Featured Stock Updates™ available for this stock at this time. You may request one by clicking the Request a New Note link below
View all notes |
Set NEW NOTE alert |
CANSLIM.net Company Profile |
SEC
News |
Chart |
Request a new note
C
A N
S L
I M
|
PANW
-
NYSE
Palo Alto Networks
Computer Sftwr-Security
|
$105.70
|
+0.77
0.73% |
$107.40
|
1,179,451
51.84% of 50 DAV
50 DAV is 2,275,000
|
$108.50
-2.58%
|
7/30/2014
|
$84.21
|
PP = $85.88
|
|
MB = $90.17
|
Most Recent Note - 10/28/2014 6:47:07 PM
G - Perched near its 52-week high, extended from any sound base. Its 50 DMA line ($95.67) defines important near-term support where a violation would trigger a technical sell signal. See the latest FSU analysis for more details and new annotated graphs.
>>> FEATURED STOCK ARTICLE : Rebound and Rally Leaves Tech Firm Extended From Base - 10/28/2014
View all notes |
Set NEW NOTE alert |
CANSLIM.net Company Profile |
SEC
News |
Chart |
Request a new note
C
A N
S L
I M
|
Symbol/Exchange
Company Name
Industry Group |
PRICE |
CHANGE
(%Change) |
Day High |
Volume
(% DAV)
(% 50 day avg vol) |
52 Wk Hi
% From Hi |
Featured
Date |
Price
Featured |
Pivot Featured |
|
Max Buy |
SNCR
-
NASDAQ
Synchronoss Technologies
COMPUTER SOFTWARE andamp; SERVICES - Application Software
|
$51.67
|
-0.66
-1.26% |
$53.10
|
811,744
159.79% of 50 DAV
50 DAV is 508,000
|
$53.47
-3.37%
|
10/27/2014
|
$46.40
|
PP = $47.81
|
|
MB = $50.20
|
Most Recent Note - 10/30/2014 3:10:36 PM
G - Color code is changed to green while rallying well above the "max buy" level cited. Prior highs in the $47 area define initial support to watch on pullbacks. Considerable gain on 10/28/14 was backed by more than 4 times average volume after reporting earnings +35% on +40% sales revenues for the Sep '14 quarter. See the latest FSU analysis for more details and an annotated daily graph.
>>> FEATURED STOCK ARTICLE : No Resistance Remains; Perched at Secondary Buy Point - 10/27/2014
View all notes |
Set NEW NOTE alert |
CANSLIM.net Company Profile |
SEC
News |
Chart |
Request a new note
C
A N
S L
I M
|
STRT
-
NASDAQ
Strattec Security Corp
AUTOMOTIVE - Auto Parts
|
$103.72
|
+0.76
0.74% |
$104.47
|
27,192
97.11% of 50 DAV
50 DAV is 28,000
|
$109.44
-5.23%
|
9/19/2014
|
$86.06
|
PP = $89.97
|
|
MB = $94.47
|
Most Recent Note - 10/29/2014 5:51:31 PM
G - Pulled back from its 52-week high today following 4 consecutive volume-driven gains. It is very extended beyond its "max buy" level. Prior highs in the $88 area define important near-term support to watch above its 50 DMA line.
>>> FEATURED STOCK ARTICLE : Building Base-On-Base Pattern Ahead of Earnings News - 10/20/2014
View all notes |
Set NEW NOTE alert |
CANSLIM.net Company Profile |
SEC
News |
Chart |
Request a new note
C
A N
S L
I M
|
|
|
|
THESE ARE NOT BUY RECOMMENDATIONS!
Comments contained in the body of this report are technical
opinions only. The material herein has been obtained
from sources believed to be reliable and accurate, however,
its accuracy and completeness cannot be guaranteed.
This site is not an investment advisor, hence it does
not endorse or recommend any securities or other investments.
Any recommendation contained in this report may not
be suitable for all investors and it is not to be deemed
an offer or solicitation on our part with respect to
the purchase or sale of any securities. All trademarks,
service marks and trade names appearing in this report
are the property of their respective owners, and are
likewise used for identification purposes only.
This report is a service available
only to active Paid Premium Members.
You may opt-out of receiving report notifications
at any time. Questions or comments may be submitted
by writing to Premium Membership Services 665 S.E. 10 Street, Suite 201 Deerfield Beach, FL 33441-5634 or by calling 1-800-965-8307
or 954-785-1121.
|
|
|

